ARE THE TURKISH EXTERNAL DEFICITS SUSTAINABLE? EVIDENCE FROM THE COINTEGRATING RELATIONSHIP
BETWEEN EXPORTS AND IMPORTS
Utku UTKULU (*)
ABSTRACT
This paper aims to understand the recent history of Turkish external imbalances by examining the long-run tendency of the Turkish trade balance. The size of the Turkish external deficits especially during the 1990s has worried politicians, academicians and the general public. Following recent work in the field, the paper examines the sustainability of the external deficits in the long-run by employing the cointegration framework.
I.INTRODUCTION
Unit root and cointegration tests have provided useful tools in gaining insight into the long-run implications of a government’s or nation’s intertemporal solvency. Thus, researchers have attempted to test the solvency condition within the unit root and cointegration framework recently. In short, cointegration is a necessary condition for the economy to be obeying its intertemporal budget constraint. The test determines whether a government or country is likely to be able to sustain its budget or external deficits without defaulting on the debt. Such tests are first found in the literature regarding a government’s solvency, beginning with the contribution by Hamilton and Flavin (1986) and developed by Wilcox (1989), Trehan and Walsh (1988, 1991), Hakkio and Rush (1991a), Corsetti and Roubini (1991), Buiter and Patel (1992), Tanner and Liu (1994), Liu and Tanner (1995), Tanner (1995). Özatay (1994) applies the procedure to the Turkish case to test the sustainability of the Turkish public sector deficits. All the above mentioned studies test the sustainability of the government’s (internal) deficits in closed economy settings.
In evaluating the sustainability of the external deficits in open economy settings, one may apply the methodology developed by Trehan and Walsh (1991). In Trehan and Walsh’s procedure, the stationarity of the discounted real external debt stock is a sufficient condition for sustainability of the external deficits. Alternatively, Hakkio and Rush (1991a) propose a method in which cointegrating (long-run equilibrium) properties of the exports and imports variables are tested. In this framework, cointegration of the exports and imports variables is a necessary condition for the country to have sustainable external deficits (ie. intertemporal external solvency). Both Trehan and Walsh, and Hakkio and Rush start with a balance of payments identity, and then obeying
(*)Yrd.Doç.Dr. D.E.Ü.İ.İ.B.F.İktisat Bölümü
External Deficits Sustainability
intertemporal budget constraints, they derive some testable empirical models. Sawada (1994), e.g., gives some clear explanation about the theoretical reasons behind such empirical models. Sawada, using Trehan-Walsh and Hakkio-Rush propositions, reaches some testable sustainability conditions and applies them to some heavily indebted developing countries to evaluate their external solvency. Recently, some works such as Bean (1991), Dolado and Vinals (1991), Trehan and Walsh (1991), Husted (1992), Wickens and Uctum (1993), Bahmani-Oskooee (1994) analyze the sustainability of external deficits (i.e. external solvency) in developed countries. Bahmani-Oskooee and Domac (1995) applies the methodology to the growing Turkish external deficits. They are able to find evidence of cointegration between imports and exports, only when the structural break in 1973 is incorporated into cointegrating equations.
Recent history of the growing Turkish external deficits has caused some concern in both the academic and political worlds on the sustainability issue. The aim of this paper is to investigate the long-run relationship between exports and imports to see if Turkish external deficits are sustainable by employing the cointegration method. The presence of a long-run relationship between Turkish exports and imports would imply that the two series would never drift “too far” apart, i.e. the difference between them is stationary in time although they are not. What we do, in that sense, is to test if the discrepancy between Turkish exports and imports grows without bound or not. The remainder of the paper is organised as follows. Section II sets out the econometric methodology used. The data and empirical results are presented in Section III. The final section offers some concluding remarks on the results obtained.
II. ECONOMETRIC METHODOLOGY
In this paper, Engle and Granger (1987) cointegration procedure1 is
employed following Husted (1992), Oskooee (1994) and Bahmani-Oskooee and Domac (1995). This is a two-step procedure. First, a time series, say, Xt is said to be integrated of order d if, after differencing d times, it becomes stationary, denoted as X~I(d). Let us now outline the augmented Dickey-Fuller (ADF hereafter) test procedure for unit roots. In practice, the following model is estimated by OLS:
1There exits a huge literature in this field. For a clear and practical explanation of integration and cointegration procedures, see Charemza and Deadman (1992). For more detailed information, see e.g. Banerjee et. al. (1993).
(1)
where t, ∆, β and e∆y
tt
y
t iy
t i p t= +
+
−+
−+
=∑
β α
δ
1φ
1∆
ie
t represent the time trend, the first-difference operator, the constant term and a sequence of uncorrelated stationary error terms with zero mean and constant variance respectively. An easy and appropriate method of testing the order of integration of a series, say yt, is suggested by Dickey and Fuller (1979, 1981). The DF test consists of testing the negativity of δ in regression (1). rejection of the null hypothesis δ=0 in favour of the alternative δ<0 implies that yt is stationary (i.e. integrated of order zero, yt ∼ I(0)). For equation (1), the t and F distributions are not appropriate (due to nonstationarity) for testing the null. Corrected critical value tables of the t statistic in the ADF regression of (1) are reported by Fuller (1976), MacKinnon (1991), and Charemza and Deadman (1992). Since the distribution of the t statistic in this case is not known precisely, it should be obtained by simulation, and thus the critical values are subject to some error. The null is rejected if the value of the t statistic has a larger negative value than the corresponding critical value. In practice, it is not clear whether one should use the ADF regression (1) with or without intercept term and time trend. Charemza and Deadman (1992, 134) argue that regression with intercept term sometimes produce results that are rather difficult to interpret. In the next Section, we report the results with intercept only. But, to ensure the robustness of the results we also checked for the test results without intercept which are in line with our reported test results. Evidence suggest that in practice most macroeconomic data have mixed underlying processes (i.e. a mixture of ‘deterministic’ (TSP) and ‘stochastic’ (DSP) processes). Perhaps, a more reasonable explanation would be that in many cases we have a DSP (difference stationary process) dominant mixed process. This is why we include the time trend in the ADF equation as long as it is statistically significant.
Two time series, Xt and Yt are said to be cointegrated of order d,b where d>b>0, denoted as
Xt,Yt ~ CI(d,b), if:
(a) both are I(d), and
(b) their linear combination a1.Xt + a2.Yt is I(d-b); that is, the residuals of
the long-run regression should be stationary (i.e. integrated of order zero). The vector [a1,a2] is referred to as the "cointegrating vector" (see Engle and Granger, 1987). We employ the ADF test and the residual-based ADF test to determine the integration level and the possible cointegration between the variables
External Deficits Sustainability
respectively.2 Therefore, in testing for cointegration we should first make sure that
both series are integrated of the same order. Next we estimate the following cointegrating regressions by OLS:
Xt = α0 + β0Yt + ut (2) Yt = α1 + β1Xt + u’t (3)
Finally, we test for the stationarity of the residuals from equations 2 and 3 to make sure that ut and u’t∼ I(d-b), where b>0. e.g. if Xt∼ I(1) and Yt∼ I(1), in
order for Xt and Yt to be cointegrated, ut and u’t should be I(0).
In determining the optimal lag structure in the ADF testing procedure (both for unit roots and cointegration), in addition to t-ratios, we also rely on the model selection criterions of Akaike Information, Schwarz Bayesian, Maximized log-likelihood and Hannan-Quinn since arbitrary choice of the lag structure may easily result in wrong conclusions.
III.DATA AND EMPIRICAL RESULTS
Cointegration is essentially a long-run concept and hence requires
long spans of data to give tests for cointegration much power rather than
simply large number of observations (Hakkio and Rush, 1991b). We
investigate the long-run relationship between total exports, X, and total
imports, M, both expressed in US dollars using annual data for the period
1950-1996.
3When exports are the dependent variable in the cointegrating
regression, the positive slope coefficient suggests that an increase in
imports results in an increase in exports. This is due to the presence of
imports of raw materials that are essential for the production of exportables
as well as non-traded goods (for the same point, see Bahmani-Oskooee and
Domac, 1995). Similarly, when imports are the dependent variable in the
cointegrating regression, the positive slope coefficient implies that an
increase in exports results in an increase in imports since export earnings
are used to finance imports. If export earnings decline, this will then results
in a shortage of foreign currency which in the end may force policy makers
to restrict imports.
2Haug (1993) compares seven different residual-based tests for cointegration with the Monte Carlo method. Among the tests considered, Engle-Granger's residual-based ADF test shows the least size distortion.
3 Note that results with real exports and real imports were not different than those reported in the paper. Results are available on request.
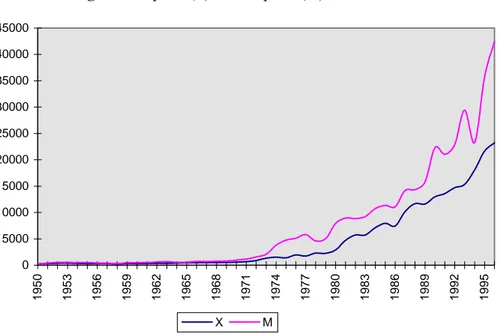
Figure 1 also shows that both variables are clearly nonstationary in
levels as they are both subject to a positive trend. Results in Table 1
suggest that both variables are integrated of order two; X
∼
I(2) and M
∼
I(2).
This may due to spurious roots created by the possible structural break in
the series.
4A brief description of the AOM (additive outlier model) version ofthe Perron test for integration level for structural break is as follows. This is a two-step procedure (Perron, 1990, 1994; Perron and Vogelsang, 1992):
1st step: let yt be the residuals from a regression (by employing OLS method of estimation) of Yt on an intercept term, time trend and DUt where
DUt =1 if t>Tb and 0 otherwise.
2nd step: run the following modified regression (by OLS) and test the negativity of α by using appropriate critical values in Perron (1990, Table 4).
∆yt ayt d D TBj t j a y u j k i t i i k t = - + ) -= -= 1 0 1 (
∑
+∑
∆ + (4)where D(TB)t = 1 if t = Tb +1 and 0 otherwise. Tb is the break year.
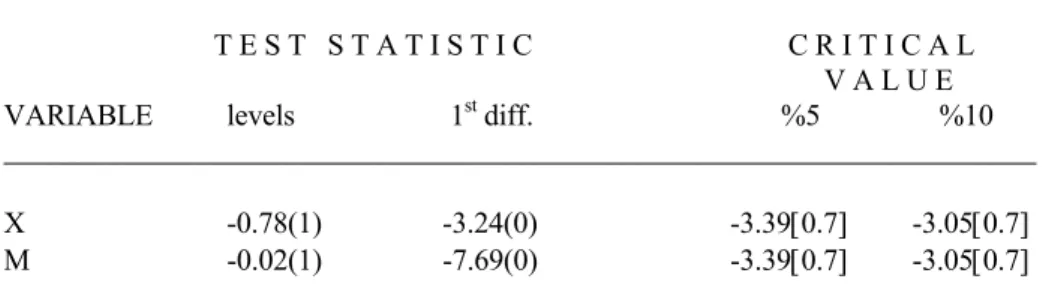
Our Perron unit root test (additive outlier model, AOM version is preferred) results for structural break suggest that (see Table 2), when breaks in the early
4 It has recently been argued (esp. Perron, 1989, 1990, 1994) that structural breaks can change the order of integration of the series by, i.e., creating spurious unit roots. In short, a structural break in the mean level is a sort of exogenous intervention to the series. Perron (1990) argues that ignoring these effects can lead to inadequate model specifications, spurious unit roots, poor forecasts and improper policy implications. Perron (1990, 1994) and Perron and Vogelsang (1992), in the same direction, propose a test for integration level for structural break known the ‘Perron test’ (hereafter) and provide the appropriate critical values. What the test does is that it removes a particular break from the noise function and add it to the deterministic part of the series. The noise function is then analysed without the effect of the break (i.e. application of the standard unit root testing). The test should be seen as an improvement in the direction of searching and creating more informative economic time-series. In fact, by employing the Perron test, one is not testing the presence of a structural break. Instead, whether or not the integration level of the series is changed by the structural change, is tested. In contrast to Christiano (1992), the Perron method determines the break data exogenously. For a recent application of the test to some Turkish macroeconomic data, see Utkulu (1997).
External Deficits Sustainability
1980s are taken into account5, both series are integrated of order one. To ensure
that our hypothesised break year is correctly chosen, we also calculate the split-sample ADF statistics. Our split-split-sample ADF test results confirm the validity of our choice for break year (available on request).
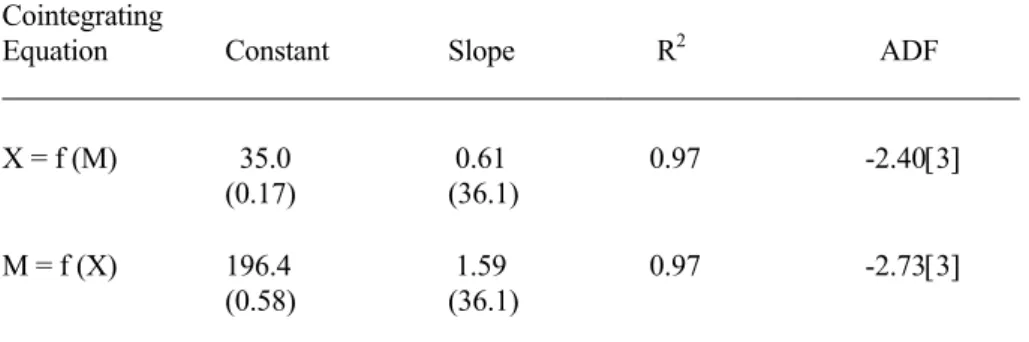
Table 3 shows the results of the residual-based ADF cointegration test. It is clear from the evidence that the null hypothesis of no cointegration cannot be rejected at 5% significance level, i.e. the estimated residuals are nonstationary. According to this evidence, one is able to conclude that the Turkish exports and imports variables are not cointegrated, which implies that the external deficits in the long-run do grow without bound. Given the size of the R2 and highly significant slope coefficients one wonders why there is lack of long-run relationship between exports and imports. One possibility is that this is due to a structural change in the mean level in the series involved.
Bahmani-Oskooee and Domac (1995) employs the F-Max test of Christiano (1992) to identify the year of structural break over the 1947-1990 period. Their results indicated that variables experienced a break in 1973. However, using annual data over 1950-1996 period, we failed to observe a break in 1973 when dummy included in the ADF testing procedure. Following the procedure in Bahmani-Oskooee and Domac (1995), we also tried including dummy for 1973 in the cointegrating regression. No significant t-values for the dummy were obtained. However, our search showed (statistically significant) breaks for exports and imports variables in 1980-1981, the year in which Turkey adopted trade liberalisation policies. Accordingly, we include only dummy variable DU for the year 1981 (where DUt=1 if t>1981 and 0 otherwise) in our cointegrating regressions and test for the stationarity of the residuals using the residual-based ADF test (see Table 4).
There is however a debate in the literature on what critical values should be used to judge the significance of the residual-based ADF test when a dummy variable is included in the cointegrating equations. To the best of our knowledge, there exists three paths. First, we can rely on critical values reported by Husted (1992). He reports critical values of -3.88 and -3.57 at the 5% and 10% significance levels, respectively, for 100 observations. Although, our sample size is 47, the calculated residual-based ADF statistics are much bigger than his critical values, showing that we cannot assume stationary residuals. Second, one can follow Ireland and Wren-Lewis (1992), argued that since the dummy is not stochastic, it could be interpreted as modification to the intercept term. This sort of explanation allows researchers not to regard the dummy as an extra variable and
5 Note that dummy for the year 1981 turn out to be the most significant one in the Perron equation for unit roots. We also checked for the early 1970s and 1995 but failed to observe a significant dummy variable in the Perron AOM testing procedure.
use the same critical values. The residual-based ADF statistics in Table 4 are all higher than the MacKinnon (1991) critical values reported in Table 3, providing evidence of no cointegration between relevant variables. Finally, by assuming that there are three variables in each cointegrating regression (exports, imports, DU), we use the MacKinnon critical values for cointegration among the three variables. Once again, there is evidence of no cointegration since we cannot reject the null.
IV.CONCLUDING REMARKS
The paper analyzes the long-run tendency of the Turkish exports and imports over 1950-1996 by using annual data. We have evidence of no cointegration between exports and imports implying that external deficits are not sustainable (violating its intertemporal budget constraint) in the long-run due to growing external deficits. This finding is not consistent with the evidence from Bahmani-Oskooee and Domac (1995), since they found evidence that Turkish exports and imports are cointegrated when only dummy variable is included in the cointegrating regression.
The empirical evidence provided shows that not only Turkey’s exports and imports are not cointegrated, but the slope coefficient is not close to one. Following Bahmani-Oskooee (1994), one can interpret the findings not only as an indication of unsustainability of Turkey’s trade balance in the long-run but also as an indication of the ineffectiveness of fiscal, monetary and exchange rate policies. Accordingly, Turkey’s macroeconomic policies have been ineffective in making exports and imports converge toward an equilibrium in the long-run. Since it is clear from the evidence that Turkey cannot sustain its trade deficits in the long-run, measures, especially to promote exports to close the gap, are needed to change the current strategy.
External Deficits Sustainability Data sources
The data used in this study are annual for the period of 1950-1996 and are taken from the State Institute of Statistics (SIS).
Definitions of the Variables
X: Turkish exports expressed in US dollars. M: Turkish imports expressed in US dollars.
Figures
Figure 1. Exports (X) and Imports (M), 1950-1996
0 5000 10000 15000 20000 25000 30000 35000 40000 45000 1950 1953 1956 1959 1962 1965 1968 1971 1974 1977 1980 1983 1986 1989 1992 1995 X M
Tables
Table 1. The ADF test for unit roots
___________________________________________________________
T E S T S T A T I S T I C
CRITICAL VARIABLE levels 1st diff. 2nd diff. VALUE ______________________________________________________________________
X 5.07(2) -1.02(2) -4.70(5) -2.94
M 6.87(4) 1.23(4) -6.93(3) -2.94
___________________________________________________________
Notes: The reported critical values are obtained from MacKinnon (1991), andcorrespond to 45 number of observations at 5% significance level. The intercept term is included in the ADF equations. The time trend is not included since statistical insignificance. Numbers in parentheses show the order of augmentation sufficient to secure lack of autocorrelation of the error terms.
Table 2. The Perron test for unit roots with structural break: the AOM model
___________________________________________________________
T E S T S T A T I S T I C C R I T I C A L V A L U E VARIABLE levels 1st diff. %5 %10 ______________________________________________________________________ X -0.78(1) -3.24(0) -3.39[0.7] -3.05[0.7] M -0.02(1) -7.69(0) -3.39[0.7] -3.05[0.7] ______________________________________________________________________
Notes: We use the original critical values for 50 number of observations reported
by Perron (1990) and Perron and Vogelsang (1992). The corresponding break fractions are calculated as δ = Tb/T where Tb and T represent the number of observations until the break year (inclusive) and the whole sample size respectively. Numbers in parentheses in the test statistic columns show the order of augmentation sufficient to secure lack of autocorrelation of the error terms while numbers in parentheses in the critical value column show the corresponding calculated break fractions for each variable.
External Deficits Sustainability Table 3. The residual-based ADF test for cointegration
________________________________________________________________ Cointegrating
Equation Constant Slope R2 ADF
_____________________________________________________________________ X = f (M) 35.0 0.61 0.97 -2.40[3] (0.17) (36.1) M = f (X) 196.4 1.59 0.97 -2.73[3] (0.58) (36.1) ____________________________________________________________________
Notes: The critical value of the ADF statistic for 45 observations is -3.49 at 5%
significance level. This value is from MacKinnon (1991). Numbers in brackets show the order of augmentation sufficient to secure lack of autocorrelation of the error terms while numbers in parentheses are the corresponding t-statistics. It is important to note that all the estimated test statistics including the t-values have only a descriptive role since the variables in cointegrating regressions are nonstationary. High R2 in a cointegrating regression implies that long-run OLS estimators are not substantially biased (see Banerjee et al., 1993).
Table 4. The residual-based ADF test for cointegration including the dummy variable (DU) in the cointegrating equation
___________________________________________________________________ Cointegrating
Equation Constant Slope Dummy R2 ADF ____________________________________________________________________ X = f (M, DU) -55.2 0.51 2645.0 0.98 -2.57[3] (-0.33) (22.4) (5.41) M = f (X, DU) 258.0 1.82 -3378.9 0.97 -2.91[3] (0.82) (22.4) (-3.13) ____________________________________________________________________
Notes: The critical value of the ADF statistic for 45 observations when there are
three variables in the cointegrating equations is -3.95 at 5% significance level. This value is from MacKinnon (1991). Numbers in brackets show the order of augmentation sufficient to secure lack of autocorrelation of the error terms while numbers in parentheses are the corresponding t-statistics.
ÖZET
Bu çalışma Türkiye’nin dış ticaret dengesizliklerinin uzun dönemli yapısını ele almaktadır. Özellikle doksanlı yıllarda dış açıkların ulaştığı boyut kamuoyonu, akademik ve politik çevreleri kaygılandırmaktadır. Çalışma, bu alandaki ekonometrik gelişmeleri dikkate almakta ve sözkonusu dış açıkların uzun dönemde sürdürülebilirliğini “Koentegrasyon analizi” çerçevesinde incelemektedir.
REFERENCES
BAHMANI-OSKOOEE, M. and DOMAC, I. (1995), “The Long-Run Relation between Imports and Exports in an LDC: Evidence from Turkey”,
METU Studies in Development, 22 (2), 177-89.
BAHMANI-OSKOOEE, M. (1994), “Are Imports and Exports of Australia Cointegrated?”, Journal of Economic Integration, 9, 525-33.
BANERJEE, A., DOLADO, J., GALBRAITH, J.W. and HENDRY, D.F. (1993), Cointegration, Error-Correction and the Econometric Analysis
of Non stationary Data, Oxford University Press, Oxford.
BEAN, C.R. (1991), “The External Constraint in the U.K.”, in: Algoskoufis, G., Papademos, L. and Portes, R., eds., External Constraints on
Macroeconomic Policy: The European Experience, Cambridge
University Press, Cambridge.
BUITER, W.H. and PATEL, U.R. (1992), “Debt, Deficits, and Inflation: An Application to the Public Finances of India”, Journal of Public
Economics, 47, 171-205.
CHAREMZA, W.W. and DEADMAN, D.F. (1992), New Directions in
Econometric Practice, Edward Elgar, UK.
CHRISTIANO, L.J. (1992), ‘Searching for Breaks in GNP’, Journal of
Business and Economic Statistics, 10, 237-50.
CORSETTI, G. and ROUBINI, N. (1991), “Fiscal Deficits, Public Debt and Government Solvency: Evidence from OECD Countries”, Journal of the
Japanese and International Economics, 5, 354-80.
DICKEY, D.A. and FULLER, W.A. (1979), ‘Distribution of the Estimators for Autoregressive Time Series with a Unit Root’, Journal of
External Deficits Sustainability
DICKEY, D.A. and FULLER, W.A. (1981), ‘Likelihood Ratio Statistics for Autoregressive Time Series with a Unit Root’, Econometrica, 49(4), 1057-73.
DOLADO, J.J. and VINALS, J. (1991), “Macroeconomic Policy, External Targets and Constraints: The Case of Spain”, in: Algoskoufis, G., Papademos, L. and Portes, R., eds., External Contraints on
Macroeconomic Policy: The European Experience, Cambridge
University Press, Cambridge.
ENGLE, R.F. and GRANGER, C.W.J. (1987) “Cointegration and Error Correction: Representation, Estimation and Testing”, Econometrica, 55, 251-76.
FULLER, W.A. (1976), Introduction to Statistical Time Series, J. Wiley & Sons, Inc., New York.
HAKKIO, C.S. and RUSH, M. (1991a), “Is the Budget Deficit ‘Too High’”,
Economic Inquiry, 29, 429-45.
HAKKIO, C.S. and RUSH, M. (1991b), “Cointegration: How Short Is the Long-Run?”, Journal of International Money and Finance, 10, 571-81.
HAMILTON, J.D. and FLAVIN, M.A. (1986), “On the Limitations of Government Borrowing: A Framework for Empirical Testing”, The
American Economic Review, 76 (4), 808-19.
HAUG, A.A. (1993), “Residual-based Tests for Cointegration: A Monte Carlo Study of Size Distortions”, Economics Letters, 41, 345-51.
HUSTED, S. (1992), “The Emerging U.S. Current Account Deficit in the 1980s: A Cointegration Analysis”, The Review of Economics and
Statistics, 74, 159-66.
IRELAND, J. and WREN-LEWIS, S.W. (1992), “Buffer Stock Money and the Company Sector”, Oxford Economic Papers, 44, 209-31.
LIU, P. and TANNER, E. (1995), “Intertemporal Solvency and Breaks in the U.S. Deficit Process: A Maximum-Likelihood Cointegration Approach”,
Applied Economics Letters, 2, 231-5.
MACKINNON, J.G. (1991), ‘Critical Values for Cointegration Tests’, in Engle, R.F. and Granger, C.W.J (eds.), Long-run Economic
OZATAY, F. (1994), “The Sustainability of Public Sector Deficits: The Case of Turkey”, The Central Bank of the Republic of Turkey, Research
Department, Discussion Papers, No.9402, April, Ankara.
PERRON, P. (1989), ‘The Great Crash, the Oil Price Shock and the Unit Root Hypothesis’, Econometrica, 57, 1361-1401.
PERRON, P. (1990), ‘Testing for a Unit Root in a Time Series with a Changing Mean’, Journal of Business and Economic Statistics, 8, 153-162.
PERRON, P. and VOGELSANG, T.J. (1992), ‘Testing for a Unit Root with a Changing Mean: Corrections and Extensions’, Journal of Business and
Economic Statistics, 10, 467-70.
PERRON, P. (1994), ‘Trend, Unit Root and Structural Change in Macroeconomic Time Series, in Cointegration for the Applied
Economist, B.B. Rao (ed.), The Macmillan, UK, 113-46.
SAWADA, Y. (1994), “Are the Heavily Indebted Countries Solvent?: Tests of Intertemporal Borrowing Constraints”, Journal of Development
Economics, 45, 325-37.
TANNER, E. (1995), “Intertemporal Solvency and Indexed Debt: Evidence from Brazil, 1976-1991”, Journal of International Money and Finance, 14 (4), 549-73.
TANNER, E. and LIU, P. (1994), “Is the Budget Deficit ‘Too Large’: Some Further Evidence”, Economic Inquiry, 32, 511-8.
TREHAN, B. and WALSH, C.E. (1988), “Common Trends, The Government’s Budget Constraint and Revenue Smoothing”, Journal of
Economic Dynamics and Control, 12, 425-44.
TREHAN, B. and WALSH, C.E. (1991), “Testing Intertemporal Budget Constraints: Theory and Applications to U.S. Federal Budget and Current Account Deficits, Journal of Money, Credit, and Banking, 23 (2), 206-23.
UTKULU, U. (1997), “Testing for Unit Roots with Structural Change: An Application of the Perron Additive Outlier Test to the Turkish Macroeconomic Time-Series Data”, DEU IIBF Dergisi, 12 (1), 231-8.
External Deficits Sustainability
WICKENS, M.R. and UCTUM, M. (1993), “The Sustainability of Current Account Deficits: A Test of the U.S. Intertemporal Budget Constraint”,
Journal of Economic Dynamics and Control, 17, 423-41.
WILCOX, D.W. (1989), “The Sustainability of Government Deficits: Implications of Present-Value Borrowing Constraint”, Journal of
Money, Credit, and Banking, 21 (3), 291-306.