1
Economic policy uncertainty and tourism: Evidence from
heterogeneous panel.
Seyi Saint Akadiri
College of Business, Westcliff University, Irvine, California, United States. Correspondent Author
:
[email protected]Andrew Adewale Alola
Faculty of Economics, Administrative and Administrative and Social Sciences, Istanbul Gelisim University, Istanbul, Turkey.
Email: [email protected]
Gizem Uzuner
1*
Faculty of Business and Economics, Department of Economics, Famagusta, Eastern Mediterranean University, North Cyprus, via Mersin 10, Turkey.
Email: [email protected]
1
Faculty of Business and Economics, Department of Economics, Famagusta, Eastern Mediterranean University, North Cyprus, via Mersin 10, Turkey.
*Corresponding: [email protected]
2
Abstract:
In this paper, we examine whether tourism predicts economic policy uncertainty or not in three regions of America, Europe, and Asia-pacific, using annual frequency panel data that consist of 12 countries in a multivariate Granger causality model that incorporates economic growth as an additional variable over the periods 1995-2016. Using panel Granger causality method as advanced by Emirmahmutoglu and Kose (2011) that produces country-specific Granger causality test statistic and also controlled for heterogeneity in panel data, we found two-way causality relationship between ITAs and EPU in France, Ireland and United State, and one-way causality relationship from ITAs to EPU in Brazil, Canada, China and Germany and neutrality hypothesis in Chile, Japan, South Korea, Russia and Sweden respectively. These results suggest tourism-economic policy uncertainty led-hypothesis and tourism-economic policy uncertainty-tourism led hypothesis with worthy policy implications for tourism destinations across the world.
Keywords:
Economic Policy Uncertainty; Tourism Arrival; Economic Growth; Panel Approach.3
1. Introduction
Tourism as a product is mainly a category of international trade in services. Globally, international tourists’ arrivals reportedly increased from 25 million in 1950 to 1.235 billion in 2016, thus generating US$ 1.4 trillion in revenue as a total value of tourism exports in 2016 (UNWTO, 2017). The sector’s global performance and contributions to the Gross Domestic Product (GDP), employment, investment have been put at US$ 8.2723 trillion (10.4% of total GDP), 313,221,000 jobs (9.9% of total employment), and US$ 882.4 billion (4.5% of total investment) in 2017 respectively (World Travel and Tourism Council, WTTC, 2018). Additionally, the prospect of the tourism sector globally presents interesting outlook with the UNWTO reporting a forecast of 1.8 billion international tourist arrivals by 2030.
However, the forecasted boom in the tourism sector is expectedly hinged on the economic policies especially of the tourist destinations and some other factors such as the regional political stability, social and environmental factors. For instance, the growth in international tourist arrivals (ITAs) worldwide was hampered by the global financial crisis (GFC) in 2008-2009 (Central Bureau voor de Statistiek, 2018). Hence, the uncertainty in the economic policy (EP) which is measured by the Economic Policy Uncertainty index (EPU)2 is expected to negatively impact tourism growth vis-a-vis ITAs. Conversely, the impact of the inflow of ITAs on the direction of the EP could not be unnoticed. Ordinarily, the impact of tourism growth, resulting in the revenue increase could mean so much for the destinations’ fiscal policies, thus causing uncertainty in EP. For instance, because Europe is the world’s primary tourism destination and generates 10% of European Union (EU) GDP, the increased frequency of holiday has subsequently triggered environmental and socio-economic policies (European Environment Agency, 2016). Indicatively, the rapid growth in tourism is a potential for overcrowding in major cities and attraction centers, thus resulting in over tourism in a destination like Japan. Specifically, in Japan appropriate economic policies is been considered by the country to address the concern of overcrowding in recent years (Telegraph, 2018).
2 The Policy Uncertainty index (EPU) which was developed from the newspaper coverage of events (such as war,
terrorist attacks, financial crisis, fiscal policy, etc.) (Baker et al., 2016). Further information on Economic can read from http://www.policyuncertainty.com/.
4 Importantly, the impact of tourism on the economic growth (EG) which is mostly through the ITAs is reportedly positive. Indicatively, indicator of growth (such as direct or indirect employment, investment, infrastructure development etc.) as mentioned earlier are uncontestably driven by the inflow of tourist arrivals in a destination. But, economic expansion is equally perceived to trigger a surge in ITAs in destinations. In Japan for example, in addition to the fascinating land of ancient temples that are prominent attraction sites, neon skyscrapers, snow-capped mountains and sandy beaches, and other state-of-art infrastructural edifices have become hotspot for international tourists (The Telegraph, 2018).
Furthermore, studies have demonstrated the link between tourism and economic growth and in most cases the affirmation of the tourism-led growth hypothesis (Akadiri, Akadiri & Alola, 2017; Akadiri et al., 2018; Alola & Alola, 2018a, b; Fahimi et al, 2018, Roudi Arasli & Akadiri, 2018). Specifically, Fahimi et al, 2018 and Roudi Arasli & Akadiri, 2018 are recent studies that investigates the impact of tourism on economic growth in micro states and small island developing countries.
Nevertheless, the extant literature is in short of contextual discussion and empirical evidence of the link between uncertainty in economic policy and tourism. Hence, this study is designed to establish the causal relationship between ITAs, EPU, and RGDP. In doing this, the study strictly considered twelve countries as mentioned in section 2 due the availability of EPU index. The motivation of this study is expected to add novelty to extant literature because (i) it establishes the causal relationship between EPU and tourism and (ii) a novel Granger causality methodology of Emirmahmutoglu and Kose (2011) that controlled for heterogeneity and produces country specific estimators in panel analysis has been employed to achieve research objectives.
The other sections of the study are structured as follows. Section 2 highlights data description and the empirical methodologies. The empirical findings and implications for policy are reported in Section 3. Lastly, the concluding remarks are provided in Section 4.
2. Data and Methodology
5 To examine the direction of causal nexus among EPU, tourism arrival3 and economic growth, we construct a panel data series for three regions Americas, Europe, and Asia-pacific, made up of 12 countries, such as Brazil, Canada, Chile, US, China, Japan, South Korea, France, Germany, Ireland, Russia, Sweden, with annual frequency data between the periods 1995-2015. The EPU index was sourced from the newspaper coverage of events such as war, terrorist attacks, financial crisis, fiscal policy, fluctuation in exchange rate as introduced by Baker et al., (2016). Further information on Economic can read from http://www.policyuncertainty.com/. While ITAs and real GDP per capita data are obtained from the World Development Indicators (WDI). The panel series are in all in their logarithmic forms.
Methodology
Our empirical analysis proceeds as follows; (i), we test for cross-sectional dependence and slope heterogeneity in the data series to determine the suitable unit root test and estimator. (ii), we evaluate the integrated properties of the panel data. (iii), we estimate Eq. (1) and (2), and conduct the bootstrap Granger causality test of Emirmahmutoglu and Kose (2011).
<<<Insert Table 1>>> <<<Insert Table 2>>>
2.1.1 Emirmahmutoglu and Kose (2011) causality approach
This study applied the Emirmahmutoglu and Kose panel Granger causality test proposed by Emirmahmutoglu and Kose (2011) to examine the directional causality between the selected variables. The choice of this panel causality approach as opposed to other available causality tests is because; first, Emirmahmutoglu and Kose (2011) causality approach does not require the variables in the underlying VAR system to be stationary and may thus be applied to panels made up of stationary, non-stationary, cointegrated and non-cointegrated series (Seyoum and Lin, 2014), second, the causality approach permit us to avoid the pre-test bias related with testing for stationarity and cointegration, and lastly, we can obtain causality estimates that are robust to cross-sectional dependence (CSD) using bootstrapping method.
3
In order to control for multicollinearity, we employed international tourist arrivals to proxy for tourism rather than tourism receipts, which might be correlated with real gross domestic product.
6 Emirmahmutoglu and Kose (2011) employed the level VAR model with ki+dmaxi in heterogenous mixed panel:
∑ ∑ (1)
∑ ∑ (2) where the sub-index i and t represent individual cross-sectional units and time period, respectively. The lag structure is represented by while refers to the maximal order of integration. In this study, , i= 1,2, …N denotes to ITA, , i= 1,2, …N stands for EPU and RGDP. Three possible Granger causality relations can be found for individual country; (i) unidirectional Granger causality running from y (ITA) to x (EPU and/or RGDP) if all are zero, but not all are zero, (ii) unidirectional Granger causality running from x (EPU and/or RGDP) to y (ITA) if all are zero, but not all are zero, (iii) bidirectional Granger causality relation between y and x when some of the and are non-zero.4
3. Results
In this section we report the results and embark on empirical discussion. In order to achieve study objectives, we first controlled for the existence of CSD in the panel series for all the countries with 4 different tests, such as Pesaran et al. (2008) bias adjusted LM test, Pesaran (2004) CSD test, Pesaran (2004) Scaled LM test, and the Breusch-Pagan (1980) LM test. Second, we control for slope heterogeneity in the panel series via Pesaran and Yamagata (2008) standardized version of the Swamy (1970) known as delta tests (homogeneity test). Table 1 report the CSD test results. Results show that the null hypotheses of no CSD are rejected at a (p < 0.01) significance level for the variables under observation. In addition, the null of slope homogeneity is also rejected at a (p < 0.01) significance level for the panel data series. Third, we evaluated the integrated properties of the panel data series for the sampled countries via Im, Pesaran and Shin (2003) panel unit root test. Table 2A reports the IPS panel unit root test results at level and first difference. According to the Table 2A, all variables are stationary at their first difference, i.e. I(1).
4
7 Furthermore, we carried out Westerlund and Edgerton (2007) cointegration test that account for CSD and heterogeneity in panel data to examine the existence of a long-term equilibrium cointegration relationships among the panel series. Results reported in Table 2B show that the variables have a stable long-run cointegration relationship among individual countries and the panel countries as a whole at (p > 0.01) and (p > 0.05) significance level respectively.
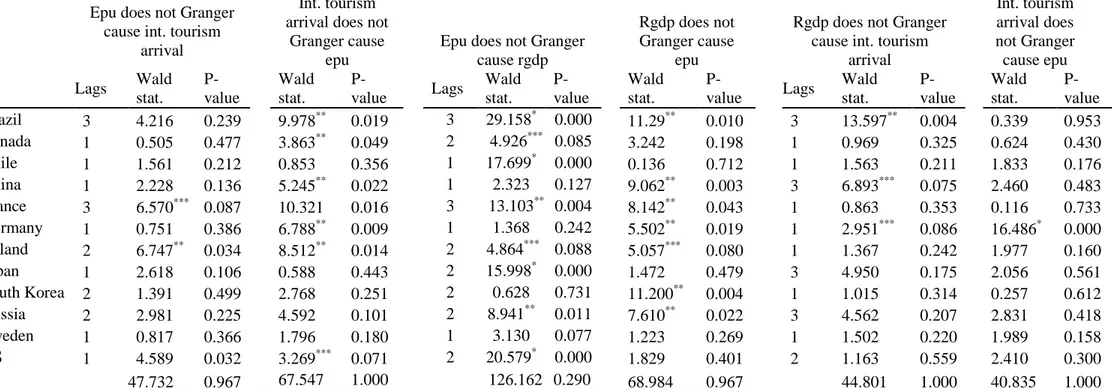
8 In addition, we examined the hypothesis that there is a causal relationship among ITAs, EPU and RGDP per capita via the LA-VAR technique of Emirmahmutoglu and Kose (2011). Results as reported in Table 3 provide evidence against the null of non-causality from EPU to ITA and vice versa. Results shows a two-ways causality between EPU and ITAs in France, Ireland and United States at (p < 0.01), (p < 0.05) and (p < 0.10) significance level respectively. This is consistent with the work of Gozgor and Ongan (2017) for US and Demir and Ersan (2018) for panel of countries. We found a one-way causality relationship from ITAs to EPU in Brazil, Canada, China and Germany at (p < 0.05) and (p < 0.01) significance level. While we found neutrality hypothesis between ITAs and EPU in Chile, Japan, South Korea, Russia and Sweden respectively. ITAs was found to predict variations in EPU in 7 countries out of the 12 sampled countries. Thus, policymakers in economic policy decision making must incorporate tourism control for a sustained long-term economic and/or political stability in the sampled region and/or any other tourist destinations of the world.
Results reported in Table 2 provide evidence against the null of non-causality from EPU to RGDP per capita and vice versa. Results shows a two-ways causality between EPU and RGDP per capita in Brazil, France, Ireland and Russia at (p < 0.01), (p < 0.05) and (p < 0.10) significance level respectively. We also found a one-way causality relationship from EPU to RGDP per capita in Canada, Chile, Japan, Sweden and United States at (p < 0.01) and (p < 0.10) significance level, while from RGDP per capita to EPU in China, Germany and South Korea at (p < 0.05) and (p < 0.01) significance level. These results indicate that, EPU have predictive power over real GDP per capita, and vice versa. That is, increase or decrease in the level of economic policy uncertainty influences decrease/increase in economic growth, and vice versa. These results resonate with the findings of Arouri and Rouband (2016) and, Liu and Zhang (2015).
Furthermore, results as reported in Table 2 also provide evidence against the null of non-causality from ITA to RGDP per capita and vice versa. Results shows two-ways non-causality between ITAs to and RGDP per capita only in Germany at (p < 0.01) and (p < 0.10) significance level. We found a one-way causality nexus from RGDP per capita to ITAs in Brazil and China at (p < 0.01) and (p < 0.10) significance level, while we found neutrality hypothesis between RGDP per capita and ITAs in Chile, Canada, France, Ireland, Japan, South Korea, Russia,
9 Sweden and United States respectively. Results indicates that ITAs have predict power over RGDP per capita and vice versa. These results are consistent with the findings of Akadiri et al (2017; 2018) for small island developing states.
<<<Insert Table 4>>>
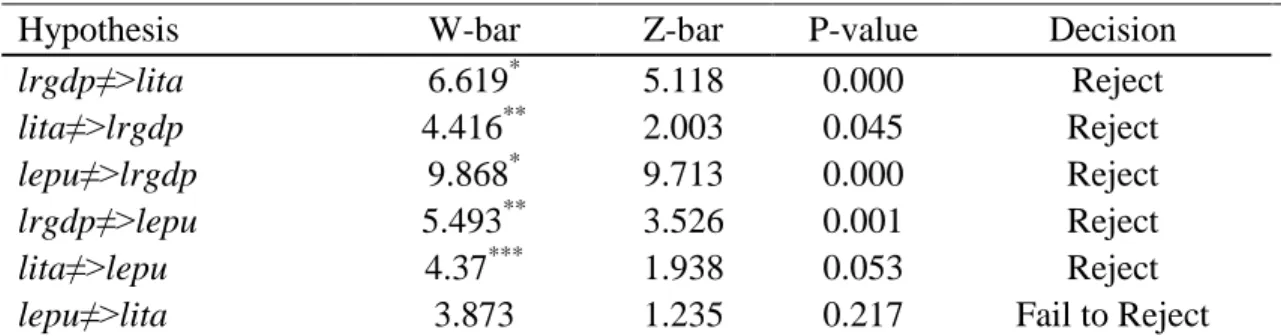
Conclusively, we carried out sensitivity check on the robustness of the direction of causality results via panel non-Granger causality test in heterogeneous test advanced by Dumitrescu and Hurlin (2012). Results as reported in Table 4 shows a feedback impact, that is, two-ways causal nexus between real GDP per capita and tourist arrivals, and between economic policy uncertainty, while we found one-way causality from tourist arrivals to economic policy uncertainty. The Dumitrescu and Hurlin (2012) panel non-Granger causality tests imply that international tourist’s arrivals cause economic policy uncertainty. That is, international tourist arrivals is a useful predictor of economic policy uncertainties in the sampled countries.
4. Conclusion
In this paper, we examine whether international tourist arrivals have a predictive power over economic policy uncertainty in heterogeneous panel of 12 countries. The empirical results of this study is indicative with credible policy implications. We find that international tourist arrivals is linked with economic policy uncertainty in 7 countries (about 58% of the sampled countries employed in the study) which covers the three regions of Americas, Europe, and Asia-pacific, indicating that increased in level of international tourists arrivals or exposure of these countries to the world through tourism activities and/or development may not help them in curbing or reducing economic policy uncertainties in the economic growth process. From a policy standpoint, we suggest that these regions need to be put into consideration the increase impact of international tourism arrivals on economic policy uncertainties and hence, economic growth process of these nations and other tourist destination of the world. Otherwise, these regions and/or other tourist destinations might have to face or deal with increased long-term economic policy uncertainties that might low down economic growth process due to increased international tourist arrivals.
10 Akadiri, S. S., Akadiri, A. C., & Alola, U. V. (2017). Is there growth impact of tourism?
Evidence from selected small island states. Current Issues in Tourism, 1-19.
Akadiri, S. S., Lasisi, T. T., Uzuner, G., & Akadiri, A. C. (2018). Examining the causal impacts of tourism, globalization, economic growth and carbon emissions in tourism island territories: bootstrap panel Granger causality analysis. Current Issues in Tourism, 1-15. Alola, A. A., & Alola, U. V. (2018a). The Dynamics of Tourism—Refugeeism on House Prices
in Cyprus and Malta. Journal of International Migration and Integration, 1-16.
Alola, A. A., & Alola, U. V. (2018b). Agricultural land usage and tourism impact on renewable energy consumption among Coastline Mediterranean Countries. Energy & Environment, 0958305X18779577.
Arouri, M., & Roubaud, D. (2016). On the determinants of stock market dynamics in emerging countries: the role of economic policy uncertainty in China and India. Economics
Bulletin, 36(2), 760-770.
Baker, S. R., Bloom, N., & Davis, S. J. (2016). Measuring economic policy uncertainty. The
Quarterly Journal of Economics, 131(4), 1593-1636.
Breusch, T. S. & Pagan, A. R. (1980). The Lagrange multiplier test and its applications to model specification in econometrics. The Review of Economic Studies, 47(1), 239-253.
Centraal Bureau voor de Statistiek (2018). National and International Tourism Booming. https://www.cbs.nl/en-gb/news/2017/47/national-and-international-tourism-booming. Demir, E., & Ersan, O. (2018). The impact of economic policy uncertainty on stock returns of
Turkish tourism companies. Current Issues in Tourism, 21(8), 847-855.
Emirmahmutoglu, F., & Kose, N. (2011). Testing for Granger causality in heterogeneous mixed panels. Economic Modelling, 28(3), 870-876.
European Environment Agency (2016). Tourism. https://www.eea.europa.eu/soer-2015/europe/tourism.
11 Fahimi, A., Saint Akadiri, S., Seraj, M., & Akadiri, A. C. (2018). Testing the role of tourism and human capital development in economic growth. A panel causality study of micro states. Tourism management perspectives, 28, 62-70.
Gozgor, G., & Ongan, S. (2017). Economic policy uncertainty and tourism demand: Empirical evidence from the USA. International Journal of Tourism Research, 19(1), 99-106. Im, K. S., Pesaran, M. H., & Shin, Y. (2003). Testing for unit roots in heterogeneous panels.
Journal of econometrics, 115(1), 53-74.
Liu, L., & Zhang, T. (2015). Economic policy uncertainty and stock market volatility. Finance
Research Letters, 15, 99-105.
Pesaran, M. H. (2004). General diagnostic tests for cross section dependence in panels.Cambridge Working Papers in Economics No. 435, University of Cambridge, and CESifo Working Paper Series No. 1229.
Pesaran, M. H., & Yamagata, T. (2008). Testing slope homogeneity in large panels. Journal of
Econometrics, 142(1), 50-93.
Pesaran, M. H., Ullah, A., & Yamagata, T. (2008). A bias‐ adjusted LM test of error cross‐ section independence. The Econometrics Journal, 11(1), 105-127.
Roudi, S., Arasli, H., & Akadiri, S. S. (2018). New insights into an old issue–examining the influence of tourism on economic growth: evidence from selected small island developing states. Current Issues in Tourism, 1-21.
Seyoum, M., Wu, R. and Lin, J. (2014). Foreign direct investment and trade openness in Sub‐ Saharan economies: A panel data granger causality analysis. South African journal of economics, 82(3), 402-421.
Swamy, P. A. (1970). Efficient inference in a random coefficient regression model. Econometrica: Journal of the Econometric Society, 311-323.
Telegraph (2018). How the world’s fastest growing travel destination is becoming the next
12 https://www.telegraph.co.uk/travel/destinations/asia/japan/articles/japan-fastest-growing-travel-destination/.
United Nation World Tourism Organization (UNWTO, 2017). Tourism Highlights 2017 Edition. Westerlund, J., & Edgerton, D. L. (2007). A panel bootstrap cointegration test. Economics
13
Tables: Table 1.
Cross-sectional dependence and homogeneity test results
CSD Tests. Statistic(p-value) lnita lnepu lnrgdp LM (Breusch,Pagan 1980) 90.200** 104.539* 152.213* (0.026) (0.002) (0.000) CDlm (Pesaran 2004) 2.106** 3.354* 7.504* (0.018) (0.000) (0.000) CD (Pesaran 2004) -2.123** -2.706** -1.186** (0.017) (0.003) (0.018) LMadj (PUY, 2008) 22.391* 2.758** 23.291* (0.000) (0.003) (0.000) Slope homogeneity tests.
19.494* 2.243** (0.000) (0.012) 20.977* (0.000) 2.414** (0.008)
14
Table 2.
a) Panel unit root test results b) Cointegration Test
Method IPS Tests Statistic(p-value)
Variables lnita 1.274 g_tau -2.736 (0.899) (0.694) ∆lnita -2.343** g_alpha 1.371 (0.010) (0.938) lnepu -0.378 p_tau -1.984 (0.352) (0.544) ∆lnepu -5.706* g_alpha -1.984 (0.000) (0.648) lnrgdp -0.472 (0.318) ∆lnrgdp -3.935* (0.000)
15
Table 3. Emirmahmutoglu and Kose (2011) Granger causality test
Epu does not Granger cause int. tourism
arrival
Int. tourism arrival does not
Granger cause epu
Epu does not Granger cause rgdp
Rgdp does not Granger cause
epu
Rgdp does not Granger cause int. tourism
arrival Int. tourism arrival does not Granger cause epu Lags Wald stat. P-value Wald stat. P-value Lags Wald stat. P-value Wald stat. P-value Lags Wald stat. P-value Wald stat. P-value Brazil 3 4.216 0.239 9.978** 0.019 3 29.158* 0.000 11.29** 0.010 3 13.597** 0.004 0.339 0.953 Canada 1 0.505 0.477 3.863** 0.049 2 4.926*** 0.085 3.242 0.198 1 0.969 0.325 0.624 0.430 Chile 1 1.561 0.212 0.853 0.356 1 17.699* 0.000 0.136 0.712 1 1.563 0.211 1.833 0.176 China 1 2.228 0.136 5.245** 0.022 1 2.323 0.127 9.062** 0.003 3 6.893*** 0.075 2.460 0.483 France 3 6.570*** 0.087 10.321 0.016 3 13.103** 0.004 8.142** 0.043 1 0.863 0.353 0.116 0.733 Germany 1 0.751 0.386 6.788** 0.009 1 1.368 0.242 5.502** 0.019 1 2.951*** 0.086 16.486* 0.000 Ireland 2 6.747** 0.034 8.512** 0.014 2 4.864*** 0.088 5.057*** 0.080 1 1.367 0.242 1.977 0.160 Japan 1 2.618 0.106 0.588 0.443 2 15.998* 0.000 1.472 0.479 3 4.950 0.175 2.056 0.561 South Korea 2 1.391 0.499 2.768 0.251 2 0.628 0.731 11.200** 0.004 1 1.015 0.314 0.257 0.612 Russia 2 2.981 0.225 4.592 0.101 2 8.941** 0.011 7.610** 0.022 3 4.562 0.207 2.831 0.418 Sweden 1 0.817 0.366 1.796 0.180 1 3.130 0.077 1.223 0.269 1 1.502 0.220 1.989 0.158 US 1 4.589 0.032 3.269*** 0.071 2 20.579* 0.000 1.829 0.401 2 1.163 0.559 2.410 0.300 Λ 47.732 0.967 67.547 1.000 126.162 0.290 68.984 0.967 44.801 1.000 40.835 1.000 Notes: (1) *** represents significance at 0.10, ** denotes significance at 0.05 and * represents significance at 0.01.
(2) Lag orders are selected by using the Akaike information criteria (AIC). (3) Λ represents the fisher test statistic.
16
Table 4: Dumitrescu and Hurlin (2012) dynamic causality test
Hypothesis W-bar Z-bar P-value Decision
lrgdp≠>lita 6.619* 5.118 0.000 Reject
lita≠>lrgdp 4.416** 2.003 0.045 Reject
lepu≠>lrgdp 9.868* 9.713 0.000 Reject
lrgdp≠>lepu 5.493** 3.526 0.001 Reject
lita≠>lepu 4.37*** 1.938 0.053 Reject
lepu≠>lita 3.873 1.235 0.217 Fail to Reject
Note: ‘’ ≠> ‘’ denotes the lack of Granger causality between selected variables. *, **, *** denote significance at the 1,5 and 10 percent levels, respectively.