BUSINESS CYCLE SYNCHRONIZATION IN EUROPEAN ECONOMIC
AND MONETARY UNION (EMU): TESTING THE OCA DURING
FINANCIAL CRISIS
*Prof. Dr. Emin Ertürk Dr. Derya Yılmaz Dr. Işın Çetin
Uludağ Üniversitesi Uludağ Üniversitesi Uludağ Üniversitesi
İİBF İİBF İİBF
ORCID: 0000-0003-2469-4417 ORCID: 0000-0002-2478-2305 ORCID: 0000-0002-9788-8979
● ● ●
Abstract
Business cycle synchronization is of vital importance in the functioning of monetary union. A single monetary authority pursuing a “one size fits all monetary policy” would not be able to address problems such as inflation or unemployment of members which have divergent business cycles. Therefore, business cycle synchronization is regarded as a meta criterion for the optimum currency area theory. Several studies in literature have tested the business cycle synchronization and have particularly focused on Economic and Monetary Union (EMU). Most studies have used correlation of the cycles as a synchronization measure. In this study, the business cycle synchronization in EMU12 countries from 1980 to 2014 was tested and the mean of the bilateral correlation coefficients of the cycles was used as a synchronization measure as recommended by Massmann and Mitchell (2003). However, differing from previous studies, the current study tested the business cycle synchronization during the financial crisis. Three important findings emerged as a result. First, synchronization increases with monetary integration as argued by Frankel and Rose (1998). Second, the correlations of the cycles rise with the financial crisis. Third, business cycle synchronization drops in the aftermath of financial crisis due to the different recovery paths of respective countries.
Keywords: Optimum Currency Area (OCA) Theory, Economic and Monetary Union (EMU),
Endogeneity of OCA, Business Cycle Synchronization, Bilateral Correlations
Avrupa Ekonomik ve Parasal Birliği’nde Konjonktür Senkronizasyonu: Optimum Para Sahası Teorisinin Kriz Döneminde Test Edilmesi
Öz
Konjoktürlerin senkronizasyonu para birlikleri için hayati öneme sahiptir. Tek bir para otoritesi, ortak para politikasını kullanarak para birliği üyelerinin farklı problemlerine- enflasyon, işsizlik gibi- çözüm sağlayamaz. Bu nedenle üye olacak ülkelerin konjonktürlerinin senkronizasyonu optimum para sahası teorisinde meta kriter olarak adlandırılmaktadır. Avrupa Ekonomik ve Parasal Birliği (EPB) kapsamında ülkelerin konjonktürlerinin ne kadar senkronize olduğu birçok çalışmada test edilmiştir. Bu çalışmaların çoğunda da konjonktürlerin birlikte dalgalanmasını ölçmek adına korelasyon katsayıları kullanılmıştır. Bu çalışmada 12 EPB ülkesinin 1980-2014 arasında konjonktürleri incelenmiş ve senkronizasyon ölçütü olarak da Massman ve Mitchell (2003)’i takiben çift taraflı korelasyonlar kullanılmıştır. Kendinden önceki çalışmalardan farklı olarak bu çalışma kriz dönemlerini de içermekte ve kriz dönemindeki senkronizasyonu da ortaya koymaktadır. Yapılan analizler sonucu, üç önemli bulguya ulaşılmıştır. İlk olarak, parasal entegrasyon ilerledikçe Frankel ve Rose (1998)’un iddia ettiği gibi konjonktür senkronizasyonu artmaktadır. İkincisi, senkronizasyon finansal kriz dönemlerinde artmaktadır. Son olarak ise krizin hemen ardından konjonktürlerin senkronizasyonu azalmıştır. Bunun en önemli nedeni ise ülkelerin farklı hızla toparlanmasıdır.
Anahtar Sözcükler: Optimum Para Sahası (OPS) Teorisi, Ekonomik ve Parasal Birlik (EPB), OPS
Endojenliği, Konjonktür Senkronizasyonu, Çift Taraflı Korelasyon
* Makale geliş tarihi: 12.01.2016 Makale kabul tarihi: 11.07.2016
Business Cycle Synchronization in European
Economic and Monetary Union (EMU):
Testing the OCA During Financial Crisis
Introduction
Are the business cycles of EMU countries converged or diverged? This question has been asked at every stage of the European integration process, as similar business cycles are crucial for the conduct of a single monetary policy. A single monetary policy would not be able to address the problems of two countries in different phases of business cycles.
This argument is rooted in the optimum currency area (OCA) theory suggested by Mundell (1961). In his seminal paper, Mundell attempted to determine the geographical area in which economic efficiency would be maximized by using a single currency. A country would cede its monetary sovereignty after joining the monetary union. Mundell (1961) and his successors tried to put forth the criteria, by which countries should abide in order to overcome the cost of ceding their monetary policies. This theory became one of the most widely discussed theories of international monetary economics.
The theory was discussed profoundly in the 1960s, but as Tavlas (2009) famously stated, OCA theory was consigned to an intellectual limbo for the following 20 years. When the theory became an intellectual discussion, the symmetry of shocks and business cycle synchronization began to be analyzed rather than the determination of the criteria. The similarity of shocks became the “meta criterion”. Even if countries are faced with similar shocks and have similar business cycles, a common monetary policy would not pose a problem. In this framework, Frankel and Rose (1998) went further and came up with a new argument: endogeneity of optimum currency area criteria. The researchers suggested that even if the members of the monetary union do not have similar business cycles ex ante, they would have similar cycles ex post. This became a triggering argument for European integration despite the counter argument of Krugman (1993) with his specialization hypothesis. In this hypothesis, Krugman argued that as the countries integrate they became more specialized and encountered asymmetric shocks or had dissimilar cycles.
Bearing in mind these competing arguments, the aim of this study was to analyze the synchronization of the business cycles of 12 EMU countries. It was attempted to determine if the cycles are synchronized during the monetary integration process. If synchronized cycles were determined, the theory of Frankel and Rose (1998) would be verified, otherwise that of Krugman (1993). Moreover, differing from previous research, this study analyzed the synchronization with updated data which included the Global Financial Crisis (GFC) and the Sovereign Debt Crisis (SDC). Business cycle synchronization becomes more important during a financial crisis as a single monetary policy has to address the problems of member countries affected by the crisis. The size and magnitude of the monetary policy used during the crisis could cause disputes among members if they have de-synchronized business cycles. In order to test business cycle synchronization, the quarterly real GDP series of EMU countries starting from 1980 was used. As we were interested in “growth cycles”, we had to de-trend series, for which the Hodrick-Prescott (HP) filter was used. After obtaining the cyclical component of the series, in order to test synchronization, the mean values of bilateral correlation coefficients were used, following Massmann and Mitchell (2003). It was determined that the correlation of business cycles skyrocketed during the crisis period, which meant that when the shock hit the countries, they slumped together. However, in the aftermath of the crisis, the correlations scaled down sharply, which reflected the different recovery paths of the respective countries.
The data in this study were divided into 5 periods, reflecting the different levels of monetary integration and crisis. Then, the general means for these periods were calculated. It was observed that EMU countries converged after the Single Market and Euro, respectively. The correlations rose during crisis periods as explained above, but the general mean for the correlations in the GFC were higher than the value obtained from the SDC. This was due to the fact that the SDC hit particular countries, while the GFC hit all of them. In order to verify the study results, whether the average correlations changed statistically in these periods was evaluated with Wald tests. The tests revealed that the degree of synchronization differed statistically during these periods.
The paper is organized as follows: in section 1, a theoretical background is provided and the European monetary integration experience is monitored. Thus, the traditional and new versions of the OCA theory are explained and the endogeneity of OCA is clarified. Then, the monetary integration process in Europe is briefly addressed. Section 2 presents a review of selective literature. Section 3 is devoted to the empirical analysis. The methodological framework is described and the empirical results are presented. In the last section, concluding remarks are developed.
1. The Theoretical Background of OCA and European Monetary Integration
OCA theory is one of the most widely discussed theories in international economics. However, there is no consensus on the significance of the theory. Krugman (1993) defined the OCA theory as “the centerpiece of international monetary economics”, but Buiter (2000) described the theory as the “low point of post- World War II monetary economics”. Despite these discussions regarding the importance of the theory, it has developed together with the amendments in economic thinking. In this section, the theory is explained in respect of the developments in economics. Then, the European experience is summarized.
1.1. Traditional OCA Theory
OCA theory simply deals with the optimum geographic domain in which a common currency could be justified. The theory was formulated in the era of Bretton-Woods and under the hegemony of Keynes. Thus, the assumptions of the theory were affected by this paradigm. Nominal and real rigidities had prevailed, and the inflation and unemployment trade-off, which is reflected in the Phillips curve, was widely accepted. It was argued that the authorities could fine-tune the economy using monetary and fiscal policies.
In this framework, Mundell (1961) tried to determine in which conditions a country could prosper in achieving internal and external balance while using a common currency. Consider that countries A and B are members of the monetary union and initially in a full-employment and balance of payments equilibrium. Assuming a demand shift from the goods of B to the goods of A, a single monetary authority would not be able to deal with the problems of these two countries. An expansionary monetary policy could correct the unemployment problem of B but worsen the inflation problem of A, while a contractionary monetary policy would solve the inflation problem of A, but aggravate the unemployment problem of B. According to Mundell (1961: 664), factor mobility could solve this problem. The idle employees of B could move to A and relieve the inflation problem therein. Thus, the countries that have high factor mobility would benefit from participating in monetary union.1
1 Another question posed by Mundell (1961) was whether it was feasible to divide countries on the basis of factor mobility and make them use different currencies. He asserted that this was politically unfeasible and diminished the classical functions of money. He also quoted J.S. Mill, who associated using several currencies with barbarism.
McKinnon (1963: 723) argued that relatively open economies would benefit from permanently fixing the exchange rate and participating in a monetary union. He defined openness as the ratio of tradeables to non-tradeables. Open economies have a high ratio of tradeables to non-non-tradeables. In a relatively open economy, fluctuating exchange rates would be reflected in prices and prices would also fluctuate. This would tend to reduce the “liquidity functions of money”. Thus, open economies would benefit from participating in a monetary union as the exchange rate would be stabilized as a consequence of the monetary union.
According to Kenen (1969), countries with diversified production sectors are suitable for a monetary union, as a negative shock in one industry would be tolerated by a positive shock in another. Therefore, there would be no need for an independent monetary policy. In addition to this, Kenen (1969) identified another criterion, which was more pronounced after the SDC. He argued that when countries could form a fiscal transfer system, they would be insured against an adverse shock and would benefit from monetary union. A member country that faces an adverse shock would be able to get funds from other members and the effects of the shock would be relieved without using exchange rates or monetary policy.
After the triad suggested by OCA theorists, several researchers proposed further criteria. Ingram (1962) asserted financial integration, Fleming (1971) put forth similarity of inflation rates, Haberler (1970) and Tower and Willet (1975) propounded political integration criteria. However, determining the criteria, denoting countries suitable for monetary union was heavily criticized.2
In reaction to these criticisms, the cost- benefit approach emerged.
The benefits of using a single currency first arose as a result of using a currency which is widely accepted as a legal tender. The traditional functions of money are advanced as a result, with greater benefits as the monetary union expands. As Alesina and Barro (2000: 3) stated, “... money, like a language, is more useful the greater the number of persons who share the same type.”
2 The major criticisms were raised by Ishiyama (1975) and Tower and Willet (1994). First of all, these criteria may not always work in the same direction. One country might be open to trade but might have low factor mobility. In this case, is this country suitable for monetary union or not? This is regarded as the inconclusiveness of criteria approach. Second, McKinnon (1963) suggested that open economies were suitable for monetary union and he added that these open economies tend to be small at the same time. However, small economies are usually less diversified, which requires the use of flexible rates according to Kenen (1969). This is called the
inconsistency of the criteria approach. Finally, these criteria are dependent on each
The widely supported benefit of using a single currency is that it promotes trade within the union by eliminating transaction costs and exchange rate uncertainty. Rose (2000) argued that bilateral trade between two countries that use the same currency is more than 200% greater than between countries that use different currencies. After the assertive results of Rose, many researchers have studied the effects of monetary union on trade. However, the results are contradictory. Studies particular to the Euro have also shown conflicting results. Silva and Tenreyro (2010) and Berger and Nitch (2010) found no effect but Gil- Pajera et al. (2008) calculated a 70% increase in bilateral trade after the Euro Area membership.
Moreover, being a member of a monetary union means eliminating the instability arising from exchange rate and monetary policy (Gross and Thygesen, 1998: 225). Fleming (1971) also underlined this point and stated that the elimination of speculative attacks, which create a suitable environment for investment, is the major benefit of a monetary union. Finally, with membership of the monetary union, a country would save in foreign exchange reserves. Mundell (1973) also highlighted the pooling of reserves. When a country is hit by a negative shock, it would be able to use sources from this large pool of reserves.
On the other hand, membership of a monetary union has significant costs, the most reported of which is losing control of monetary policy. This means that the monetary authority would no longer be able to use the monetary policy as a stabilization tool as this would be delegated to the single monetary authority. However, the single monetary authority would not be able to solve the problems of particular countries as it would be designed along the lines of the majority. This cost has been debated since the seminal paper by Mundell (1961). Mundell and his successors tried to establish criteria to overcome this cost.
Furthermore, if a member or members of the monetary union run with high deficits and accumulate sizeable debts, this would lead to externality for other members. As the debt could be monetarized, this would put a strain on the interest rates of other member countries (Mongelli, 2002: 9). The fiscally stable countries would borrow at higher interest rates as a result. Finally, it is important to note that entering into a monetary union evokes important changeover costs in the form of legal, administrative and hardware (Mongelli, 2002:8).
A country should consider the costs and benefits before joining a monetary union. The benefits of being a member of the monetary union increase as the economic integration with the union becomes deeper and the costs decrease with integration. Thus, a country which has a high degree of
economic integration with the union probably would benefit more from the monetary union.3
1.2. “New” OCA Theory
The OCA theory was discussed intensively in the 1960s. After the demise of the Bretton-Woods system, flexible exchange rates dominated the international monetary system. Thus, OCA theory did not receive much intellectual attention. The theory resurfaced with the developments in European monetary integration. Emerson et al. (1992) prepared a report for the completion of the Single Market using new econometric techniques and academic thinking. The costs devoted to the OCA theory were demonstrated to be smaller than anticipated and the theory had further benefits. In this section, the resuscitated theory will be examined parallel to the academic developments in economics. As the assumptions of the traditional theory were ruined, it will be known as the “New OCA Theory” hereafter.
Traditional theory was based on a Keynesian stabilization framework, which assumes monetary illusion, price and wage rigidity, and a stable Phillips curve. However, from the beginning of the 1970s, Keynesianism started to lose ground and the Monetarist school began to gain support. Friedman (1968: 8) argued that unemployment has a natural rate that depends on the actual characteristics of labor and commodity markets. When authorities try to reduce unemployment beyond this rate, they only accelerate inflation. He also admitted that a negative-slope Phillips curve could only be valid in the short-term. In the long-term, unemployment would return to its natural rate. According to Monetarists, monetary policy is not an effective stabilization tool and should be devoted to ensuring price stability. From this new standpoint, since monetary policy is no longer an effective stabilization tool, the cost arising from abandoning monetary policy autonomy would also be modest.
Another argument which changed the view of OCA was time inconsistency, which was proposed by Kydland and Prescott (1977), and Barro and Gordon (1983). According to this argument, the optimum policy announced by authorities in time t, would not be optimal in t+1. Therefore, authorities could renege on their commitments. If economic agents expected authorities to renege on their commitments, they would form their expectations accordingly.
3 This cost-benefit approach has also been criticized as a quantitative assessment of costs and benefits is very difficult. This analysis also reflects the welfare analysis for one country. The global welfare may be different from national welfare due to externalities. See Kawai, 1992.
For example, if authorities announced that they intended to lower inflation and the economic agents believe this commitment, they would form their expectations based on a lower inflation rate. This is called credible policy. However, if the authority had previously reneged on its commitment, the economic agents would not believe in that and would form their expectations in consideration of a higher inflation rate. Alesina and Barro (2000) emphasized this point and stated that countries with high inflation experience are best suited for monetary union. By joining monetary union and devoting the monetary policy autonomy to a credible monetary authority, countries would import credibility. Fritianni and Von Hagen (1990) argued that, once the economies form a monetary union, they lose the chance of creating surprise inflation after wage contracts have been settled. This would enhance the credibility of the policy. Therefore, by delegating monetary policy to supranational authority, a high inflation country would benefit from joining a monetary union. With these new developments in economics, the costs dedicated to the monetary union began to be underestimated. This also triggered the monetary integration in Europe.
Parallel to this paradigm shift in economic thinking, there have been advances in econometric analysis. In this new era of research, the structure of the studies has also changed. The similarity of the shocks that the countries face became the meta criterion of the OCA. As Alesina et al. (2002) stated, the similarity of shocks, or business cycles, encompasses all properties of OCA criteria. When countries face similar shocks or similar business cycles, the need for policy independence reduces. A one size fits all monetary policy could solve the problems of all members. In short, the higher the similarity of business cycles, the lower the cost of abandoning monetary policy independence and joining a monetary union (see Bayoumi and Eichengreen (1996), Alesina et al.(2002) and Mongelli (2008)).
1.3. The Endogenity of OCA
Frankel and Rose (1997: 3) argue that “countries which join EMU, no matter what their motivation, may satisfy OCA criteria ex post even if not ex ante”. This hypothesis is called the endogeneity of OCA and depends on an increase in bilateral trade after joining a monetary union. A single currency is seen as a “much more serious and durable commitment”. Thus, monetary union would promote trade integration and rising trade would lead to a business cycle convergence (De Grauwe and Mongelli, 2005: 5). Even when the members do not have similar business cycles before joining a monetary union, they would converge afterwards and become suitable for monetary union. However, this analysis assumes intra-industry trade. By changing this assumption in the
specialization hypothesis, Krugman (1993: 242) reached the opposite conclusion that if the trade is inter-industry, rising trade would lead to specialization in the goods for which the country has a comparative advantage. Industry specific shocks would become country specific shocks in return, meaning that countries would probably face asymmetric shocks.
Kalemli-Özcan et al. (2003) supported Krugman in their study, which focused on financial integration. According to these authors, financially integrated countries would tend to face asymmetric shocks. If the capital markets of those countries are highly correlated, they would be insured against industry specific shocks. As a result, they would benefit from comparative advantages and specialize. In this case, they would face asymmetric shocks and single monetary policy would not be appropriate for these countries.
On the other hand, rather than focusing solely on trade, De Grauwe and Mongelli (2005) argued that one could consider several factors that cause similar business cycles after joining a monetary union. These include an increase in product and labor flexibility, financial integration, advancements in technology and knowledge sharing. The member countries would tend to have similar supply structures as a result of these endogeneities and would eventually have similar business cycles.
1.4. Monetary Integration of Europe
The economic integration of Europe began with political considerations. After the demise of Bretton-Woods, European countries tried to stabilize the exchange rates. In this framework, they formed the European Monetary System (EMS) in 1978 which was a flexible version of Bretton-Woods. The EMS was able to stabilize the exchange rates during the initial years. Countries converged nominally and followed the monetary policy of the Bundesbank. According to Giavazzi and Pagano (1998), members of the EMS borrowed on the credibility of the Bundesbank during this period.
In 1986, European countries signed the Single European Act which aimed to establish a single market by 1992. Delors was also assigned to prepare a report for transition to a monetary union. This report constituted a blueprint of the Maastricht treaty which envisaged the transition to monetary union. It was signed in 1992 and intended to finalize the Economic and Monetary Union (EMU) by 1999. However, countries had to converge before joining a monetary union. The convergence criteria, also known as the Maastricht criteria4, were
4 The Maastricht criteria consist of 5 important criteria. First, the candidate country shall have an inflation rate lower than the average inflation rates of 3 member states
determined in this framework. If countries could not fulfill these criteria, they could not become a member of the monetary union.
At the same time, capital controls were eliminated which is in line with the Single Market. Then the impossible trinity emerged: (1) free capital movements (2) fixed exchange rates (3) independent monetary policy. Speculative attacks began to address the EMS currencies as a result. Sterling Pound and Italian Lira left the exchange rate mechanism. After this crisis in 1992-93, EMS countries were encouraged to give up monetary independence and in 1999, 11 countries joined the EMU.5 The Euro became the legal tender
of these countries and the European Central Bank (ECB) became the monetary authority of the union.
In the 1990s, several studies researched whether EMS was an optimum currency area. The pessimistic view dominated the intellectual discussions in terms of the criteria approach. Despite this, the monetary integration of Europe had intensified. According to opponents of monetary union in Europe, the US did not constitute an optimum currency area when the monetary union was established (see Rockoff, 2000). They put forward the endogeneity of OCA hypothesis, which was that as the monetary union gets matured, the countries would converge and become suitable for the OCA. However, the EMU is an incomplete union. The US is a monetary union supported by fiscal union. The fiscal transfer system was important criteria proposed by Kenen (1969), but was undermined in the EMU. When the EMU was hit by GFC, the importance of this criterion became apparent. Countries reacted and bailed out the banking system using their own fiscal capacity. This deteriorated their fiscal surveillance and triggered the SDC. As Krugman (2012: 9) stated; “Kenen has turned out to dominate Mundell; lack of labor mobility has not played a major role in the Euro’s difficulties, but the lack of fiscal integration has had an enormous impact”.
which have lowest inflation rate plus 1.5 pp. Second, the candidate country shall have an interest rate no more than 2 pp higher than the average interest rates of 3 members that have the lowest inflation rates. Third, budget deficit/GDP ratio of the candidate country shall be lower than 3%. The gross government debt/GDP ratio shall be lower than 60%. Finally, the candidate country shall be in the exchange rate mechanism which means a stable exchange rate vis a vis union members.
5 These are: Austria, Belgium, Finland, France, Germany, Greece, Ireland, Italy, Luxemburg, Netherlands, Portugal and Spain. Greece could fulfill the criteria in 2001 and entered the union. The UK and Denmark had “opt-out” status and Sweden intentionally did not fulfill the exchange rate stability criteria.
The problems of GIPSI6 countries reflected the design failures of the
EMU. After the creation of the Euro, investors underestimated the risks inherent in peripheral countries and this led to capital inflows through these countries. In this capital abundant environment, these countries ran considerable current account deficits (Hall, 2012: 358). These capital inflows inflated the bubbles in the host country and became a large asymmetric shock. This was a kind of problem that the OCA created and the Euro became the mother of all asymmetric shocks (Krugman, 2012: 7).
2. Literature Review
Since the OCA was activated and focused on the similarity of shocks, the suitability of European nations for monetary union was tested via the business cycle synchronization. Several studies have been conducted on the subject matter since the beginning of the 1990s. Baouyumi and Eichengreen (1993) argued that the supply and demand shocks were becoming more correlated in the Europe. Similarly, Artis and Zhang (1997) calculated the linkages between business cycles before and after the ERM. They found that before the ERM, the business cycles of ERM countries were linked to the US cycle, but after the ERM, the business cycles of European countries converged into the German cycle. Inklaar and De Haan (2001) used Artis and Zhang (1997)’s dataset, but with different samples, and found no evidence of business cycle convergence after the monetary integration. In fact, Artis (2003) could not find any evidence of European business cycle with an updated dataset. Comacho et al. (2006) used the industrial production index as an indicator of economic activity and utilized MDS analysis. No evidence was found of improvement in synchronization after the Euro. Similarly, Baxter and Kouparitsas (2005) found no evidence of a currency union effect on business cycle convergence.
On the other hand, Rose and Engel (2002) argued that members of the monetary union have more synchronized business cycles due to rising trade and less exchange rate volatility. However, there is no consensus in the literature on low exchange rate volatility leading to a more synchronized business cycle. De Haan, Inklaar and Sleijpen (2002) concluded that business cycles were more correlated during high exchange rate volatility. Similarly Gerlach (1988) found that business cycles were more correlated in the flexible exchange rate period than in the Bretton-Woods era. Baxter and Stockman (1989) found no relationship between the correlations of business cycles and exchange rate regimes. In the same vein, Bergman (2004) examined the EMU countries’
business cycles between 1961 and 2004 and concluded that business cycles were more correlated during the period of flexible exchange rates. However, it was also found that in the fixed exchange rate period following the EMS, synchronization improved with the monetary integration.
Several studies have divided the sample into sub-samples in order to follow the changes in the synchronization. Angeloni and Dedola (1998) showed that the correlation of output between Germany and European countries increased in the transition period between 1993 and 1997. This was named the “Maastricht effect” by De Haan et al. (2008). Similarly Afonso and Squiera (2010) studied the level of business cycle synchronization between 1970 and 2009 and found that the correlation of business cycles increased in the period of interest and was higher after the introduction of the Euro. Papageorgiou et al. (2010) computed the pairwise correlation coefficients by dividing the data into sub-samples. The correlation was seen to increase between 1992 and 1999, which verified the Maastricht effect. However, in the 2000-2009 period, there was no evidence of increase in correlation coefficients. Deigonakkis et al. (2014) also concluded that business cycle convergence increased after the introduction of the Euro. In contrast, Giannoe, Lenza and Reichlin (2008) identified a heterogeneity indicator based on real GDP per capita, which is a proxy for idiosyncratic shocks. They reported that this indicator hardly changed after the introduction of the Euro. Furthermore, Crespo-Cuaresma and Amador (2013) and Lee (2013) identified a higher synchronization in the pre-EMU period. Masmann and Mitchell (2003) examined the monthly industrial production cycles. Instead of a continuous increase or decrease in convergence, they found that there were periods of divergence and convergence.
The effect of GFC on business cycle synchronization has not been studied in detail in the literature due to limitations of data. Gächter et al. (2012) examined the effects of the Global Financial Crisis on EMU countries’ business cycles and found that business cycles diverged after the financial crisis due to the different recovery paths of the respective countries. Gomez et al. (2012) also found a de-synchronization after the financial crisis. Deigionakkis et al. (2014) concluded that the variability of synchronization increases after a financial crisis and cycles became more desynchronized after 2007. However, Bekiros et al. (2014) reached a different conclusion that synchronization increases during crisis periods.
3. Empirical Analysis
The aim of this study was to test the synchronization of the business cycles of the 12 EMU countries7 from 1980 to 2014. Similar business cycles are
important for the sake of monetary policy in monetary union. As previously mentioned, business cycle synchronization is the meta criterion for the OCA theory. There is vast amount of literature regarding the synchronization of business cycles, but the distinctive feature of this study was the consideration of the effects of GFC and SDC, respectively. It is important because these crises lead to a change in the dynamics of business cycle synchronization and has important implications in the monetary union.
3.1. Methodological Framework
Business cycles were first introduced by Burns and Mitchell (1946). They defined business cycles as a sequence of upward and downward shifts in economic activity. In growth economies, these upward and downward shifts are rare, as expected. Therefore, Artis (2003: 3) classified the cycles into two categories. The first includes classical cycles as explained by Burns and Mitchell (1946) and the second includes growth cycles which simply reflect deviations from the trend. Deviations from trend could be regarded as an output gap, where trend simply reflects potential output. Output gap is fundamental for the optimality of the monetary union. If there is a positive output gap, inflationary pressures occur and if there is a negative output gap, deflationary pressures occur. If members have different types of output gaps, a single monetary authority would not be able to relieve these pressures (Gächter et al., 2012: 33).
Growth cycles were used in this study to test business cycle synchronization. Initially, we had to identify which business cycle we needed to use. The most common variables that have been used in similar studies were the Industrial Production (IP) index and real GDP. IP data are released monthly, although it only measures industry. The IP only explains 20% of the total output in the Euro Area (De Haan et al. (2008), Comacho et al. (2006)). Therefore, log levels of the quarterly real GDP series obtained from the OECD, were used.
7 These countries are Austria, Belgium, Finland, France, Germany, Greece, Ireland, Italy, Luxemburg, Netherlands, Portugal and Spain. We focused on these countries as they were the initial entrants and they become frequent subjects in related studies.
In order to extract growth cycles we had to de-trend these real GDP series. There are several de-trending techniques but the most straightforward one is to differentiate the series. However, this would cause a shift in peaks and troughs (De Haan et al., 2008:236), so the filtering technique was preferred as it is a common de-trending method. There are several filtering methods such as Hodrick –Presscott (HP) filter, Baxter-King (BK) band pass filter, Christiano and Fitzgerald band pass filter. Canova (1998) argued that different filtering techniques may lead to different conclusions. On the other hand, Masmann and Mitchell (2003) analyzed several countries’ business cycles using different filtering techniques and concluded that the interference on convergence was not related to the de-trending method used. The most widely used filtering techniques are the HP and BK filters. For this study, the HP filter was selected because BK discards a large amount of data as it uses three year moving averages.8
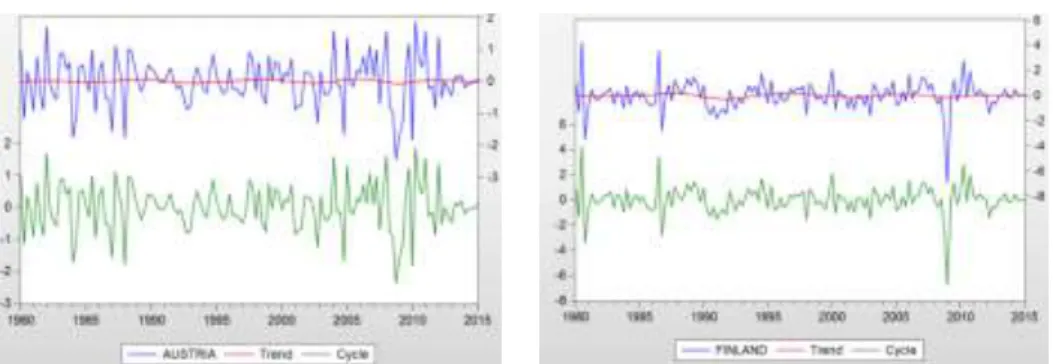
Figure 1 shows the cycle-trend graphs of 12 EMU countries obtained using HP filter. This and the following analyses were applied in E-views 8.0 software package. It can easily be seen from Figure 1 that the cycles of Belgium and France resemble each other. The Netherlands and Germany also have similar cyclical patterns. It can also be seen that the cyclical volatility of Spain, Portugal and Greece decreased after joining the EMS.9
Figure 1. Cycle-Trend Graphs
8 We also extracted cycles using Baxter and King band pass filter. The results were similar to those obtained with HP filter. Due to space considerations, we did not report the results, but these are available upon request.
Source: Own calculations based on the log level of real GDP obtained from OECD.
After obtaining the cyclical component, it was necessary to assess whether these cycles were synchronized or not. Several competing synchronization measures have been used in literature, but the most widely used is the calculation of the correlation coefficients of the cycles. Some studies, focused on the EMU, have calculated the correlation coefficients based on a particular country –i.e. Germany- or an aggregate –i.e. the EMU (Artis and Zhang (1997), Angeloni and Dedola (1998), Artis (2003), Bekiros et al. (2014)). However, Masmann and Mitchell (2003) used the mean values of all bilateral correlation coefficients. In this study, that method was followed and the mean values of all bilateral correlation coefficients were calculated using two year rolling windows.10 Rolling windows help to observe a more accurate
picture of bilateral correlation coefficients as it helps to observe the correlation coefficient and its trend (Papageorgeou et al. (2010), Inklaar et al. (2008)). Nevertheless, Gayer (2007) argued that the results could be sensitive to the length of the rolling window chosen. Long-term windows tend to be more reliable but there is the risk of smoothing medium-term changes. Despite being less reliable compared to longer term windows, two year windows were used in this study in order to detect short term changes especially in periods of crisis.
The mean values for the periods were also calculated with the aim of tracking the changes. Five periods were identified. The first period, which we called the EMS period, began with 1980Q1 and lasted until 1991Q4. The second period started with the adoption of the Single Market in 1992Q1 and ended with the creation of the Euro in 1998Q4. This was also a preparation period for the Euro. The third period was between 1999Q1 and 2008Q2 and could be regarded as the period of the Euro. The crisis period was divided into two as the fourth and fifth periods. The fourth period was focused on the Global
10 The mean of 66 correlation coefficients were computed in each period, Nx(N-1)/2 as N=12.
Financial Crisis period dated from 2008Q3 to 2010Q1. Finally, the period of Sovereign Debt Crisis was identified that started in 2010Q2 and ended in 2014Q4. A Wald test with a null hypothesis was applied, so that the mean of the bilateral correlation coefficients of EMU countries were equal in the above-mentioned sub-samples.
3.2. Empirical Results
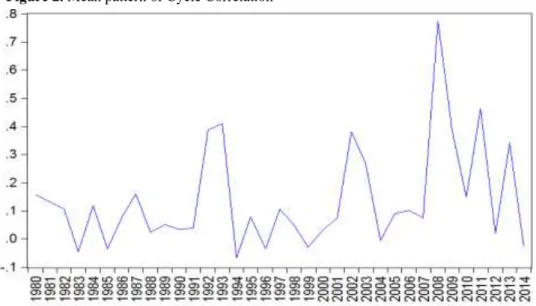
The mean value of the bilateral correlation coefficients is shown in Figure 2. First of all, the figure does not reflect a general trend of divergence or convergence. However, the figure reveals that the business cycle demonstrated a high correlation during the crisis years. For example, in the 1992-93 crises, the mean value of the correlation rose to 0.41. Thus, when the shock hit the countries, they slumped together, but in the aftermath of the crisis, in 1994, the mean value of the correlation coefficients fell sharply to -0.07. A similar pattern could be observed in the recession of 2002. However, the most striking is the mean value of correlations during the GFC. In 2008, the mean value of correlations skyrocketed. It was 0.77 in the year of the crisis but declined to 0.15 after the crisis. Despite the fact that it was not particularly high, it was similar to the case during the SDC. This finding supported the views of Gayer (2007), who argued that the mean values of average correlations were 12-13 pp lower during recovery periods than during recessions.
Figure 2. Mean pattern of Cycle Correlation
Figure 2 reveals that EMU countries slumped together with the shock, but they recovered at different speeds due to the structural differences between countries. Germany, Austria and Belgium began to recorded positive growth rates after the first quarter of 2010 and they recorded high growth rates. On the other hand, in GIPSI countries the recovery was sluggish. They could only record positive growth rates by the end of 2010 and they were subsequently hit by the Sovereign Debt Crisis.
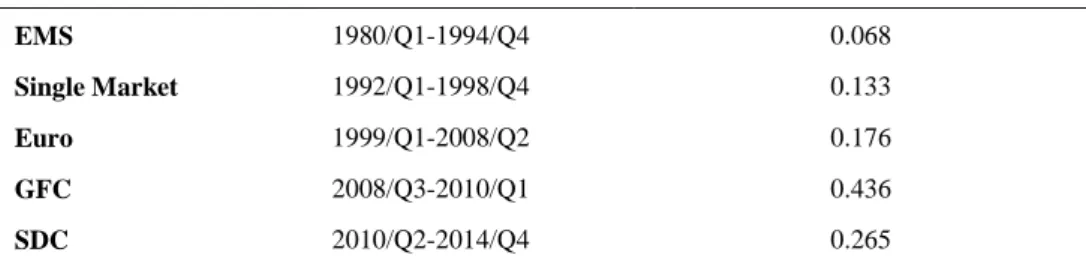
To track the changes, the means of correlations for the particular periods mentioned in the previous section were also computed. These are presented in Table 1 and the bilateral correlation coefficients of country pairs are shown in the tables in the Appendix section. The mean values of the correlations of EMU countries rose with the Single Market and Euro respectively. With the crisis, the correlations rose even further. However, in the SDC period, the mean value of correlation coefficients was smaller compared to the GFC. The point was that the GFC affected all countries in the EMU. It could be argued that the GFC was a symmetrical shock that affected all countries, whereas the SDC was an asymmetrical shock that hit particular countries. To sum up, Table 1 demonstrates two important outcomes. First, the business cycles converged through monetary integration. The synchronization of the cycles increased after the Single Market and introduction of the Euro respectively. Second, the correlation of cycles increased during crisis periods in line with the findings of Gayer (2007) and Bekiros et al. (2014).
Table 1. Mean Pattern of Cycle Correlation for Particular Periods*
Periods Mean Pattern of Cycle Correlation
EMS 1980/Q1-1994/Q4 0.068
Single Market 1992/Q1-1998/Q4 0.133
Euro 1999/Q1-2008/Q2 0.176
GFC 2008/Q3-2010/Q1 0.436
SDC 2010/Q2-2014/Q4 0.265
Source: Authors own calculations
* We calculated the mean of correlation coefficients represented in the tables in the Appendix.
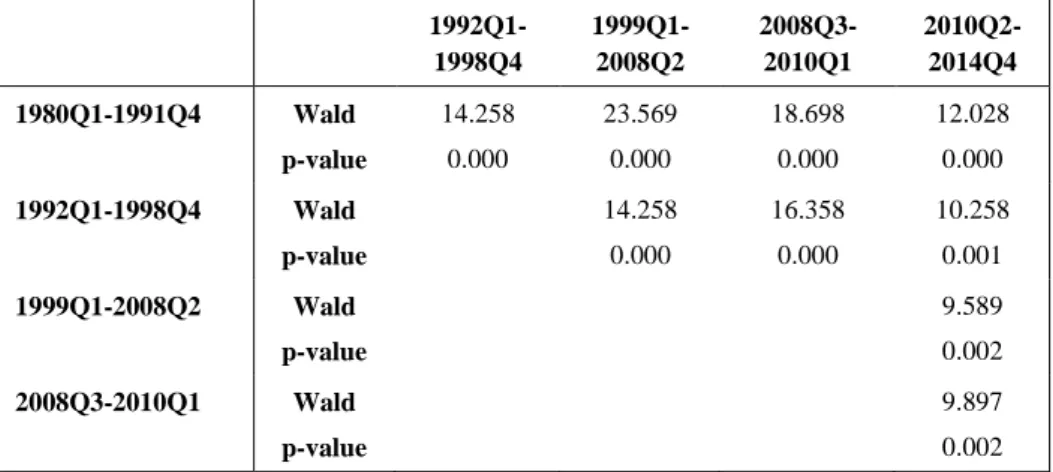
In order to verify these results, we had to analyze whether these periods could be analyzed separately. Therefore, the Wald test was applied to calculate Wald statistics and p-values. There were two hypotheses for this test and we wanted to reject the null hypothesis.
Ho: Mean correlation coefficients are equal across all four sub periods. H1: Mean correlation coefficients are not equal across all four sub periods.
Table 2. Wald Tests for the Business Cycle Correlations across Different Periods
1992Q1-1998Q4 1999Q1-2008Q2 2008Q3-2010Q1 2010Q2-2014Q4 1980Q1-1991Q4 Wald p-value 14.258 0.000 23.569 0.000 18.698 0.000 12.028 0.000 1992Q1-1998Q4 Wald p-value 14.258 0.000 16.358 0.000 10.258 0.001 1999Q1-2008Q2 Wald p-value 9.589 0.002 2008Q3-2010Q1 Wald p-value 9.897 0.002 Source: Author’s own calculations
All values calculated were statistically significant at 5% and 1% levels of significance. The Wald test is 𝜒2
(𝑟) where r is the number of linearly independent restrictions. For all sub-periods the Wald test H0 hypothesis is
strongly rejected and we could deduce that we could analyze the means of the periods separately. For example, the Wald test between the first two periods of 1980Q1-1991Q4 and 1992Q1-1998Q4 was statistically significant. The H0
hypothesis was strongly rejected. As observed in Table 2, the H0 was rejected
for all periods.
Concluding Remarks
Business cycle synchronization has been analyzed in several studies within the realm of the OCA theory. It is of vital importance for the functioning of monetary policy. If business cycles are correlated, then the single currency, which also means a single monetary policy, would no longer pose a problem. Otherwise, a common monetary authority would not be able to pursue monetary policies addressing the problems of member countries. This fact becomes more crucial in times of crisis as a monetary policy would be an effective stabilization tool. In addition, studies that have focused on synchronization in times of crisis are rare. Therefore, in this study, business cycle synchronization
was analyzed considering the effects of the financial crisis and there was separate focus on the GFC and SDC.
The findings of this study highlight three important issues. First, the business cycles of the respective countries converged with the creation of the Single Market and the Euro. This was in line with the arguments of endogeneity of OCA suggested by Frankel and Rose (1997). The creation of the Euro, led to business cycle synchronization in the EMU countries.
Second, the correlations of the business cycles were lower in the SDC when compared to the GFC, and the correlations declined even further after the crisis. The shock generated by the SDC was rather an asymmetric shock that hit particular countries. The core countries such as Germany, Austria and Belgium were not greatly affected by the SDC.
Third, the correlations rose during the crisis years but fell sharply afterwards. This simply reflects that even when the countries were hit by symmetric shocks, the recovery paths of the countries differed. This was due to the different economic structures of the member countries.
In conclusion, it can be said that whether the shock is symmetric or asymmetric, the recovery paths of the countries are asymmetric. For the sake of the monetary union, these asymmetries should be avoided. It is an important source of instability in the EMU. In this case, a single monetary policy would not be able to solve the problems of member countries. Even though the single monetary authority addresses the problems of those that recover late, the early recovering ones would be dissatisfied with the implemented monetary policy and attempt to influence the monetary policy authority. This was the case after the Sovereign Debt Crisis. For reasons of price stability, Germany in particular tried to deter the European Central Bank from pursuing Quantitative Easing policies.
The fiscal transfer system, which was proposed by Kenen (1969) decades ago, could be used to solve this problem. This would function like an automatic stabilizer after the crisis and help the countries that recover slowly. This would also lead to business cycle convergence in return and relieve the pressures on the single monetary policy. The findings of this study support the opponents of fiscal union in the EMU. It is clear that the countries diverged after the crisis periods. A fiscal transfer system which is embodied in fiscal union would be helpful to relieve the pressures on the monetary policy after the crisis.
References
Afonso, Antonio and Ana Squiera (2010), “Revisiting Business Cycle Synchronisation in the European Union”, ISEG Economics Working Paper No. 22/2010/DE/UECE.
Alain, Guay and Piere St-Amant (2005), “Do the Hodrick-Prescott and Baxter-King Filters Provide a Good Approximation of Business Cycles?”, Annales D’économie et de Statistique, 77: 133-155.
Alesina Alberto, Roberto J. Barroand Silvano Tenreyo (2002), “Optimal Currency Areas”, Harvard Institute of Economic Research Working Papers, 1958.
Alesina Alberto and Robert J. Barro, (2000), “Currency Unions”, NBER Working Paper Series, No. 7927.
Angeloni, Ignazio and Luca Dedola (1999), “From the ERM to the Euro: New Evidence on Economic and Policy Convergence among EU Countries”, ECB Working Paper Series, No. 4.
Artis, Michael J. and Wenda Zhang (1997), “International Business Cycles and the ERM”, International Journal of Finance and Economics, 2 (1): 1–16.
Artis, Michael (2003), “Is There a European Business Cycle?”, CESifo Working Paper, No. 1053. Baldwin, Richardand Charles Wysplosz (2009), The Economics of European Integration (London:
McGraw-Hill).
Barro, Robert J. and David B. Gordon (1983), “Rules, Discretion and Reputation in a Model of Monetary Policy”, NBER Working Paper, No. 1079.
Bayoumi, Tamim and Barry Eichengreen (1997), “Ever Closer to Heaven? An Optimum-currency-area Index for European Countries”, European Economic Review, 41 (3-5): 761-770. Bayoumi, Tamim and Mark P. Taylor (1996), “Macro-Economic Shocks, the ERM, and
Tri-Polarity”,The Review of Economics and Statistics, 77 (2): 321-331.
Baxter, Marianne and Michael A. Kouparitsas (2005), “Determinants of Business Cycle Co-movement: A Robust Analysis”, Journal of Monetary Economics, 52 (1): 113-157. Baxter, Marianne and Alan C. Stockman, (1989), “Business Cycles and the Exchange–Rate
Regime: Some International Evidence”, Journal of Monetary Economics, 23 (3): 377–400. Berger, Helge and Volker Nitsch (2005), “Zooming Out: The Trade Effect of the Euro in Historical
Perspective”, CESifo Working Paper, No. 1435.
Bergman, Michael (2004), “How Similar Are European Business Cycles”, EPRU Working Paper Series, No. 04-13.
Bekiros, Stelios, Nguyen, Duc Khuong, Uddin, Gazi S. and Bo Sjö (2014), “Business Cycle (De)Synchronization in the Aftermath of the Global Financial Crisis: Implications for the Euro Area”, Ipag Business School Working Paper Series, No. 437.
Buiter, Williem H. (2000), “Optimal Currency Areas: Why Does The Exchange Rate Regime Matter?”, CEPR Discussion Papers No. 2366.
Burns, Arthur F. (1969), “The Nature and Causes of Business Cycles”. Burns, Arthur F. (Der.), The Business Cycle in a changing World (NBER Publishing): 3-53.
Camacho, Maximo, Gabriel Perez-Quiros and Lorena Saiz (2006), “Are European Business Cycles Close Enough to Be Just One?”, Journal of Economics Dynamics and Control, 30 (9-10): 1687–1706.
Corden W. Max (1972), “Monetary Integration, Essays in International Finance”, International Finance Section, No. 93 (USA: Princeton University, Department of Economics).
Crespo-Cuaresma, Jesus and Fernández-Amador Octavio (2013), “Business Cycle Convergence in EMU: A First Look at the Second Moment”, Journal of Macroeconomics, 37 (C): 265-284. De Grauwe Paul (2006), “What Have We Learnt About Monetary Integration since the Maastricht
Treaty?”Journal of Common Market Studies, 44 (4): 711-30.
De Grauwe Paul (2007), Economics of Monetary Union (New York: Oxford University Press). De Grauwe Paul and Francesco P. Mongelli (2005), “Endogeneities of Optimum Currency Areas
What Brings Countries Sharing A Single Currency Closer Together?, ECB Working Paper, No. 468.
De Haan, Jakop, Robert Inklaar and Olaf Sleijpen (2002), “Have Business Cycles Become More Synchronized?, Journal of Common Market Studies, 40 (1): 23-42.
De Haan, Jakop, Robert Inklaar and Robert Jong-A-Pin (2008), “Will Business Cycles In the Euro Area Converge? A Critical Survey of Empirical Research”, Journal of Economic Surveys, 22 (2): 234–273.
Degiannakis, Stavros, David Duffy and George Filis (2014), “Business Cycle Synchronization in EU: A Time-Variying Approach”, Scottish Journal of Economics, 61 (4): 348-370.
Decressin, Jorg and Antonio Fatas (1994), “Regional Labour Market Dynamics”, INSEAD Working Paper Series, No. 94/61.
Emerson, Michael, Daniel Gross, Alexander Italianer, Jean P. Ferry and Horst Reichenbach (1992), One Market, One Money: An Evaluation of the Potential Benefits and Costs of Forming an Economic and Monetary Union (Oxford: Oxford University Press).
Ertürk, Emin (1992), Ekonomik Entegrasyon Teorisi ve Türkiye’nin İçinde Bulunduğu Entegrasyonlar (Bursa: Ezgi Kitabevi).
Fleming, Marcus (1971), “On Exchange Rate Unification”, The Economic Journal, 81(323): 467-488.
Frankel Jefrrey, A. and Andrew K. Rose (1997), “Is EMU More Justifiable Ex post Than Ex ante?”, European Economic Review, 41: 753-760.
Frankel Jefrrey, A. and Andrew K. Rose (1998), “The Endogenity of Optimum Currency Area Criteria”,The Economic Journal, 108 (449): 1009-1025.
Fratianni Michele and Juergen Von Hagen (1990), “The European Monetary System Ten Years After”, Carnegie-Rochester Conference Series on Public Policy, 32 (1): 173-241. Fridmuc, Jarko (2001), “The Endogeneity of Optimum Currency Area Criteria, Intra-Industry Trade
and EMU Enlargement”, LICOS Discussion Papers, No. 106/2001.
Friedman, Milton (1968), “The Role of Monetary Policy”, The American Economic Review, 58 (1): 1-17.
Furceri, Davide and Georgios Karras (2008), “Business Cycles Synchronization in the EMU”, Applied Economics, 40 (12): 1491-1501.
Gabisch, Günter and Hans-Walter Lorenz (1987), Business Cycle Theory: A Survey of Methods and Concepts (Berlin: Springer-Verlag).
Gächter, Martin, Alexandra Riedl and Doris Ritzberger-Grünwald (2012), “Business Cycle Synchronization in the Euro Area and the Impact of the Financial Crisis”, Monetary Polıcy & The Economy, 2 (12): 33-60.
Gayer, Christian (2007), “A Fresh Look at Business Cycle Synchronization in The Euro Area”, European Economy Economic Papers, No. 287.
Gerlach, H. Stefan, (1988), “World Business Cycle under Fixed and Flexible Exchange Rates”, Journal of Money, Credit and Banking, 20 (4): 621–632.
Giavazzi, Francescaand Marco Pagano (1988), “The Advantage of Tying One‟s Hand: EMS Dicipline and Central Bank Credibility”, European Economic Review, 32: 303-330. Giannone, Dominico, Michele Lenza and Lucrezia Reichlin (2008),“Business Cycles in the Euro
Area”, NBER Working Papers, No.14529.
Gil Pajera, Salvador, Rafael Vivero and José Antonio (2008), “Trade Effects of Monetary Agreements: Evidence for OECD Countries”, European Economic Review, 52 (4): 733-755.
Gomez, David M., Guillermo J. Ortega, and Benno Torgler (2012),“Synchronization and diversity in business cycles: A network approach applied to the European Union”, CREMA Working Paper Series, No. 2012-01.
Gross, Daniel and Niels Thygesen (1998), European Monetary Integration (New York: Addison Wesley Longman).
Haberler, Gottfried (1970), “The International Monetary System: Some Recent Developments and Discussions”, Halm, George (Der.), Approaches to Greater Flexibility in Exchange Rates (Princeton: Princeton University Press): 115-23.
Hall, Peter (2012), “The Economics and Politics of the Euro Crisis”, German Politics, 21 (4): 355-371.
Hamilton, James D. (2005), “What‟s Real about the Business Cycle?, Federal Reserve Bank of St. Louis Review, 87 (4): 435-452.
Ingram, James (1962), Regional Payments Mechanisms: The Case of Puerto Rico (Chapel Hill: University of North Carolina Press).
Inklaar, Robert and Jakop De Haan (2001), “Is There Really a European Business Cycle? A Comment”, Oxford Economic Papers, 53: 215–220.
Ishiyama, Yosha (1975), “The Theory of Optimum Currency Areas: A Survey”, IMF Staff Papers, 22 (2): 349-359.
Kalemli-Özcan, Şebnem, Bent, E. Sorensen and Oved Yosha (2003),“Risk Sharing and Industrial Specialization: Regional and International Evidence”, American Economic Review, 93 (3): 903-18.
Kawai, Masahiro (1992), “Optimum Currency Areas”, Newman, Peter, Milgate Murray, John Eatwell Murray Milgate and John Eatwell (Der.), The New Palgrave Dictionary of Money and Finance (NewYork: Macmillan): 78-81.
Kenen, Peter B. (1969), “The Theory of Optimum Currency Areas: An Eclectic View”, Mundell, R. and A. Swoboda (Der.), Monetary Problems of the International Economy (Chicago: The University of Chicago Press): 41-60.
Kindleberger, Charles P. (2000), Manias, Panics, and Crashes (Canada: John Wiley and Sons Inc). Konstantakopoulou, Ioanna and Efthymios Tsionas (2011), “The Business Cycle in Eurozone
Economies (1960 to 2009)”, Applied Financial Economics, 21 (20): 1495-1513.
Krugman, Paul R. (1993), “Lessons of Massachusetts for EMU”, Torres F. and Giavazzi F (Der.), Adjustment and Growth in the European Monetary Union (Cambridge: Cambridge University Press): 241-261.
Krugman, Paul R. (2012), “Revenge of the Optimum Currency Area”, NBER Macroeconomics Annual, No. 27.
Kydland, Finn E. and Edward, C. Prescott (1977), “Rules Rather Than Discretion: The Inconsistency of Optimal Plans”, The Journal of Political Economy, 85 (3): 473-492. Lee, Jim (2013), “Business Cycle Synchronization in Europe: Evidence from a Dynamic Factor
Model”, International Economic Journal, 27 (3): 347-364.
Massmann, Michaeland James Mitchell (2003), “Reconsidering the Evidence: Are Eurozone Business Cycles Converging?, Journal of Business Cycle Measurement and Analysis, 1 (3): 275–308.
McKinnon, Ronald I. (1963), “Optimum Currency Areas”. American Economic Review, 53 (4): 717-725.
Mckinnon, Ronald I. (2004), “Optimum Currency Areas and Key Currencies: Mundell I versus Mundel II”, Journal of Common Market Studies, 42 (4): 689-715.
Mongelli, Francesco P. (2002), “„New‟ Views on the Optimum Currency Area Theory: What is EMU Telling US?, European Central Bank Working Paper Series, No. 138.
Mongelli, Francesco P. (2008), “European Economic and Monetary Integration and the Optimum Currency Area Theory”. European Commission Economic Papers, No. 302.
Mundell, Robert (1961), “Theory of Optimum Currency Areas”, American Economic Review, 51 (4): 657-665.
Mundell, Robert (1973), “Uncommon Arguments for Common Currencies”, Johnson, Harry G. and Alexander K. Swoboda (Der.), The Economics of Common Currencies: Proceedings, (Cambridge, Massachusetts: Harvard University Press): 114-132
Murray, Christian J. (2002), “Cyclical Properties of Baxter-King Filtered Time Series”, MIT Press Journals, 85 (2): 472-476.
Papageorgiou, Theofanis, Michaelides, Panayotis G.and John G. Millios (2010), “Business Cycle Synchronization and Clustering in Europe (1960-2009)”, Journal of Economics and Business, 62 (5): 419-470.
Rockoff, Hugh (2000). How Long Did It Take the United States to Become an Optimal Currency Area? NBER Working Paper, No.124.
Rose, Andrew K. (2000). “One Money, One Market: Estimating the Effect of Common Currencies on Trade”, Economic Policy, 15 (30): 9-45.
Rose, Andrew and Charles Engel (2002), “Currency Unions and International Integration”, Journal of Money, Credit and Banking, 34 (3): 1067–1089.
Savaş, Vural F. (1999), Çağımızın Deneyi Euro (Ankara: Siyasal Kitabevi).
Silva, J. Santos and Silvia Tenreyro (2010), “Currency Unions in Prospect and Retrospect”. Annual Review of Economics, Annual Reviews, 2 (1): 51-74.
Tavlas, George S. (1993), “The „New‟ Theory of Optimum Currency Areas”, The World Economy, 16 (6): 663-685.
Tavlas, George S. (1994), “The Theory of Monetary Integration”, Open Economies Review 5 (2): 211-230.
Tavlas George S. (2009), “Optimum Currency Area Paradoxes”, Review of International Economics, 17 (3): 536–551.
Tower, Edward and Tower Willet (1976), The Theory of Optimum Currency Areas and Exchange Rate Flexibility (Princeton: Princeton University Press).
AUSTRIA BELGIUM FINLAND FRANCE GERMANY GREECE IRELAND ITALY LUXEMBURG NETHERLANDS PORTUGAL SPAIN AUSTRIA 1.000 BELGIUM 0.295 1.000 FINLAND 0.071 0.256 1.000 FRANCE 0.259 0.511 0.406 1.000 GERMANY 0.426 0.067 -0.031 0.183 1.000 GREECE -0.008 0.244 -0.148 0.173 0.295 1.000 IRELAND -0.090 0.102 0.161 0.207 0.024 -0.033 1.000 ITALY -0.311 -0.111 0.002 0.043 -0.014 -0.038 0.197 1.000 LUXEMBURG -0.008 0.100 -0.019 0.031 0.088 0.127 -0.515 0.105 1.000 NETHERLANDS 0.200 0.214 -0.002 0.113 0.160 0.032 0.006 0.071 0.052 1.000 PORTUGAL -0.031 0.096 -0.094 0.238 -0.132 0.243 0.034 -0.277 -0.109 0.203 1.000 SPAIN 0.137 0.190 -0.089 0.120 -0.064 0.339 0.003 -0.432 0.008 0.212 0.430 1.000 1992 Q1-1998 Q4
AUSTRIA BELGIUM FINLAND FRANCE GERMANY GREECE IRELAND ITALY LUXEMBURG NETHERLANDS PORTUGAL SPAIN
AUSTRIA 1.000 BELGIUM 0.298 1.000 FINLAND 0.309 0.252 1.000 FRANCE 0.499 0.604 0.402 1.000 GERMANY 0.077 0.337 0.117 0.272 1.000 GREECE 0.160 0.423 0.246 0.380 0.330 1.000 IRELAND 0.018 0.184 0.224 0.223 0.200 0.110 1.000 ITALY 0.389 0.138 0.078 0.256 0.381 0.062 0.257 1.000 LUXEMBURG -0.066 0.171 -0.096 -0.152 0.173 -0.048 0.023 0.108 1.000
AUSTRIA 1.000 BELGIUM 0.476 1.000 FINLAND -0.077 0.263 1.000 FRANCE 0.343 0.542 0.443 1.000 GERMANY 0.169 0.293 0.291 0.546 1.000 GREECE 0.303 0.135 0.223 0.241 0.085 1.000 IRELAND 0.039 0.298 0.202 0.374 0.205 -0.096 1.000 ITALY 0.467 0.578 0.276 0.699 0.601 0.368 0.275 1.000 LUXEMBURG 0.123 0.147 0.476 0.339 0.253 0.190 0.293 0.275 1.000 NETHERLANDS 0.428 0.402 0.149 0.540 0.519 0.083 0.325 0.492 0.032 1.000 PORTUGAL 0.409 0.200 0.318 0.298 0.080 -0.077 0.192 0.138 0.288 0.403 1.000 SPAIN 0.235 0.191 0.230 0.274 0.256 0.234 0.059 0.337 0.256 0.399 0.391 1.000 2008 Q3-2010 Q1
AUSTRIA BELGIUM FINLAND FRANCE GERMANY GREECE IRELAND ITALY LUXEMBURG NETHERLANDS PORTUGAL SPAIN
AUSTRIA 1.000 BELGIUM 0.794 1.000 FINLAND 0.443 0.741 1.000 FRANCE 0.699 0.932 0.793 1.000 GERMANY 0.551 0.823 0.957 0.916 1.000 GREECE 0.361 0.560 0.772 0.602 0.767 1.000 IRELAND 0.145 0.484 0.155 0.559 0.296 0.130 1.000 ITALY 0.595 0.928 0.869 0.933 0.932 0.632 0.396 1.000 LUXEMBURG 0.595 0.585 0.464 0.807 0.585 0.114 0.641 0.794 1.000 NETHERLANDS 0.705 0.809 0.870 0.873 0.919 0.529 0.130 0.871 0.638 1.000
AUSTRIA BELGIUM FINLAND FRANCE GERMANY GREECE IRELAND ITALY LUXEMBURG NETHERLANDS PORTUGAL SPAIN AUSTRIA 1.000 BELGIUM 0.791 1.000 FINLAND 0.588 0.732 1.000 FRANCE 0.612 0.574 0.435 1.000 GERMANY 0.791 0.846 0.618 0.675 1.000 GREECE -0.247 -0.193 -0.209 -0.460 -0.340 1.000 IRELAND -0.050 0.356 -0.023 0.019 0.197 -0.011 1.000 ITALY 0.553 0.789 0.571 0.548 0.732 -0.203 0.404 1.000 LUXEMBURG 0.106 0.290 0.174 0.426 0.453 -0.258 0.326 0.425 1.000 NETHERLANDS 0.553 0.414 0.517 0.408 0.516 -0.161 -0.244 0.573 0.147 1.000 PORTUGAL 0.414 0.408 0.457 0.283 0.369 0.088 -0.333 0.494 -0.098 0.529 1.000 SPAIN 0.072 0.301 0.363 0.163 0.282 0.073 0.052 0.397 0.232 0.555 0.327 1.000