Chapter 7
DOI: 10.4018/978-1-5225-5149-2.ch007
ABSTRACT
Diabetes is a life-long illness which occurs as a result of lack of insulin hormone or ineffectiveness of insulin hormone. Blood sugar, fructosamine, and hemoglobin A1c (HbA1c) values are widely used for diagnosis of this disease. Although the role of insulin in diagnosing diabetes is great, the HbA1c value is more accurate. This is because HbA1c value gives information about the past two or three months of blood sugar in the treatment of diabetes. This study aims to estimate the HbA1c value with high accuracy. Follow-up data of diabetic patients were used as data. The Orange data mining software is used because it is easy to use in the modeling phase and contains many methods. In this context, the chapter aims to develop an effective prediction model by using a large number of feature selection and classification methods. The results show that the proposed model successfully predicts the HbA1c parameter. In addition, determination of the parameters that are effective in the diagnosis of diabetes has been carried out with the feature selection methods.
Use of Orange Data Mining
Toolbox for Data Analysis in
Clinical Decision Making:
The Diagnosis of Diabetes Disease
Musa PekerMuğla Sıtkı Koçman University, Turkey
Osman Özkaraca
Muğla Sıtkı Koçman University, Turkey
Ali Şaşar
INTRODUCTION
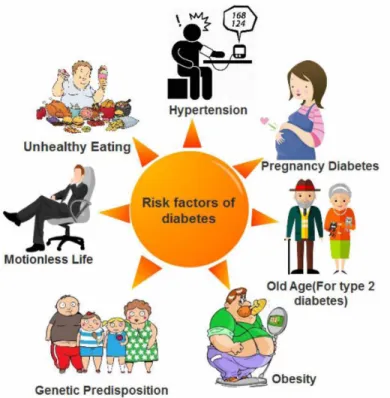
Nowadays, diabetes is becoming one of the most serious diseases. Incidence frequency of diabetes which is increasing in the world varies from one community to another based on age, gender, race, dietary habits, genetic characteristics and environmental factors. According to the data obtained from World Health Organization, 108 million diabetics are thought to be in the world in 1980, it is estimated as 422 million in 2014. The global prevalence of diabetes has almost doubled from 4.7% to 8.5% from 1980 to 2014 (World Health Organization, 2016). Unfortunately, every year, about 1.5 million people lose their lives due to diabetes. One of the most important reasons for this increase can be thought as increase in overweight or obese people resulting from malnutrition and sedentary life. According to the data obtained from the same report, 1 out of 3 adults over 18 years old are overweight and 1 out of 10 adults are obese (World Health Organization, 2016).According to the obtained data and the results obtained from the scientific studies, the risk factors of diabetes can be summarized as shown in Figure 1.
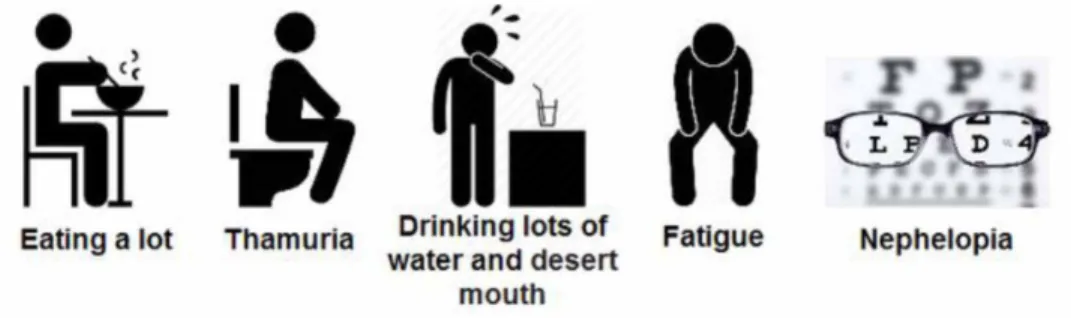
The most important reason of diabetes are the impairments occurred especially in the insulin-secreting cells of pancreas. Insulin is needed for nutrients to be transferred into the cell after the taken by a healthy person, nutrients pass into the blood from the intestines in order to be turned into glucose which is the fuel most needed by the body. If there is no insulin hormone or if the effect of insulin decreases, glucose cannot be transferred into the cell and the amount of sugar in the blood (hyperglycemia) will increase. If this high blood sugar keeps going on constantly, it causes serious damages in our organs (nerve, eye, heart, kidney etc.) over time. As can be seen from Figure 2, excessive and frequent thirst of an individual, increased fluid consumption, excessive urine production, visual impairment, unidentified weight loss, constant tiredness and exhaustion are considered as preliminary indicators of diabetes in energy metabolism (Bilous & Donnelly, 2010).
There are two types of diabetes. These are Type 1, Type 2 and Gestational diabetes. Type 1 diabetes is caused by damage to pancreatic and insulin-producing beta cells at the end of an autoimmune process, or due to unfamiliar disorders. In general, 5-10% of diabetes cases in the community constitute cases of Type 1 diabetes. Type 1 diabetes is a disease that occurs when the immune system of a healthy individual perceives pancreatic beta cells as foreign as a result of virus, vaccination, medicine, physical or psychic stress and destroy them. When this destruction reaches over 80%, disease symptoms arise. Because Patients with type 1 have insulin deficiency, they must take insulin hormone from outside for life (Durna, 2002).
Type 2 diabetes is generally associated with obesity and physical immobility. At the basis of the disease, genetically predisposed individuals have a lifestyle-related insulin resistance and decreased insulin secretion over time. More than 90% of diabetes cases diagnosed worldwide are type 2 diabetes. Type 2 diabetes is controlled using diet, antihyperglycemic drugs and insulin supplementation or combination of them in the first step treatment plan (Durna, 2002).
Gestational diabetes, the third type of diabetes, is expressed by hyperglycemia or increased blood sugar, which is normally higher during pregnancy, but below the
diagnostic value of diabetes mellitus. Women with gestational diabetes are at risk of complications during pregnancy and birth. At this point, they and their children are at increased risk of type 2 diabetes in the future.
Blood sugar, fructosamine and HbA1c values are widely used for the diagnosis of diabetes. However, it is known that the HbA1c value is more accurate in the diagnosis of the disease. The reason for this is that the HbA1c value gives information about the past two or three months of blood sugar in the treatment of diabetes. Thus, this value has started to be used more in recent years. The American Diabetes Association (ADA) approved the HbA1c test in 2010 as a diabetes diagnostic test. It has been emphasized that normal range of this value is between 3% - 6% and 6.5% hasbeen chosen as the diagnostic criterion (Afarideh et al., 2016; Rau et al., 2016)
RELATED WORKS
There are many studies on diabetes in literature. Because of the quite satisfactory results obtained in recent years, technological approaches in the field of medicine are attracted by physicians. Diversification and progress of both technological and theoretical approaches in computer science have attracted attention of health professionals. In particular, technology is in serious demand for the benefits it provides in decision making of health professionals and facilitating their work.
Hypoglycaemia is very common in type 1 diabetic patients and may occur at any age. For this reason, a continuous accurate hypoglycaemia monitoring system is a very important medical device for diabetic patients. Needle measuring systems used in such patients considerably reduce patients’ quality of life. Thus, Ling et al. (2016) proposed a noninvasive hypoglycaemia monitoring system using the physiological parameters of the electrocardiography (ECG) signal. In the study, an over-learning machine was used to increase the accuracy of perception in recognition of the presence of hypoglycemia.
Another study model in this area was specifically designed to explore the relationship between different parameters and disorders in diabetic patients. For example; in the study carried out by Afarideh et al. (2016), it is aimed to determine the prospective relationship between basal serum alanine aminotransferase (ALT) levels and cardiovascular diseases (CVD) among patients with type 2 diabetes. In the study, regression analysis, artificial neural network modeling, and risk classification analyzes were used to report risk ratios (HR).
Diabetes is thought to be the source of many serious problems, and technology is also helping medicine here. For example, diabetes leads to an increased risk of developing liver cancer. These two diseases are known as the most common and important causes of morbidity and mortality. For this reason, Rau et al. (2016) have
developed a model to estimate the development of liver cancer 6 years after diagnosis with type II diabetes using data mining techniques. The data obtained from Taiwan National Health Insurance Research Database (NHIRD) have been divided into two groups: patients diagnosed with cancer after diabetes (case group) and patients with diabetes but no liver cancer (control group). Risk factors have been determined from the literature review and from the physician’s recommendation. A chi square test has been used for each independent variable (or potential risk factor) to compare non-significant findings with patients with liver cancer. Artificial neural network (ANN) and logistic regression (LR) methods have been used in the classification phase.
When we look at the studies carried out in the literature in the past, it is seen that the existing expert-based identification algorithms are no longer preferred because of the low recall rate and the loss of a large number of valuable data under strict filtering standards. For this reason, the recent studied on machine learning, which is becoming increasingly important, has begun to draw attention. Zheng et al. (2017) have attempted to reveal several genotypic phenotype associations related to Type 2 Diabetes Mellitus (T2DM) through genome-wide association studies (GWAS) and phenomenon-wide association studies (PheWAS). In their study, they used patients with or without Type 2 diabetes from their Electronic Health Records. In their study, they have evaluated and compared the performance of commonly used machine learning models including the nearest neighbors algorithm, Naive Bayes, Decision Tree, Random Forest, Support Vector Machine and Logistic Regression. In the study, from the data obtained from the electronic registration system, it is emphasized that machine learning is effective in separating subjects with and without Type 2 diabetes.
The analysis of data on the symptoms of a person with many diseases at the same time and taking into account all the factors is not possible by a person (doctor). In such cases, an intelligent system can take into account various factors, and the determination of a suitable model among different parameters can provide tremendous convenience. Heydari et al. (2016) have applied a variety of data mining methods and algorithms to screening data for type 2 diabetes. Performance of methods such as support vector machine, artificial neural networks, decision tree, nearest neighbors and Bayesian networks have been compared to find the best algorithm in diagnosing of this disease. In the study, artificial neural networks have the best performance with an accuracy rate of 97.44% on the selected dataset. The accuracy rates for support vector machine, decision tree, k-nearest neighbors and Bayesian methods are 81.19%, 95.03%, 90.85% and 91.60%, respectively.
The estimation of the results is significant in the clinical decision-making process. ANNs have been used to forecast the risk of post-operative events including survival, and are increasingly being used in complex medical decision making. In a study conducted by Lopez-de-Andres et al. (2016), they have designed an observational
study using ANN analysis to calculate prognostic factors of in-hospital mortality in patients with type 2 diabetes (T2DM) after major lower extremity amputation (LEA).
Soltani and Jafarian (2016) have emphasized the necessity of using methods with a minimum error rate in order to better diagnose a dangerous disease such as diabetes. They have used the probabilistic artificial neural network approach to diagnose type II diabetes. As a result, training accuracy and test accuracy have been found as 89.56% and 81.49%, respectively.
Amato et al. (2013) examined the abilities and limitations of artificial neural networks by applying a medical diagnosis on cancer and diabetes data. As a result, they have mentioned that artificial neural networks are a powerful aid for diagnosis, and they have also mentioned the advantages of artificial neural networks such as ability for processing large data and rapid diagnosis. However, it has been emphasized that the decision of expert physicians is important in establishing a definite diagnosis.
In another study conducted by Leema et al. (2016)., they have developed a computer-assisted diagnostic system. In this system, artificial neural networks, particle swarm optimization and gradient descent based backpropagation algorithms are proposed for classification of clinical data sets. The study used Pima Indian Diabetes, Wisconsin Breast Cancer and Cleveland Heart Disease datasets obtained from the California Irvine (UCI) machine learning repository. As a method, a backpropagation based differential variation algorithm based on universal knowledge has been chosen. The results show that the proposed method achieves an accuracy of 85.71% for diabetes, 98.52% for breast cancer and 86.66% for heart disease.
Choubey and Paul (2016) have compared various techniques used to classify the diagnosis of medical diabetes on various data sets. These techniques have been analyzed and compared based on advantages, problems and performance of success.
Wang et al. (2013) have used artificial neural networks to classify type 2 diabetes. The verification ability of the different models has been compared using the ROC curve. In diagnosis of diabetes, it has been seen that classification success of artificial neural networks is high and it has been accepted as an effective classification method.
In their study, Rajesh and Sangeetha (2012), have stated that the data mining has been applied to find useful patterns in determining medical diagnosis and treatment. In the study, several classification algorithms have been applied to classify the diabetes data set and performance analyzes of these algorithms have been carried out. With the C4.5 decision tree algorithm, 91% classification success has achieved in the diagnosis of diabetes mellitus.
In this study, it is explained that follow-up data of diabetes obtained from the hospitals in Turkey/Muğla region is processed by ORANGE program which is anew data visualization, machine learning and data mining software with open source code (Demšar et al., 2013). This study differs from the other studies in terms of originality especially in terms of the data used and the usage of ORANGE software
in the field of data mining applications. Using this software, data from different hospitals are combined. After that, a method for diagnosis of diabetes is proposed with the possibilities offered by this software. The proposed method involves data mining processes.
MATERIALS AND METHODS
Dataset
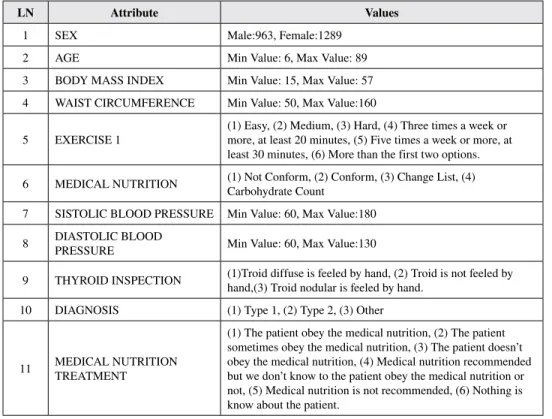
The data used in the study are diabetes follow-up data obtained from Köyceğiz and Dalaman State Hospitals of Mugla province in Turkey. Table 1 includes 27 features that constitute our data set and their explanations. There are 2252 records of patients (963 male and 1289 female) in the data set. Their age range is between 6 and 89.
Table 1. Short explanations of attributes
LN Attribute Values
1 SEX Male:963, Female:1289 2 AGE Min Value: 6, Max Value: 89 3 BODY MASS INDEX Min Value: 15, Max Value: 57 4 WAIST CIRCUMFERENCE Min Value: 50, Max Value:160
5 EXERCISE 1 (1) Easy, (2) Medium, (3) Hard, (4) Three times a week or more, at least 20 minutes, (5) Five times a week or more, at least 30 minutes, (6) More than the first two options. 6 MEDICAL NUTRITION (1) Not Conform, (2) Conform, (3) Change List, (4) Carbohydrate Count 7 SISTOLIC BLOOD PRESSURE Min Value: 60, Max Value:180
8 DIASTOLIC BLOOD PRESSURE Min Value: 60, Max Value:130
9 THYROID INSPECTION (1)Troid diffuse is feeled by hand, (2) Troid is not feeled by hand,(3) Troid nodular is feeled by hand. 10 DIAGNOSIS (1) Type 1, (2) Type 2, (3) Other
11 MEDICAL NUTRITION TREATMENT
(1) The patient obey the medical nutrition, (2) The patient sometimes obey the medical nutrition, (3) The patient doesn’t obey the medical nutrition, (4) Medical nutrition recommended but we don’t know to the patient obey the medical nutrition or not, (5) Medical nutrition is not recommended, (6) Nothing is know about the patient.
Orange Data Mining Software
ORANGE data mining software was originally developed by scientists at the University of Ljubljana in 1997 using the Python, Cython, C ++ and C programming languages. The software’s graphical environment and interfaces have been developed using the Python and Qt3 libraries (Demšar et al., 2013). This software, with the latest version presented on March 6, 2017 with ORANGE 3.4.0 has a simple interface on which users create a data analysis workflow by placing graphical components (widgets).
LN Attribute Values
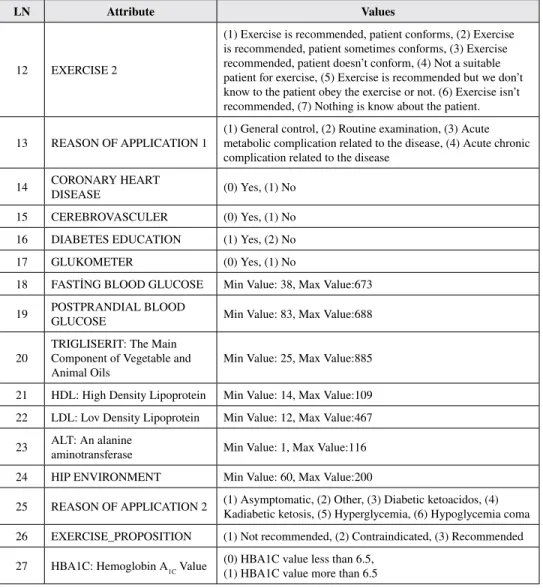
12 EXERCISE 2
(1) Exercise is recommended, patient conforms, (2) Exercise is recommended, patient sometimes conforms, (3) Exercise recommended, patient doesn’t conform, (4) Not a suitable patient for exercise, (5) Exercise is recommended but we don’t know to the patient obey the exercise or not. (6) Exercise isn’t recommended, (7) Nothing is know about the patient.
13 REASON OF APPLICATION 1 (1) General control, (2) Routine examination, (3) Acute metabolic complication related to the disease, (4) Acute chronic complication related to the disease
14 CORONARY HEART DISEASE (0) Yes, (1) No 15 CEREBROVASCULER (0) Yes, (1) No 16 DIABETES EDUCATION (1) Yes, (2) No 17 GLUKOMETER (0) Yes, (1) No
18 FASTİNG BLOOD GLUCOSE Min Value: 38, Max Value:673 19 POSTPRANDIAL BLOOD GLUCOSE Min Value: 83, Max Value:688 20 TRIGLISERIT: The Main Component of Vegetable and
Animal Oils Min Value: 25, Max Value:885 21 HDL: High Density Lipoprotein Min Value: 14, Max Value:109 22 LDL: Lov Density Lipoprotein Min Value: 12, Max Value:467 23 ALT: An alanine aminotransferase Min Value: 1, Max Value:116 24 HIP ENVIRONMENT Min Value: 60, Max Value:200
25 REASON OF APPLICATION 2 (1) Asymptomatic, (2) Other, (3) Diabetic ketoacidos, (4) Kadiabetic ketosis, (5) Hyperglycemia, (6) Hypoglycemia coma 26 EXERCISE_PROPOSITION (1) Not recommended, (2) Contraindicated, (3) Recommended 27 HBA1C: Hemoglobin A1C Value (0) HBA1C value less than 6.5, (1) HBA1C value more than 6.5
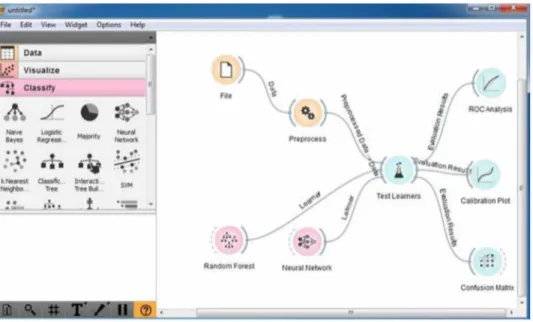
The graphical components (Widget) of this software which is user friendly provide basic functions to the user such as data reading, displaying the data tables, selecting the features, learning estimators, comparison of learning algorithms and visualization of data items. User can explore the visualizations interactively. User can also observe the results visually. The comparison of different algorithms with different criteria in the performance evaluation phase is one of the important advantages of this program. The user interface of the Orange program is shown in Figure 3.
Orange is designed to work with a .tab extensioned dataset. But it can also open commonly used dataset extensions such as txt, basket, .csv, .arff. In this study, short but effective examples related to the ORANGE program are given.
Feature Selection Methods
Features extracted from the data set are usually used as input to the classification method that will be used in data mining applications. In some applications, the number of features is limited to a few, while some of them may have too much. The extracted features for each data item are stored in a feature matrix. Hence, both the dataset size and the number of features will affect the size of the matrix, i.e. the duration of the process. It is important how well the extracted features represent the dataset and the classes corresponding to the dataset. Features that can better distinguish between classes are called high-level features and are more important in
terms of classifier performance. Rather than using all features, only the use of some high-level features can reduce the number of operations performed. In addition, performance increases can be provided by cleaning up noisy features.
In this study, experiments have been performed using 4 different feature selection algorithms. These algorithms are ReliefF, Information Gain, Chi-Square and Gain Ratio. ReliefF is an improved version of the Relief statistical model (Kononenko, 1994). The ReliefF method handles an example from the dataset. And, it performs the feature selection by creating a model based on this example’s proximity to other samples in its class and its distance from the different classes. Compared to Relief, ReliefF is a more robust algorithm. It processes missing and noisy data better, can be applicable in all situations, less biased, allow interaction between features, and can catch local dependencies missed by other methods. Information Gain: This method is commonly used in feature selection operations. The main purpose of this method is to find the feature set with the most knowledge of classes. It is an entropy-based feature selection algorithm and the information gain coefficient is calculated for each attribute, and the feature sets with the highest coefficient are selected. The chi-square method is statistics based and it is commonly used in feature selection. This method calculates the chi-square of all attributes and evaluates them one by one according to the class of attributes. Gain Ratio is a different version of Information Gain. Information gain favors features that have a large number of values. But, the Gain Ratio method is to maximize the feature information gain while minimizing the number of its values.
Classification Methods
In this work, we have used five classifiers namely random forest algorithm, Feed forward neural network classifier, decision tree, k-nearest neighbors classifier and support vector machines which are briefly explained as follows.
• Random Forest Algorithm: During the classification process, it is aimed to increase the classification value by using more than one decision tree. Instead of producing a single decision tree, Breiman (2001) has proposed combining the decisions of a large number of multivariate trees, each trained with different training sets. Training sets are created from the original training set with random feature selection and bootstrap. First, each decision tree gives its own decision, and the class with the maximum number of votes in the decision forest is regarded as the final decision and the incoming test data is included in that class.
• Feed-Forward Artificial Neural Networks: This algorithm is a mathematical system consisting of several processing units linked together in a weighted fashion. This processing unit receives signals from other neurons; combines them, transforms them, and generates a numerical result. In general, the processing units correspond roughly to real neurons and are interconnected within a network; this structure constitutes neural networks. In this study, feed-forward neural network is used among neural network models. There are basically three different layers in feed-forward artificial neural networks. These layers are respectively; an input layer that holds input data to the artificial neural network, a hidden layer or layers on which operations are performed and trains itself according to the desired result, and finally an output layer that shows output values.
• K-Nearest Neighbors Classifier (KNN): This is a supervised learning method where a new coming sample is classified based on the closest training samples present in feature field. When the test data is given, it is mapped to the class that is most common among the k neighbors (Acharya et al., 2012). • Support Vector Machines (SVM): This is a supervised classification
algorithm which constructs a separating hyperplane in high dimensional space that can be used for classification. A good separation is obtained by the hyperplane that has largest distance to the nearest training data point of any class (Acharya et al., 2012).
• Decision Tree (DT): In this algorithm, the input features are used to construct a tree. A set of rules representing the different classes is then derived from the tree. These rules are used to forecast the class of a new instance with an unknown class (Acharya et al., 2012).
Performance Evaluation Criteria
In this study, five different performance evaluation criteria have been used during the performance evaluation phase. These are; accuracy, sensitivity, specificity, AUC and ROC curves, respectively.
Accuracy TP TN TP FP FN TN x = + + + + 100% (1) Sensitivity TP TP FN x = + 100% (2)
Specificity TN
FP TN x
=
+ 100% (3)
Area under curve AUC TP
TP FN TN FP TN
(
)
= + + + 1 2 (4)True Positive (TP) refers to the number of correct classification of diseased data, false negative (FN) refers to the number of incorrect classification of healthy data. True Negative (TN) indicates the correct classification number of healthy data, while False Positive (FP) indicates the number of incorrect classification of diseased data.
The ROC curve is often used to allow the diagnostic test to define its own correctness and to make a reliable comparison between the tests. The area under the ROC for a diagnostic test can range from 0.50 to 1.00 depending on the activity level. The larger this area, the more distinction ability the diagnostic test will have.
EXPERIMENTAL RESULTS AND DISCUSSION
Case Study 1: Comparison of Classification Algorithms
in the Estimation of Three-Level HbA1c Value
In this application, an estimation of the level of HbA1c which is an important parameter for the diagnosis of diabetes is aimed. In this context, a 3-level estimation system has been realized. The level classification has been carried out as follows: If HbA1c <6.5, “normal (Level 0)”, if 6.5≤HbA1c <9, “high (Level 1)” and if HbA1c≥9, “very high (Level 2)”.
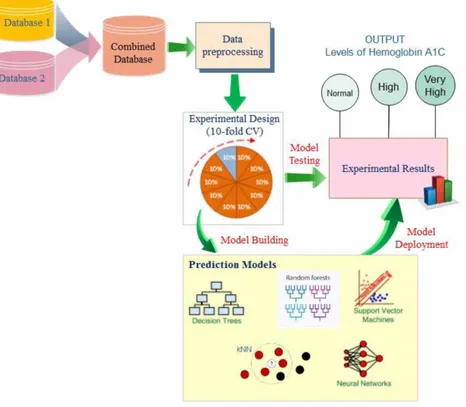
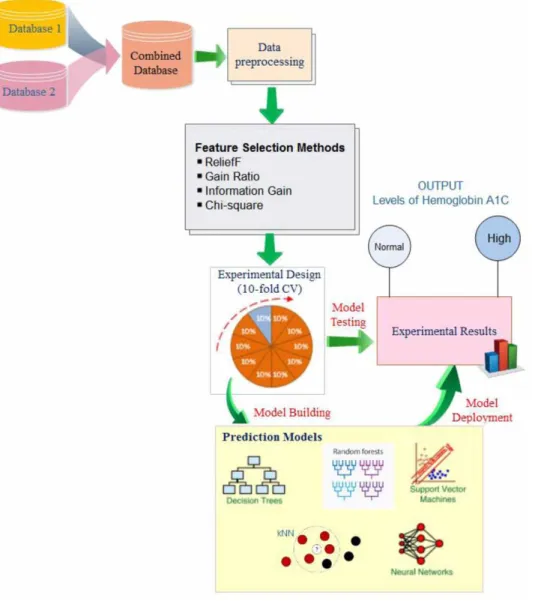
The block diagram of the proposed system is presented in Figure 4. In the first step, in order to make the classification process more efficient, normalization process is applied to the data between 0-1. The Min-Max method given in Equation 5 is used as the normalization method.
′ = − − x x x x x i min max min (5) In this equation, ′x denotes the normalized data; xi denotes the input value;
xmindenotes smallest number in the input set; xmax denotes the largest number in
using the “Change with Random Values” method in the missing data analysis module of the Orange program.
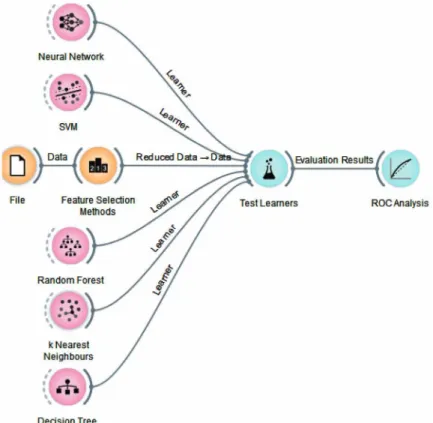
After the data selection and pre-processing stages, the Training-Test data distribution phase has been carried out. In this phase, 10 layered cross validation method is used. Classification operations have been performed at the next stage. In this stage, experiments were carried out with 5 different classification algorithms to evaluate the performance of the feed-forward neural networks. These algorithms include; Artificial neural networks, Random Forest, k-nearest-neighbors, support vector machines and decision tree learning. The number of trees in the Random Forest algorithm has been determined as 10. In the neural network algorithm, the hidden layer neuron number is 20, the hidden layer activation function is sigmoid, the number of iterations is 1000 and the learning rate is determined as 0.5. In the SVM algorithm, the RBF function is used as the kernel function. In the kNN algorithm, the k-value is determined as 6.
The generated classification model has been created in Orange program. The model developed in the Orange program is shown in Figure 5.
At the last stage, statistical evaluation criteria have been used to test the effectiveness of the proposed model. At this stage, a number of evaluation methods such as Accuracy Rate, Sensitivity, Specificity and Area under the ROC curve (AUC) have been used.
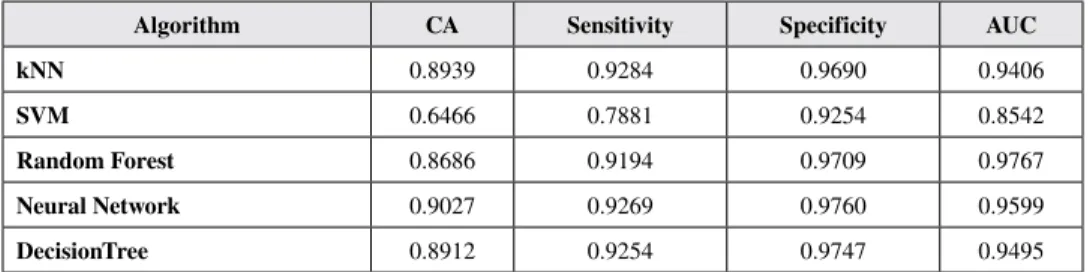
The results obtained by applying the proposed method are presented in Table 2. A comparison of different classification methods is given in the table. When the table is examined, it is seen that the highest accuracy value is obtained with artificial neural networks. After this method, the highest success rate is obtained by the kNN algorithm. The lowest success is achieved by the support vector machines
Figure 5. Orange application of 5 classification methods
Table 2. The results obtained in the Phase of application 1
Algorithm CA Sensitivity Specificity AUC
kNN 0.8939 0.9284 0.9690 0.9406
SVM 0.6466 0.7881 0.9254 0.8542
Random Forest 0.8686 0.9194 0.9709 0.9767
Neural Network 0.9027 0.9269 0.9760 0.9599
algorithm. It is also seen that artificial neural networks generally give better results in other statistical parameters besides the accuracy rate. It is seen that the Random Forest algorithm gives better results only in AUC values.
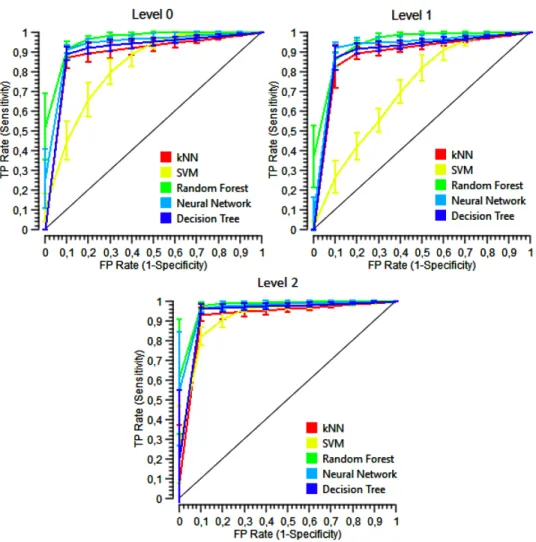
The success of the proposed method has also been assessed with different evaluation criteria. At this stage, ROC curves have been utilized. The ROC curves obtained are presented in Figure 6. When the figure is examined, it is seen that the area value under ROC is the largest with Random Forest (AUC: 0.9767) and artificial neural networks (AUC: 0.9599) for 3 different classes. The worst result has been obtained with SVM method (AUC: 0.8542).
Figure 6.ROC curves
Case Study 2: The Use of Feature Selection Methods
in Estimating the Two-Level HbA1c Value
In this application, a 2-level prediction of HbA1c is aimed. Level classification is performed as follows: If HbA1c is <6.5 then “normal” and if HbA1c≥6.5, “high”. In this application, classification algorithms are compared by applying feature selection algorithms to the cleansed and filtered data. The model established in the Orange program is presented in Figure 7. In addition, the workflow carried out in this application is given in Figure 8. In the model, 4 feature selection algorithms are applied to 5 classification algorithms. The feature selection algorithms used in the study are ReliefF, information gain, gain ratio and chi-square.
By applying the model, the most effective feature sets have been obtained in different experimental results. Results from the most effective 1 feature to 26 features have been tested with five different feature selection algorithms, and the classification results have been recorded.
Figure 7. Implementation of five classification methods with feature selection algorithms
The order of the effective features obtained by different feature selection methods is given in Figure 9. In this figure, the features are scored for each algorithm. For example, according to ReliefF algorithm, the most effective feature is MEDICAL_ NUTRITION_TREATMENT. The least effective feature according to ReliefF algorithm is the REASON_OF_APPLICATION_1. The most effective feature according to information gain algorithm is FASTING_BLOOD_GLUCOSE, and the least effective feature according to same algorithm is GLUKOMETER. The most effective feature according to Gain Ratio algorithm is FASTING_BLOOD_
GLUCOSE and the least effective one is GLUKOMETER. Finally, the most effective feature according to Chi-Square algorithm is FASTING_BLOOD_GLUCOSE and the least effective one is REASON_OF_APPLICATION_2.
Once effective feature sequences have been identified, these features are classified by different classification algorithms. In the first step, the ReliefF algorithm is applied to the feature. Figure 10 displays the classification accuracy rates of the feature clusters identified by the ReliefF algorithm. As can be seen, the highest
Figure 9. Effective feature orders obtained according to different feature selection algorithms
success rate was obtained with the ANN algorithm with an accuracy of 0.9385. This achievement has been obtained by using the first 17 features. The closest result to neural networks is given by the Decision trees algorithm. Moreover, it seems that the decision trees and the CNN algorithm are approaching a higher success rate with fewer features. In general, the lowest success rate has been obtained with the SVM algorithm.
Figure 11 displays the classification accuracy of the feature clusters identified by the information Gain algorithm. As can be seen from the figure, the highest
Figure 10. Classification results of ReliefF feature selection algorithm
success rate has been obtained with the ANN algorithm with an accuracy of 0.9325. This achievement has been obtained by using the first 24features. It is seen that the decision tree algorithm gives the result closest to the neural network. Moreover, it is seen that the decision trees and the KNN algorithms approach to high success rate even with a small number of features. In general, the lowest success rate has been obtained with the SVM algorithm. It is noteworthy that although the kNN algorithm achieves the highest success rate with the first 7 features, the success rate decreases with increasing number of features. After the 22nd feature, the neural network algorithm gave better results than the decision tree.
Figure 12 displays the classification accuracy rates of the feature clusters identified by the Gain Ratio algorithm. When the figure is examined, the ANN algorithm has the highest success rate with an accuracy rate of 0.9345. This achievement has been obtained by using the first 19features. After this algorithm, the best results are obtained with decision trees. In addition, it is seen that the decision trees and the KNN algorithms approach to high success rate even with a small number of features. In general, the lowest success rate has been obtained with the SVM algorithm.
Figure 13 shows the results obtained using the chi-square algorithm. When the figure is examined, the ANN algorithm has the highest success rate of 0.9316. This achievement has been obtained by using the first 17features. The closest competitive algorithm is the decision tree with 16 features and a success rate of 0.9303. Moreover, it is seen that the decision tree algorithm approaches to a higher success rate with less features up to 17. In general, the lowest success rate has been obtained with the SVM algorithm.
Best results obtained by applying all the classification algorithms and all feature selection algorithms are given in Table 3. When the table is examined, the highest accuracy is obtained by the first 17 features obtained by the ReliefF algorithm and the classification of these attributes by the ANN algorithm.
CONCLUSION
The study carried out is generally a clinical decision support system. In this study, predictions have been made for diagnosis and treatment, and tried to help decision-makers with recommendations by using clinical data stack and patient-specific data of diabetes patients especially created by internal medicine specialists.
In the study, a comparison has been made between different algorithms that could be used for the component of inference mechanism which is the brain of the clinical decision support systems.
From the results obtained, it is seen that artificial neural networks generally generate the best result among these classification algorithms. The performance impact of the selected features with the feature selection algorithms is more positive and more favorable than the use of all the features. When studies on the diagnosis of diabetes are examined in the literature, it is seen that many features are used. But, it is seen as an important problem that which features are effective. The study has also a great importance in this respect. It will be an important guide for researchers working on this subject.
Orange data mining software has been introduced in the scope of the study and an application in the field of medicine has been presented.
The developed system can help to the experts in the cases in which it is difficult for physicians to make decisions due to the increased amount of medical data and the number of patients or where multi-directional thinking is necessary. In addition, this system can be very helpful especially for diabetes patients in the early diagnosis warnings, drug recommendations or prevention of mistakes due to negligence.
ACKNOWLEDGMENT
The authors are grateful to Muğla Sıtkı Koçman University Research Projects Coordination Office (BAP- 17/202) for the financial support.
Table 3. The number of features and success rates for the best results obtained
Feature Selection Methods Classification Method No. of Features Classification Accuracy
ReliefF Neural Network 17 0,9385
Information Gain Neural Network 24 0.9325
Gain Ratio Neural Network 19 0,9345
Chi-square Neural Network 17 0,9316
ReliefF Decision Tree 10 0,9285
Information Gain Decision Tree 20 0,9285
Gain Ratio Decision Tree 23 0.9258
Chi-square Decision Tree 16 0,9303
ReliefF kNN 6 0.9041 Information Gain kNN 7 0.9023 Gain Ratio kNN 10 0.9006 Chi-square kNN 6 0.9085 ReliefF SVM 10 0,7691 Information Gain SVM 8 0.7727 Gain Ratio SVM 8 0.7727 Chi-square SVM 9 0.7851
ReliefF Random Forest 25 0.9103
Information Gain Random Forest 20 0.9134
Gain Ratio Random Forest 22 0.9090
REFERENCES
Acharya, U. R., Molinari, F., Sree, S. V., Chattopadhyay, S., Ng, K. H., & Suri, J. S. (2012). Automated diagnosis of epileptic EEG using entropies. Biomedical Signal
Processing and Control, 7(4), 401–408. doi:10.1016/j.bspc.2011.07.007
Afarideh, M., Aryan, Z., Ghajar, A., Noshad, S., Nakhjavani, M., Baber, U., ... Esteghamati, A. (2016). Complex association of serum alanine aminotransferase with the risk of future cardiovascular disease in type 2 diabetes. Atherosclerosis,
254, 42–51. doi:10.1016/j.atherosclerosis.2016.09.009 PMID:27684605
Amato, F., López, A., Peña-Méndez, E. M., Vaňhara, P., Hampl, A., & Havel, J. (2013). Artificial neural networks in medical diagnosis. Academic Press.
Bilous, R., & Donnelly, R. (2010). Handbook of diabetes. John Wiley & Sons. doi:10.1002/9781444391374
Breiman, L. (2001). Random forests. Machine Learning, 45(1), 5–32. doi:10.1023/A:1010933404324
Choubey, D. K., & Paul, S. (2016). Classification techniques for diagnosis of diabetes: A review. International Journal of Biomedical Engineering and Technology, 21(1), 15–39. doi:10.1504/IJBET.2016.076730
Demšar, J., Curk, T., Erjavec, A., Gorup, Č., Hočevar, T., Milutinovič, M., ... Štajdohar, M. (2013). Orange: Data mining toolbox in Python. Journal of Machine
Learning Research, 14(1), 2349–2353.
Durna, Z. (2002). DiyabetinSınıflandırılmasıveTanıKriteleri.İçinde: Edit. Erdoğan S. DiyabetHemşireliğiTemelBilgiler. YüceYayım, İstanbul, 11-21.
Heydari, M., Teimouri, M., Heshmati, Z., & Alavinia, S. M. (2016). Comparison of various classification algorithms in the diagnosis of type 2 diabetes in Iran.
International Journal of Diabetes in Developing Countries, 36(2), 167–173.
doi:10.100713410-015-0374-4
Kononenko, I. (1994). Estimating attributes: analysis and extensions of RELIEF. In European conference on machine learning (pp. 171-182). Springer. 10.1007/3-540-57868-4_57
Leema, N., Nehemiah, H. K., & Kannan, A. (2016). Neural network classifier optimization using differential evolution with global information and back propagation algorithm for clinical datasets. Applied Soft Computing, 49, 834–844. doi:10.1016/j. asoc.2016.08.001
Ling, S. H., San, P. P., & Nguyen, H. T. (2016). Non-invasive hypoglycemia monitoring system using extreme learning machine for Type 1 diabetes. ISA Transactions, 64, 440–446. doi:10.1016/j.isatra.2016.05.008 PMID:27311357
Lopez-de-Andres, A., Hernandez-Barrera, V., Lopez, R., Martin-Junco, P., Jimenez-Trujillo, I., Alvaro-Meca, A., ... Jimenez-Garcia, R. (2016). Predictors of in-hospital mortality following major lower extremity amputations in type 2 diabetic patients using artificial neural networks. BMC Medical Research Methodology, 16(1), 160. doi:10.118612874-016-0265-5 PMID:27876006
Rajesh, K., & Sangeetha, V. (2012). Application of data mining methods and techniques for diabetes diagnosis. International Journal of Engineering and
Innovative Technology, 2(3).
Rau, H. H., Hsu, C. Y., Lin, Y. A., Atique, S., Fuad, A., Wei, L. M., & Hsu, M. H. (2016). Development of a web-based liver cancer prediction model for type II diabetes patients by using an artificial neural network. Computer Methods and Programs in
Biomedicine, 125, 58–65. doi:10.1016/j.cmpb.2015.11.009 PMID:26701199
Soltani, Z., & Jafarian, A. (2016). A New Artificial Neural Networks Approach for Diagnosing Diabetes Disease Type II. International Journal of Advanced Computer
Science and Applications, 7(6), 89–94. doi:10.14569/IJACSA.2016.070611
Wang, C., Li, L., Wang, L., Ping, Z., Flory, M. T., Wang, G., ... Li, W. (2013). Evaluating the risk of type 2 diabetes mellitus using artificial neural network: An effective classification approach. Diabetes Research and Clinical Practice, 100(1), 111–118. doi:10.1016/j.diabres.2013.01.023 PMID:23453177
World Health Organization. (2016). Global report on diabetes. World Health Organization.
Zheng, T., Xie, W., Xu, L., He, X., Zhang, Y., You, M., ... Chen, Y. (2017). A machine learning-based framework to identify type 2 diabetes through electronic health records. International Journal of Medical Informatics, 97, 120–127. doi:10.1016/j. ijmedinf.2016.09.014 PMID:27919371
KEY TERMS AND DEFINITIONS
Classification: It is a kind of supervised machine learning in which an algorithm “learns” to classify novel observations from samples of labeled data.
Diabetes: This is a life-long illness which occurs as a result of lack of insulin hormone or ineffectiveness of insulin hormone.
Feature Selection: This is the process of reducing the inputs for processing and analysis, or of finding the most meaningful inputs.
Hemoglobin A1c: This is a protein on the surface of red blood cells that sugar molecules stick to, usually for the life of the red blood cell (about three months).
Medical Diagnosis: It is a classification operation including the decision-making process based on available medical data.
Orange Data Mining Toolbox: This is an open source data mining toolbox developed for novice and expert.
ROC Curve: It is a graphical method that assesses the success of a binary classifier system.