Muhasebe ve Finansman Dergisi Temmuz 2017 Özel Sayı
1
Analysis of the Relationship Between Municipalities’
Financial Statements And Population In Turkey From 1980
To 2014
Gülistan BAŞCI Eşref Savaş BAŞCI
ABSTRACT
Local administration in Turkey consists of municipality, special provincial administration and villages. When their financial magnitude is taken into consideration, municipalities come first among the local administrations which spend resource expenditure. Financial statements which are prepared by the municipalities are helpful in terms of making decisions for source allocation and evaluation for widespread user groups. Financial statements which are formed with this purpose provide information about financial situations and performance of administration and cash flows. The main purpose of this study is to investigate the relationship between municipalities’ expenses and incomes defined as their budget balances in Turkey and population related rates and if it makes a contribution to this field. We analysed all municipalities’ consolidated financial statements which include revenues and expenses between 1980 and 2014 to explain their financial statements and National Population Growth Rate, Municipal Population/Total Population and Harmonized Gross Domestic Product (as Percentage). There are more relationships between the rates and the financial statements according to literature. We also found the same relationships between municipalities’ expenditures and municipal population/total population with highly coefficient of 5% a statistically significant level. Especially Investment Expenditures have increased according to the increasing rate of the municipal population/total population during the period in Turkey. At the same time there are two important independent variables in revenues for the period which are statistically significant. Taxes and Non-Tax Revenues have increased in the period of analyse related to the increasing rate of the Municipal Population/Total Population. In the last model of relationships between Harmonized Gross Domestic Product and Municipalities’ Financial statements, Current Expenditures variable is highly related to Harmonized Gross Domestic Product in the period.
Keywords: Municipalities, Financial Statements, Budget Balance, Municipal Population/Total Population. Jel Classification: H72, J11, C30.
Belediyelerin Mali Tabloları İle Nüfus Arasındaki İlişkinin Analizi 1980 – 2014 Arası Analiz
ÖZET
Türkiye'de yerel yönetim; belediye, il özel idareleri ve köylerden oluşmaktadır. Mali büyüklükleri göz önüne alındığında, belediyeler kaynak harcamaları dikkate alındığında yerel yönetimler arasında birinci sıraya girmektedir. Belediyeler tarafından hazırlanan mali tablolar, kaynak dağılımı ve yaygın kullanıcı grupları için değerlendirme yapılması açısından yararlı olmaktadır. Bu amaçla oluşturulmuş mali tablolar, finansal durumlar, belediyelerin yönetim ve nakit akışlarının performansı hakkında bilgi sağlamaktadır. Bu çalışmanın temel amacı, Türkiye'de bütçe dengeleri açısından belediye harcamaları ile gelirler arasındaki ilişkiyi incelemek üzere nüfusa ilişkin oranları araştırmak ve bu alana katkıda bulunmaktır. Finansal Tablolarını ve Ulusal Nüfus Büyüme Hızı, Belediye Nüfus / Toplam Nüfus ve Uyumlaştırılmış Gayri Safi Yurtiçi Hasıla (Yüzde olarak) kullanılan bağımlı değişken ile, 1980-2014 yılları arasında gelir ve giderleri içeren tüm belediyelerin konsolide finansal tabloları analiz edilmiştir. Oranlar ile finansal tablolar arasında literatüre göre ilişki olduğu tespit edilmiştir. Belediyelerin harcamaları ile belediye nüfusu / toplam nüfus arasında % 5'lik önem derecesinde istatistiksel olarak anlamlı bir ilişki bulunmuştur. Özellikle yatırım harcamaları, Türkiye'de incelenen dönem boyunca artış olduğu tespit edilmiştir. Cari giderler ile Uyumlaştırılmış Gayri Safi Yurtiçi Hasıla arasında da istatistiki açıdan anlamlı sonuçlar elde edilmiştir.
Anahtar Kelimeler: Belediye, Finansal Tablo, Bütçe Dengesi, Belediye Nüfusu / Toplam Nüfus. JEL Sınıflandırması: H72, J11, C30.
This article was presented as a paper at the IV. International Symposium on Accounting and Finance in Ohrid, Macedonia, July 3-5, 2017.
Lecturer, Hitit University, Vocational School of Social Sciences, Local Government Department, [email protected]
Assist. Prof., Hitit University, Faculty of Economics and Administrative Sciences, Banking and Finance Department, [email protected]
The Journal of Accounting and Finance July 2017 Special Issue
2 1. INTRODUCTION
Public administration is carried out via centralized and local administrations in Turkey (T.R Constitution, 1982: A.126-127). According to the constitution, local administration in Turkey consists of municipality, special provincial administration and villages. When their financial magnitude is taken into consideration, municipalities come first among the local administrations which spend resource expenditure. The municipalities, which have shares transferred by the central administration and revenue items on local basis, spend these resources for the regions in which they are obliged to serve. In this case, it is crucial that municipalities have the financial resources for their expenditures in their region. In turn, this situation contributes to the decentralization in government and active participation of the local people to the management. Financial indigenization is preferred to strengthen the financial autonomy by many countries. Financial indigenization along with incentives from international corporations provide a highly independent avenue for the municipalities to form their own financial resources and realization of decentralized management. (Korlu & Çetinkaya, 2015:96-97).
Turkey has witnessed significant reforms in terms of public administration in the last decade. Constituent regulations are primary in public finance management and local administration legislation. These regulations are Public Finance Management and Control Law (PFMCL) (Official Gazette, 2003) for the law. no. 5018 and Law for Metropolitan Municipality which reprises local administrations (Official Gazette, 2004). Public Finance Management and Control Law (2003, A. 1) were put into practice in 2006 as in centralized administration. It is of utmost importance for centralized administration municipalities, which are out of centralized administration law of budget, are accepted as entities accounting before the public, democratic, transparent, measurable and predictable, and embracing good governance principles.
Financial statements which are prepared by the municipalities are helpful in terms of making decisions for source allocation and evaluation for widespread user groups. Financial statements which are formed with this purpose provide information about financial situation and performance of administration and cash flow. The following information could be gathered from financial statements about public administrations (Türkyener, 2011:52):
Allocation and use of sources,
How activities are financed and need for cash is subsidized,
Ability of financing their activities and responsibilities as well as meeting the requirements,
Changes in their financial situation,
Their success, performance and efficiency in their activities,
How they manage to use their budget in accordance with the budget provided for them in line with the law,
Muhasebe ve Finansman Dergisi Temmuz 2017 Özel Sayı
3
Whether they are transparent and accountable or not.
Budget application results tables of municipalities are financial statements which show budget incomes acquired in certain reporting periods and their budget expenses as well providing detailed financial information about them. Budget application results tables are deduced from budget incomes and outcomes of accounting groups. Set of period transactions are added to the table designed in relation to the whole budget year. Tables are prepared in a way to include the last three years to make a comparison between the periods. (Local Administrations Budget and Accounting, 2016: A.423). Budget final account is the final version inferentially prepared budget at the end of the financial year. In respect to this, matters involving income and outcome budgets of municipalities are included in the budget final account as well. (Sevimli, 1999:51).
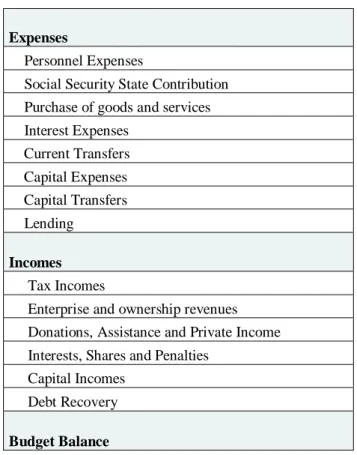
According to the Regulations of Local Administrations Budget and Accounting, Budget Balance Table is as follows:
Table 1. Budget Balance Table of Local Administration
Expenses
Personnel Expenses
Social Security State Contribution Purchase of goods and services Interest Expenses Current Transfers Capital Expenses Capital Transfers Lending Incomes Tax Incomes
Enterprise and ownership revenues Donations, Assistance and Private Income Interests, Shares and Penalties
Capital Incomes Debt Recovery
Budget Balance
Municipality budget shows similarity to program budget system in terms of its application. Classic budget system was replaced by program budget system with the regulation effectuated in 1990. Program budget could be defined as a budget form which tracks whether program budget is carried out in accordance with rational principles, services are executed in a desired and quality manner or not, benefits from functional budget methods and techniques. It is also based on administrative finance accounting and service grouping which gives way to more civilized practices. (Asker & Kılıçoğlu, 1995:195).
The Journal of Accounting and Finance July 2017 Special Issue
4
The main purpose of this study is to investigate the relationship between municipalities’ expenses and incomes defined as their budget balances in Turkey and population related rates and if it makes a contribution to this field. The first caution to take in case of economic problems is to reduce public expenses in Turkey. However, saving in public expenses policies involve superficial cautions in general. Whether they benefit from scale economies in public service provision or not will be a significant policy as it involves the whole public sector.
The need for borrowing for the public sector and local administrations are shown in the chart below. Although the expense shares in GDP vary compared to the previous years, especially shares of local administrations show similarity.
Graph 1. Public Sector Borrowing Requirement With Respect to Budget Types (Share in Gdp)
In other words, the expenses of municipalities, which consist of an important constituent of the public, have risen recently, but as this rise is compared with general budget expenses, it does not seem to be very high.
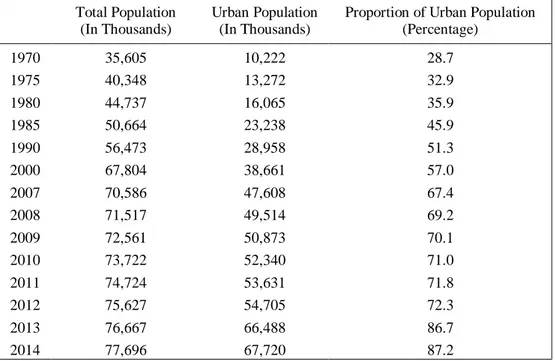
There are various reasons for the increase in public expenses in Turkey. With regards to the main object of the current study, increase in population and rapid urbanization are among the most important reasons. As can be seen in Table 2, while the total share of the population living in the urban area in the1970s is 28.7 %, this rate has reached 87.2 % in 2014. As an expected result of the increase in population living in the urban area, the responsibilities of local administrations increase and so do their number of services.
Muhasebe ve Finansman Dergisi Temmuz 2017 Özel Sayı
5
Table 2. Urban Population
Total Population (In Thousands)
Urban Population (In Thousands)
Proportion of Urban Population (Percentage) 1970 35,605 10,222 28.7 1975 40,348 13,272 32.9 1980 44,737 16,065 35.9 1985 50,664 23,238 45.9 1990 56,473 28,958 51.3 2000 67,804 38,661 57.0 2007 70,586 47,608 67.4 2008 71,517 49,514 69.2 2009 72,561 50,873 70.1 2010 73,722 52,340 71.0 2011 74,724 53,631 71.8 2012 75,627 54,705 72.3 2013 76,667 66,488 86.7 2014 77,696 67,720 87.2
Source: Turkstat, Ministry of Development
Besides the increase in urbanized population, an increase was observed in the number of municipalities. When the number of cities and counties in administrative division is taken into account, the number of cities gradually increased from 67 to 81 starting from the 1980s. In 1989 Aksaray, Bayburt, Karaman and Kırıkkale; in 1990 Batman and Şırnak; in 1991 Bartın; in 1992 Ardahan and Iğdır; in 1995 Yalova, Karabük and Kilis; in 1996 Osmaniye were announced as cities. Therefore, the number of cities were completed as 80. With Düzce’s being a city in December 1999, it became 81 in number in present day (Turkish Statistical Institute).
As a result of the increased number of administrative entities (city and county) in public administration and municipalities and reconstruction of metropolitan areas, there is a need for minimization of cost of unit in public services, ‘optimal’ reconstruction of public management in order to benefit from scale economies. The effect of population increase and change in population structure on public expenses is expected. Yet, there are not any theoretical predictions concerning the relationship between the population increase and public expenses per capita in the direction positive or negative. (Ladd, 1994:661). If the public expenses decrease as the population increases, this is an indicator of benefiting from scale economy of public sector. If public expenses per capita increase as the population increases it is a matter of decreasing premium of the scale. (Sağbaş, 2003:2).
Different from the private sector, there are some arguments for public sector’s benefiting from scale economies in relation to the population. Economies of scope, accumulation in the use of public commodities and centralization are the reasons for benefiting from population scale economies. Decentralization, not following the new technologies and over employment are possible reasons for decreasing premium of the scale in public sector.
States are obliged to provide complete public and semi-public services due to the failure of market in providing these services. The states continue to provide these
The Journal of Accounting and Finance July 2017 Special Issue
6
services to them even if they do not benefit from scale economies or make a loss. However in the private sector, if the firm’s marginal cost in production is less than the average cost, it will keep on procuring in case of increase in production quantity (Sağbaş, 2004:172).
2. LITERATURE REVIEW
Sağbaş (2004) could not find any significant relationship between budget expenses and population between the years of 1990-2000. However, the author concluded that as the population increased, transfer expense per capita (scale’s decreasing premium) increased as well. A strong and positive relationship between municipality expenses per capita and population was found in the study as well. It was also claimed that this result was not only an indicator of scale’s decreasing premium, but also there were not any population scale economies in the public expenses of Turkey in general.
Göçer (2015) determined in his analysis on financial statements of municipalities between the years of 2008 and 2012 that the main reason for the decrease in long-term assets was due to the decrease in lands and parcels and accumulated depreciation. As the incomes section of budget application results table was examined, the highest income share fell on interest incomes, shares acquired from persons and organizations and other incomes from cash fines and taxes on land charges, goods and service taxes within fees. He also found that as the outcome sections of budget application was examined, the highest outcome share fell on goods and services, and purchase of capital; and as the change in budget outcomes were investigated; the outcomes of social security institution contribution, purchase of goods and services increased compared to the previous years.
R.K. Korlu and Ö. Çetinkaya (2015) determined that the taxes collected by the local administrations in Denmark and Sweden were approximately 16% within their GPD. They also stated that this rate was higher in countries, such as Canada and Switzerland. On the other hand, in countries such as Czech Republic, Ireland, Greece and Turkey the incomes of local administrations were observed to be low in their GPD and their self-tax income was low along with it.
Bülbül (2013) stated in his study that the magnitude of municipalities in budget increased from 6% to 14% from the 1980s up to the 2000s, these rates for provincial special administrations tended to increase from 1% to 4%. Taken as municipality and provincial special administrations as a whole, the volume of local administrations in the general budget has risen from 7% to 8% from 1980 to present day. On the other hand, it was claimed that the magnitude of local administrations in state budget has been kept low due to the “over centralization” approach. Shares transferred from general budget in municipality budget in Turkey were within 47-51% between the years 1985-2010, between 22–31% for budgets of provincial special administrations. In other countries like Portugal this rate was 49%, 53% in England, 63% in Greece, 73% in Russia, 83% in Holland. Also, it was higher than the average for Turkey which was 49%. In the 1990s, municipality incomes consisted of self-incomes between 44–53% and 45–54% shares from the central and 2-6% assistance and fund transfer.
Muhasebe ve Finansman Dergisi Temmuz 2017 Özel Sayı
7
Koyuncu (2012) determined an increase in local administrations’ (municipality and provincial special administrations) rate of shares acquired from centralized administrative tax incomes (general budget tax incomes) within their own budget incomes and in GPD in the last 2007 and 2011 periods. The author also found out that local administrations were bound to the resources transferred by the center and 47% of their budget incomes consist of donation and assistance retrieved from centralized administration budget.
3. METHODOLOGY
To determine the relationships between municipalities’ financial statements and National Population Growth Rate, Municipal Population/Total Population and Harmonized Gross Domestic Product (as Percentage), we used all municipalities’ consolidated financial statements which include revenues and expenses between 1980 and 2014. There are a total of 67 cities in 1980, and a total of 81 cities in 2014. All data from them are collected from the Republic of Turkey Ministry of Development, the Turkish Statistical Institute and the Republic of Turkey Ministry of Finance databases. We used fiscal tables related to municipalities during the period. The fiscal tables include two important parts like Revenues and Expenditures as consolidated in one year.
Revenues are classified as four main accounts. They are taxes, non-tax revenues, factor income and capital transfers. Revenues accounts are related to municipalities’ incomes in the year. Expenditure are classified as five main accounts. They are current expenditures, investment expenditures, current transfers, expropriation and increase in fixed assets and capital transfers (net). These accounts are also related to the municipalities’ expenditures in the year as a consolidated bases.
We used analyse of 3 different dependent variables which are Natural Population Growth Rate, Municipal Population/Total Population and Harmonized Gross Domestic Product (as Percentage). We also calculated growth ratio for each dependent variables. On the other hand, this growth ratio calculated as a percent of growth of each variables from first to next year during the period. Our aim is to determine the relationships between municipalities’ financial statements and each rates in Turkey between 1980 and 2014.
We assumed that our main hypothesis is statistically significant pertaining to the relations between municipalities’ financial statements and each dependent variables. Because of municipalities have to service the public, and they may have taxes and other related revenues from their services. They may also have expenditures related to services. All municipalities have to service all people and the public as well. Amount of people who live in the municipalities’ service area are important. It means more services, more revenues and more expenditures. We analysed in this study that if there is any relations between each growth rate and revenues and expenditures.
Initially, we have obtained all data from 1975 to 2014. But we have decided to use the sample size from 1980 to 2014. Firstly we have calculated all main accounts from the financial statements in terms of growth rate shown below;
The Journal of Accounting and Finance July 2017 Special Issue
8
GRt: Growth Ratio of item of Financial Table in t year
Value t: Value of account of Financial Table in t year
Value t-1: Value of account of Financial Table in t-1 year
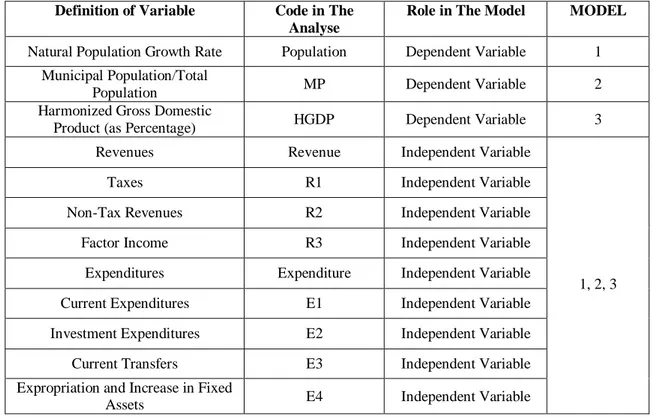
All main accounts in the financial statements were calculated for growth ratios during the period. In this study we have one dependent variables and more independent variables are shown in the Table 3 below.
Table 3. All Variables and Explanations
Definition of Variable Code in The
Analyse
Role in The Model MODEL
Natural Population Growth Rate Population Dependent Variable 1 Municipal Population/Total
Population MP Dependent Variable 2 Harmonized Gross Domestic
Product (as Percentage) HGDP Dependent Variable 3 Revenues Revenue Independent Variable
1, 2, 3 Taxes R1 Independent Variable
Non-Tax Revenues R2 Independent Variable Factor Income R3 Independent Variable Expenditures Expenditure Independent Variable Current Expenditures E1 Independent Variable Investment Expenditures E2 Independent Variable Current Transfers E3 Independent Variable Expropriation and Increase in Fixed
Assets E4 Independent Variable
All variables we used in analyse multiple regression with Least Square estimator. For analyse, we have preferred Eviews 8 version to calculate multiple regression. We have a total of 3 models on the relationships between the fiscal tables of municipalities and model dependent variables.
Model 1: The Relationships between Natural Population Growth Rate and Municipalities’ Financial Statements
We assumed that Model 1 is a statistically significant Natural Population Growth and Municipalities’ Financial Statements in multiple regression analyse. Population is the first important key for municipalities in our model. Because, municipalities have to service all of the public. Therefore they need to plan for future investments according to
Muhasebe ve Finansman Dergisi Temmuz 2017 Özel Sayı
9
the population of the cities. In the model, natural population growth rate is determined as a dependent variables, and all main accounts of consolidated financial statements of the municipalities are determined as an independent variables.
Model 1 Equation includes 3 sub models as follows. Sub Modela means whole
model of main accounts of the financial statements of the municipalities. Sub Modelb
means function of revenues of the financial statements of municipalities. And Sub Modelc means function of expenditures of the financial statements of municipalities.
Model 2: The Relationships between Municipal Population/Total Population and Municipalities’ Financial Statements
We assumed that Model 2 is a statistically significant Municipal Population/Total Population and Municipalities’ Financial statements in multiple regression analyse. A percentage of Municipal Population of the Total Population is the second important key for municipalities in our model. Because, municipalities have to service all of the municipal area due to law. It means, municipalities have to service all municipal edges in the cities. In the model, rate of municipal population of the total population is determined as dependent variables, and all main accounts of consolidated financial statements of the municipalities are determined as an independent variables.
Model 2 Equation includes 3 sub models as follows. Sub Modela means
whole model of main accounts of the financial statements of the municipalities. Sub Modelb means function of revenues of the financial statements of municipalities. And
Sub Modelc means function of expenditures of the financial statements of
municipalities.
Model 3: The Relationships between Harmonized Gross Domestic Product and Municipalities’ Financial Statements
We assumed that Model 3 is a statistically significant Harmonized Gross Domestic Product (as percentage) and Municipalities’ Financial statements in multiple regression analyse. A percentage of Harmonized Gross Domestic Product is the third important key for municipalities in our model. Because, gross domestic product may be calculated from all revenues from all people who lives in all cities. It means, municipalities have to contribute to gross domestic product in terms of municipal way. In the model, rate of harmonized gross domestic product is determined as dependent
The Journal of Accounting and Finance July 2017 Special Issue
10
variables, and all main accounts of consolidated financial statements of the municipalities are determined as an independent variables.
Model 3 Equation include 3 sub models as follows. Sub Modela means whole
model of main accounts of the financial statements of the municipalities. Sub Modelb
means function of revenues of the financial statements of municipalities. And Sub Modelc means function of expenditures of the financial statements of municipalities.
Graph 2. Variables in The Models
Before starting the regression analyse, we need to determine all variables’ stationary level. For this purpose, we analysed each series’ stationary level via vary unit root tests.
All variables must be in a stationary level to predict the multiple regression model. There are five steps of multiple regression analyse with the Least Squares (Mason & Perreault, 1991) (Green, 1991) (Olivia &Ilie, 2013)
1. Multicollinearity
2. Normality
3. Autocorrelation
4. Heteroscedasticity
Muhasebe ve Finansman Dergisi Temmuz 2017 Özel Sayı
11 Multicollinearity:
Highly correlated predictor variables do not damage the prediction but they do have an impact on the parameter estimates of the regression models. Due to multicollinearity, variables can have statistically insignificant coefficients though there is a relation between the dependent and the set of independent ones. It can also lead to parameter estimates with opposite signs than expected from theory or reality. When predictor variables are added or removed there are important changes in the estimated parameters. When predictor variables are highly correlated, the interpretation of the regression parameters is affected. The usual interpretation is that an increase by one unit of a parameter when holding the others constant leads to a change of the expected value of the dependant variable does not apply in the presence of multicollinearity. The widely used method in multicollinearity detection is the Variance Inflation Factor. A large value of VIF is used as an indicator of a severe multicollinearity.
Normality:
The values in the sample may form from normal distribution. Indeed, residual has to form from normal distribution. We analysed this with the Normality test in Eviews by using Jarque-Bera Test statistics. Result of residuals must be normal distribution in terms of the Jarque–Bera test which is a goodness-of-fit test of whether sample data have the skewness and kurtosis matching a normal distribution.
Autocorrelation:
Autocorrelation is a kind of serial correlation which is a signal with a delayed copy of itself as a function of the delay. When the autocorrelation function is normalized by mean and variance, it is sometimes referred to as the autocorrelation coefficient or autocovariance function of analyse.
Heteroscedasticity:
One of the key assumptions of regression is that the variance of the errors is constant across observations. If the errors have constant variance, the errors are called homoscedastic. Typically, residuals are plotted to assess this assumption. Standard estimation methods are inefficient when the errors are heteroscedastic or have non-constant variance. The existence of heteroscedasticity is a major concern in the application of regression analysis, including the analysis of variance, as it can invalidate statistical tests of significance that assume that the modelling errors are uncorrelated and uniform—hence that their variances do not vary with the effects being modelled.
White test is the most general test for heteroscedasticity. In cases where the White test statistic is statistically significant, heteroscedasticity may not necessarily be the cause; instead the problem could be a specification error. In other words, the White test can be a test of heteroscedasticity or specification error or both.
The Journal of Accounting and Finance July 2017 Special Issue
12 Mean of Residuals:
The last assumption in the multiple regression model is the mean of residuals. In analyse each data point has one residual. Both the sum and mean of the residuals are equal to zero.
4. FINDINGS
In this analyse, we have started with the stationary test for all variables. We used several unit root test like Levin, Lin & Chu (2002), ADF (1979) and PP (1988) to determine stationary level of them. According to the analyse we found all series have unit roots, therefore we rejected null hypothesis and made the first difference of all series to eliminate unit root.
Table 4. Group Unit Root Tests with First Differences
Cross-
Method Statistic Prob.** sections Obs
Null: Unit root (assumes common unit root process)
Levin, Lin & Chu t* -25.3527 0.0000 15 523
Null: Unit root (assumes individual unit root process)
ADF - Fisher Chi-square 800.707 0.0000 15 523 PP - Fisher Chi-square 1917.23 0.0000 15 525
** Probabilities for Fisher tests are computed using an asymptotic Chi -square distribution. All other tests assume asymptotic normality.
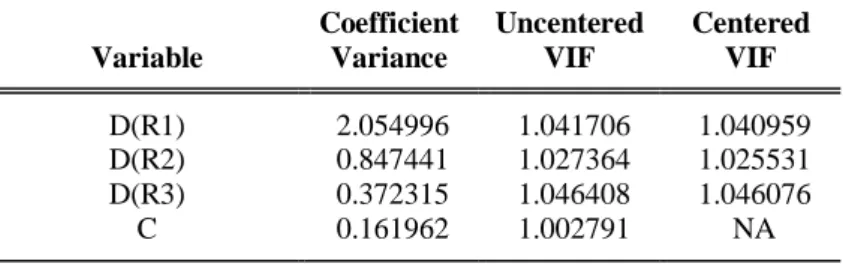
When we run all models explained in the methodology section of this paper we have started the multicollinearity test among all models. It seems that regression analyse of MPb model is statistically accepted in analyse. For this purpose we calculated Variance Inflation Factors to the model.
Table 5. Multicollinearity Test Result of the MPb Model Coefficient Uncentered Centered
Variable Variance VIF VIF
D(R1) 2.054996 1.041706 1.040959 D(R2) 0.847441 1.027364 1.025531 D(R3) 0.372315 1.046408 1.046076
C 0.161962 1.002791 NA
Due to Table 5, there are no multicollinearity problem between variables in the model. The next step is normal distribution assumption of the residual in the model. As a goodness-of-fit test Jarque-Bera calculates residual whether it has normal distribution or not. Result of the Normality assumption model’s residual has normal distribution according to the Histogram Normality test for Jarque-Bera Test.
Muhasebe ve Finansman Dergisi Temmuz 2017 Özel Sayı
13
Table 6. Breusch-Godfrey Serial Correlation LM Test Result
F-statistic 0.600997 Prob. F(5,26) 0.6996 Obs*R-squared 3.626084 Prob. Chi-Square(5) 0.6044
In autocorrelation assumption, we tested serial correlation LM test with Breusch-Godfrey for the model’s residual. According to result there is no autocorrelation in residual. The next step of the multiple regression analyse is heteroscedasticity. It means specification error of variance in the model.
Table 7. Heteroscedasticity Test: White Test Result
F-statistic 1.556501 Prob. F(9,25) 0.1830 Obs*R-squared 12.56899 Prob. Chi-Square(9) 0.1831
According to White test there is no heteroscedasticity problem in residual. The last step of the multiple regression analyse is mean of residual must be equal to zero. Result of the residual’s descriptive statistics mean equals to zero.
In Model 1, we analysed the relationships between Natural Population Growth Rate and municipalities’ Financial statements in regression steps, but all results are rejected for a result of the statistical significant. This is related with the literature. Sağbaş (2004) claimed that result were not only an indicator of scale’s decreasing premium, but also there were not any population scale economies in the public expenses of Turkey in general.
The Journal of Accounting and Finance July 2017 Special Issue
14
Table 8. Econometric Results of Model 2
Model 2 : MP
The Relationships between Municipal Population/Total Population and Municipalities’ Financial Statements
Independent Variables 𝑀𝑃𝑎 = 𝛽0 + 𝛽1𝑅𝑒𝑣𝑒𝑛𝑢𝑒𝑖𝑡 + 𝛽2𝐸𝑥𝑝𝑒𝑛𝑑𝑖𝑡𝑢𝑟𝑒𝑖𝑡 + 𝜀𝑖𝑡 𝑀𝑃𝑏 = 𝛽0+ 𝛽1𝑅1𝑖𝑡 + 𝛽2𝑅2𝑖𝑡 + 𝛽3𝑅3𝑖𝑡 + 𝜀𝑖𝑡 𝑀𝑃𝑐 = 𝛽0+ 𝛽1𝐸1𝑖𝑡 + 𝛽2𝐸2𝑖𝑡 + 𝛽3𝐸3𝑖𝑡 + 𝛽4𝐸4𝑖𝑡 + 𝜀𝑖𝑡 Revenues -0.243928 (0.9229) Taxes (R1) 2.444193 (0.0982)* Non-Tax Revenues (R2) 2.192128 (0.0236)** Factor Income (R3) 0.280739 (0.6487) Expenditures 4.704174 (0.0104)**
Current Expenditures (E1) 1.106178
(0.4909) Investment Expenditures
(E2)
2.693641 (0.0116)**
Current Transfers (E3) -0.023058
(0.9629) Expropriation and Increase in
Fixed Assets (E4)
0.166798 (0.4126) 𝜀𝑖𝑡 1.097009 (0.0080)*** 1.106507 (0.0099) 1.094039 (0.0094)*** R2 0.2587 0.2219 0.2778 F-Stat 0.008*** 0.048** 0.039**
All results in first line represent Coefficients and Significant of the variables in second line between parentheses. *, ** and *** respectively refers to 10%, 5% and 1% in statistically significant level.
Muhasebe ve Finansman Dergisi Temmuz 2017 Özel Sayı
15
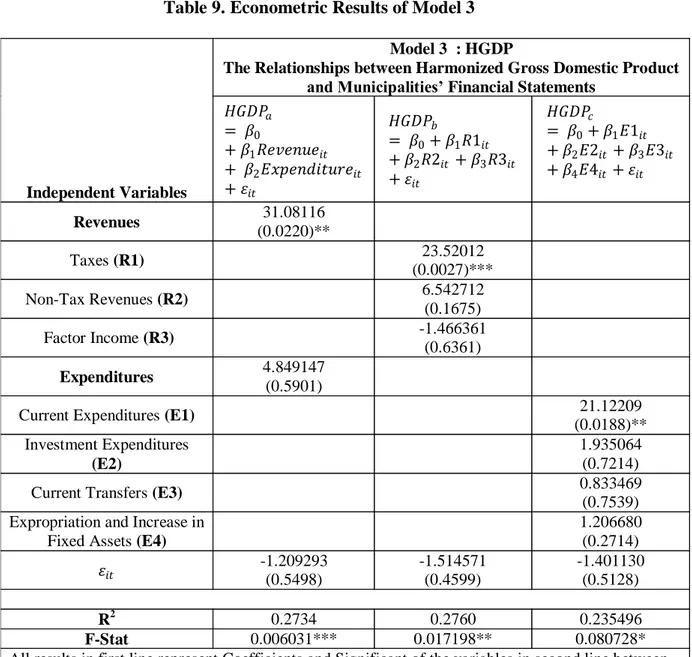
Table 9. Econometric Results of Model 3
Model 3 : HGDP
The Relationships between Harmonized Gross Domestic Product and Municipalities’ Financial Statements
Independent Variables 𝐻𝐺𝐷𝑃𝑎 = 𝛽0 + 𝛽1𝑅𝑒𝑣𝑒𝑛𝑢𝑒𝑖𝑡 + 𝛽2𝐸𝑥𝑝𝑒𝑛𝑑𝑖𝑡𝑢𝑟𝑒𝑖𝑡 + 𝜀𝑖𝑡 𝐻𝐺𝐷𝑃𝑏 = 𝛽0+ 𝛽1𝑅1𝑖𝑡 + 𝛽2𝑅2𝑖𝑡 + 𝛽3𝑅3𝑖𝑡 + 𝜀𝑖𝑡 𝐻𝐺𝐷𝑃𝑐 = 𝛽0+ 𝛽1𝐸1𝑖𝑡 + 𝛽2𝐸2𝑖𝑡 + 𝛽3𝐸3𝑖𝑡 + 𝛽4𝐸4𝑖𝑡 + 𝜀𝑖𝑡 Revenues 31.08116 (0.0220)** Taxes (R1) 23.52012 (0.0027)*** Non-Tax Revenues (R2) 6.542712 (0.1675) Factor Income (R3) -1.466361 (0.6361) Expenditures 4.849147 (0.5901)
Current Expenditures (E1) 21.12209
(0.0188)** Investment Expenditures
(E2)
1.935064 (0.7214)
Current Transfers (E3) 0.833469
(0.7539) Expropriation and Increase in
Fixed Assets (E4)
1.206680 (0.2714)
𝜀𝑖𝑡 -1.209293 (0.5498) -1.514571 (0.4599) -1.401130 (0.5128)
R2 0.2734 0.2760 0.235496
F-Stat 0.006031*** 0.017198** 0.080728*
All results in first line represent Coefficients and Significant of the variables in second line between parentheses. *, ** and *** respectively refers to 10%, 5% and 1% in statistically significant level.
5. RESULT AND CONLUSION
We analysed all municipalities’ consolidated financial statements which include revenues and expenses between 1980 and 2014 to explain their financial statements and National Population Growth Rate, Municipal Population/Total Population and Harmonized Gross Domestic Product (as Percentage). There are more relationships between the rates and the financial statements according to literature. Sağbaş (2004), a strong and positive relationship between municipality expenses per capita and population was found in his study. We also found the same relationships between municipalities’ expenditures and municipal population/total population with highly coefficient of 5% a statistically significant level. Especially Investment Expenditures has increased according to rate of increasing of municipal population/total population
The Journal of Accounting and Finance July 2017 Special Issue
16
during the period in Turkey. At the same time there are two important independent variables in revenues for the period is statistically significant. Taxes and Non-Tax Revenues have increased in the period of analyse related to increasing rate of the Municipal Population/Total Population.
In the relationships between Harmonized Gross Domestic Product and Municipalities’ Financial statements, we found highly efficient variables in the analyse. Especially, changing rate of gross domestic product in the period was effected in the Revenues or vice versa in the first model. It is also related to Taxes in the second model. In the last model of relationships between Harmonized Gross Domestic Product and Municipalities’ Financial statements, Current Expenditures variable is highly related to Harmonized Gross Domestic Product in the period. Our result is the same with the literature, especially Koyuncu (2012) work. He determined an increase in local administrations’ rate of shares acquired from centralized administrative tax incomes within their own budget incomes and in GPD in the last 2007 and 2011 periods.
REFERENCES
Asker, A. E., Kılıçoğlu, A.Y. (1995), Belediye Bütçe ve Muhasebe Sistemi, Ankara, 1995, s. 195
Dickey, D. A. and Fuller, W. A. 1979. “Distribution of the Estimators for Autoregressive Time Series With a Unit Root”. Journal of the American Statistical Association, 74: 427–431.
Green, S. B. (1991). How Many Subjects Does It Take To Do A Regression Analysis.
Multivariate Behavioral Research, 26(3), 499–510.
doi:10.1207/s15327906mbr2603_7
Korlu, R. K., & Çetinkaya, Ö. (2015). Türkiye’deki Belediyelerin Mali Özerkliğinin Öz Gelirler Bağlamında Analizi ve Değerlendirilmesi. Siyaset, Ekonomi ve Yönetim Araştırmaları Dergisi, 3(4).
Ladd, H.F. (1994), Fiscal Impacts of Local Population Growth: A Conceptual and Empirical Analysis, Regional Science and Urban Economics, 24, pp.661-686 Levin, A., Lin, C. F., & Chu, C. S. J. (2002). Unit root tests in panel data: asymptotic
and finite-sample properties. Journal of econometrics, 108(1), 1-24.
Mahalli İdareler Bütçe ve Muhasebe Yönetmeliği (2016), 27/05/2016 Tarih ve Sayı: 29724 (Mükerrer)
Mason, C., & Perreault, W. (1991). Collinearity, Power, and Interpretation of Multiple Regression Analysis. Journal of Marketing Research, 28(3), 268-280. doi:10.2307/3172863
Olivia, B., & Ilie, P. (2013). A model to minimize multicollinearity effects. Annals of the University of Oradea, Economic Science Series, 22(1), 699-706.
Muhasebe ve Finansman Dergisi Temmuz 2017 Özel Sayı
17
Phillips, P. C., & Perron, P. (1988). Testing for a unit root in time series regression. Biometrika, 335-346.
Resmi Gazete (2003), Kamu Mali Yönetimi ve Kontrol Kanunu, 24/12/2003 Tarih ve Sayı: 25326 Resmi Gazete
Resmi Gazete (2004), Büyükşehir Belediyesi Kanunu, 23/7/2004 Tarih ve Sayı: 25531 Resmi Gazete
Resmi Gazete (2005), Belediye Kanunu, 13/7/2005 Tarih ve Sayı: 25874
Sağbaş, İ. (2003). Türkiye’de Yerel Yönetim Harcamaları ve Ölçek Ekonomileri’. Maliye Dergisi, 143.
Sağbaş, İ. (2004). Kamu Harcamaları Nüfus Ölçek Ekonomileri İlişkisi: Türkiye Üzerine Ampirik Bir Çalışma. Maliye Dergisi, Kentsel Ekonomik Araştırmalar Sempozyumu, Cilt II, Mart, s.166-184
Sevimli, A. (1999), “Belediye Bütçe ve Muhasebe Sistemi”, Sayıştay Dergisi, Sayı: 35, Ekim-Aralık 1999, ss. 38-57.
Türkyener, C. Mustafa (2011), “Belediyelerde Mali Raporlama ve Mali Analize İlişkin Temel Sorunlar”, Dış Denetim, Nisan-Mayıs-Haziran, Sayı: 4, ss. 47-58.
White, H. (1980). "A Heteroscedasticity-Consistent Covariance Matrix Estimator and a Direct Test for Heteroscedasticity". Econometrica. 48 (4): 817–838.