The Adaptation of Self-Directed Mathematics Learning Attitude
Scale into Turkish
Özyönelimli Matematik Öğrenme Tutum Ölçeği’nin Türkçeye
Uyarlanması
Seher MANDACI ŞAHİN
*Niğde University
Abstract
The aim of this study is to adapt the “Self-Directed Mathematics Learning Attitude Scale”, developed by Lee and Kim (2005) into Turkish and to demonstrate the validity and reliability of the scale. The study group consisted of 3485 students from 7th and 8th grades who are attending to 24 elementary schools in Niğde city center. Even though the original version of the scale had three main dimensions, ten Self Directed Learning (SDL) factors and 57 items; the adapted form consists of three main dimensions, six SDL factors and 46 items. Consequently, the scale is shown to be valid and reliable and it is thought that the main reasons behind this change were intercultural differences between countries and varying perceptions in learning environments and education systems.
Keywords: Metacognition, self-directed learning, mathematics learning, attitude, adaptation Öz
Bu çalışmanın amacı Lee ve Kim (2005) tarafından geliştirilmiş olan “Özyönelimli Matematik Öğrenme Tutum Ölçeği”nin Türkçeye uyarlamasını yapmak, ölçeğin geçerlilik ve güvenilirliğini ortaya koymaktır. Çalışma grubunu, Niğde il merkezine bağlı 24 ilköğretim okulunun 7. ve 8. sınıflarında öğrenim gören 3485 öğrenci oluşturmaktadır. Üç ana boyutlu, 10 SDL faktörlü, 57 maddelik ölçeğin Türkçe uyarlaması üç ana boyut, altı SDL faktörü ve 46 maddeden oluşmaktadır. Sonuç olarak, geçerlik ve güvenilirliği ortaya konmuş olan ölçekteki bu değişimde ülkeler arası kültür farkı ve eğitim ortamları ile eğitim sistemlerindeki değişik algılamaların rol oynadığı düşünülmektedir.
Anahtar Sözcükler: Üstbiliş, özyönelimli öğrenme, matematik öğrenme, tutum, uyarlama.
Introduction
Mathematics is a dynamic system that improves comprehension, as a field that enhances advanced behaviours and skills necessary for everyone in every field of daily life such as analyzing, reasoning, communicating, generalizing, and creative and independent thinking. Mathematics has a significant place in human life and importance in social and global development. However, mathematics, which is one of the essential elements of everyday life and education systems, is still seen by many people as a field that is difficult to learn, boring and even terrifying. It is a known fact that the most common problem of many people related to mathematics is that they are “unable to understand” it. However, the main problem here is the lack of knowledge about how to learn mathematics. It is a fact that mathematics learning cannot be limited to schools and
* Seher MANDACI ŞAHİN, Nigde University Faculty of Education Department of Mathematics Education, e-mail: [email protected]
learning environments since it is closely related to every aspect of human life. Therefore, it is of importance for an individual to be aware of his/her own capacities in terms of learning and to develop her self-direction skills. For this reason, in a quality learning environment, the student should be able to learn how to learn, how to remember and how to effectively control and direct her own learning (Loyens et al., 2008; Çakıroğlu, 2007: p. 21; Mandacı Şahin, 2007: p. 2; Reio, 2004: p. 19; Lucangeli and Cornoldi, 1997: p. 121).
The number of studies that focus on learning environments and teaching methods in which metacognitive learning strategies are employed and on degrees to which individuals use their metacognitive skills is on the rise in recent years. It is observed that metacognition is addressed in the literature around two main skills: self-evaluation and self-direction. While the former comprises the student’s evaluation of her own knowledge and skills, the latter includes her awareness about herself and the process and monitoring this process (Çakıroğlu, 2007, p. 25).
Self-directed learning (SDL) is, according to Knowles (1975) (as quoted by Fisher et al., 2001: p. 516), who is among the prominent researchers in the field and who provided the most widespread definition of the concept; “a process by which individuals take the initiative, with or without the assistance of others, in diagnosing their learning needs, formulating learning goals, identifying human and material resources for learning, choosing and implementing appropriate learning strategies, and evaluating learning outcomes.
SDL is in fact a teaching method frequently used in adult education. It can be defined most generally as “the level of one’s awareness of her own learning”. Self-directed learners maintain the control and have the freedom to define what is more important to learn for themselves. The level of one’s control over her learning depends on her attitudes, skills and cognitive skills. The state of readiness for SDL develops within a process and every individual has it to varying degrees. The literature shows that designing learning environments based on SDL presence creates the opportunity to attain best learning.
Two points need to be clarified while defining SDL. First is the fact that SDL is a new learning method or process; and second, personal characteristics which will emerge as outcomes of SDL and the necessity of which is incontestable.
Knowles divides learning process into two poles: pedagogical (directed by a teacher or some other external source) and andragogical (self-directed) learning. Knowles suggests that teacher-directed learners depend on the teacher in defining learning needs, setting targets, planning learning activities and evaluating learning. On the other hand, self-directed learners satisfy their own learning needs. In short, these two poles differ from each other with respect to an individual’s control over her learning, and her freedom to evaluate her learning needs and to achieve her learning goals (Fisher et al., 2001: p. 518).
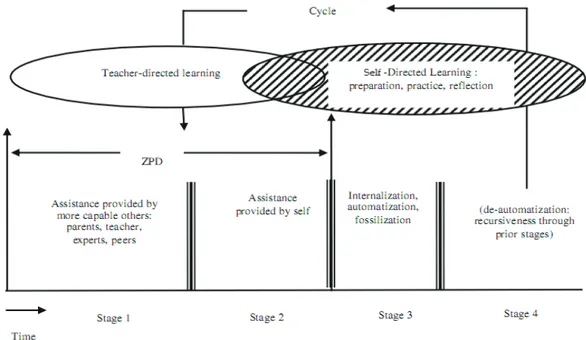
SDL, which was initially adopted only in adult education, lifelong learning projects and continuing education centers, is today addressed beginning almost from preschool education. Therefore, it is possible to find studies that discuss SDL within the frameworks of different theories. In some of these studies, it is suggested that everybody performs SDL at every age to varying degrees and thus SDL is related to Vygotsky’s concept of ZPD (Zone of Proximal Development) (Hoban and Hoban, 2004: p. 19; Brockette et al., 2000: p. 3). For, SDL development in the individual is similar to Vygotsky’s concept of ZPD, which asserts that the learning process develops from the social to the individual level. According to this approach, students imitate their teachers or peers with higher skills until they develop their own problem solving skills. At this point, SDL might be regarded as the process of decreasing the level of trust in others, that is, the process of individualizing learning. Lee and Kim (2005) provided a definition of SDL, as shown in Figure 1, based on Vygotsky’s ZPD model.
Figure 1. Definiton of SDL based on ZPD model
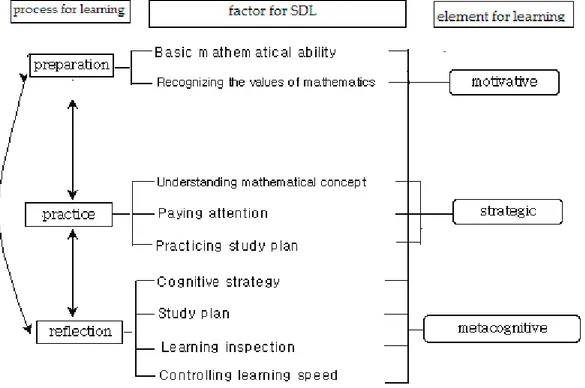
Researchers who view the SDL based on the ZPD model in this way developed an assessment instrument aimed at unfolding this skill, according to which SDL occurs in three phases: Preparation, Practice and Reflection. Researchers explained SDL through ten factors that reveal the presence of these phases, and they divided these factors into three learning elements: motivative, strategic and metacognitive (Lee & Kim, 2005: p. 259; Kim & Kim, 2010: p. 111). This assessment instrument, which received its current form after necessary analyses, is valid and reliable in assessing students’ SDL attitudes towards Mathematics.
There exist numerous assessment instruments in the literature aimed at measuring SDL presence and, more generally, metacognitive skills (Karakelle & Saraç, 2007: p. 90). However, the feature of Self Directed Mathematics Learning Attitude Scale (SDMLAS) that increases its importance in the literature is that it is designed to measure the qualifications specific to the field and relate them to attitudes. It is not realistic to believe that an individual might present the same level of SDL presence, shown by her at a certain point, in a new and unfamiliar case. This of course does not mean that certain skills and personal characteristics are not transferable. However, an individual should have a certain degree of knowledge in a field for her to show SDL in that field. For example, an individual who demonstrates high-level of SDL presence in Math might not do the same in English. Therefore, SDL presence should be measured in particular fields. It would thus be easier to relate SDL presence to the individual’s attitudes and success.
Introduction of Self-Directed Mathematics Learning Attitude Scale
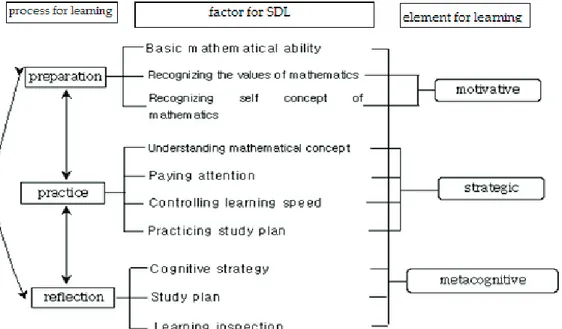
The Self-Directed Mathematics Learning Attitude Scale is an assessment instrument developed by Lee and Kim (2005) in order to determine middle school (corresponds to the secondary education in Turkey) students’ self-directed learning attitudes towards Mathematics. The scale was administered to 767 students (316 boys, 451 girls). It was given dimensions as shown in Figure 2.
Figure 2. Dimensions of Self-Directed Mathematics Learning Attitude Scale(Lee and Kim, 2005) Ten SDL factors form the body of the scale: basic mathematical ability (f1), recognizing the values of mathematics (f2), recognizing self-concept of mathematics (f3), understanding mathematical concepts (f4), paying attention (f5), controlling learning speed (f6), practicing study plan (f7), cognitive strategy (f8), study plan (f9), learning inspection (f10). The scale consists of 57 items aimed at revealing the presence of these factors. It has 5-point Likert type responses from “Strongly Disagree” to “Strongly Agree”. Negative items in the scale are inversely scored. The score that can be received from the scale ranges from 57 to 285. While higher scores indicate that students have positive attitudes towards self-directed mathematics learning, lower scores point to negative attitudes.
After the validity and reliability study of the original scale, the Cronbach’s Alpha reliability coefficients were found as follows: .886 for f1, .869 for f2, .896 for f3, .811 for f4, .772 for f5, .628 for f6, .681 for f7, .861 for f8, .845 for f9 and .754 for f10. The scale was found to be valid and reliable for its sample.
Aim
The aim of this study is to test the validity and reliability of Self-directed Mathematics Learning Scale, developed by Lee and Kim (2005) in a culture and education system different from Turkey, and to present the usability of its Turkish version.
Method
Working Group
The working group consisted of 3485 (1750 girls and 1729 boys) 7th (1757) and 8th (1728) grade
students attending a total of 24 elementary schools located in the city center of Nigde/Turkey. Since exploratory and confirmatory factor analysis was used in the analysis of the data, they should demonstrate multiple normal distribution as the main assumption. Therefore, the number of samples is of importance. In determining sample size, Cattell (1978) argued that there should be between three and six respondents for each item, whereas the number should be at least five according to Gorsuch (1983), and ten according to Everitt (1975) (as quoted by McCallum et al.,
1999: p. 84-85). Jeong (2004: p. 70) suggests that this number should be at least five people for each item, whereas Hair et al. (1998: p. 604) require at least ten respondents. Hoyle (1995), on the other hand, suggests that the minimum sample size should be 250 people or more for confirmatory factor analysis.
In this study, the number of respondents for each of 57 items is approximately 61, which points, based on the figures in the literature, to an adequate sample size that can be generalized to the universe.
In the analysis of the data used in the research, exploratory factor analysis was firstly used. Then, first- and second-level confirmatory factor analysis was employed to confirm the dimensions presented through exploratory factor analysis and to test the validity and reliability of the assessment model. Exploratory factor analysis aims to define the main structure in a data matrix and to determine each dimension that constitutes this structure (Hair et al., 1998: p. 90). Confirmatory factor analysis, on the other hand, is a multivariable technique used to test a pre-determined relationship (Hair et al., 1998: p. 579).
Results
Adapting Self-Directed Mathematics Learning Attitude Scale into Turkish
Since the main aim of the study is to adapt an assessment tool into Turkish, following the psychological assessment tool adaptation principles suggested by Deniz (2007) was found appropriate. Thus, firstly, we sent an e-mail to Kim on the date of 10 Jan 2011 to ask for permission to use the scale and we received permission via e-mail on 13 Jan 2011. Then, the scale was translated to Turkish by three translators. After two mathematics education experts checked the translated version, the Turkish version was translated back to English by three different translators, in order to test the contextual understandability of the scale and meanings of each item. After this stage, 50 7th grade students and 50 8th grade students were asked to read the scale in order to determine the
expressions they could not understand and to make adjustments accordingly without disrupting the cohesion of the entire scale. Since intercultural comparison was not among the aims of the study, such a comparison was not made. It is believed that it would be appropriate for researchers who will use the Turkish version of the scale to get permission from the author.
Findings Related to the Scale’s Exploratory Factor Analysis and Reliability Level
KMO and Bartlett’s tests were performed in order to test if the Self-Directed Mathematics Learning Attitude Scale is suitable for exploratory factor analysis or not. For this, KMO test result should be .60 or above and the Bartlett’s sphericity test result should be statistically significant (Jeong, 2004). In this study, KMO test result was found as .972; and Bartlett’s sphericity test was found to be statistically significant at P<0.01 level, which indicate that exploratory factor analysis can be performed for the scale. In the exploratory factor analysis, the threshold value for loads of items in their factors was taken .50, and the varimax technique and principle component analysis method were used in order to find items in high correlation with factors and to better interpret them. Findings related to exploratory factor analysis of the scale are given in Table 1.
Table 1.
Exploratory Factor Analysis Findings of Self-Directed Mathematics Learning Attitude Scale Item Number Factor Common Variance Loads of Factors
Loads After Rotation Corrected
Item – Total Correlation Cronbach’s Alpha Level F1 F2 F3 F4 F5 F6 M1 .563 .525 .684 .599 .863 M2 .600 .540 .713 .636 M3 .541 .550 .645 .627 M4 .503 .550 .573 .609 M5 .533 .573 .520 .611 M6 .484 .555 .574 .599 M7 .523 .584 .556 .623 M8 .522 .536 .628 .590 M10 .527 .537 .640 .596 .847 M11 .556 .538 .657 .628 M12 .553 .519 .680 .615 M13 .597 .520 .716 .648 M14 .625 .557 .704 .682 M15 .513 .529 .620 .602 M25 .428 .502 .540 .515 .795 M26 .483 .556 .552 .562 M27 .582 .563 .655 .615 M28 .508 .517 .618 .541 M29 .542 .545 .634 .581 M30 .429 .565 .485 M31 .579 .752 .548 .805 M32 .657 .784 .682 M33 .624 .754 .658 M34 .587 .750 .596 M38 .543 .649 .483 .715 M39 .615 .667 .584 M40 .573 .639 .538
M36 .579 .717 .590 .686 .953 M37 .528 .687 .623 .681 M41 .502 .650 .616 .655 M42 .525 .668 .644 .678 M43 .585 .717 .694 .727 M44 .565 .697 .699 .714 M45 .512 .658 .677 .673 M46 .574 .720 .690 .721 M47 .515 .581 .657 .599 M48 .594 .713 .732 .733 M49 .640 .748 .732 .763 M50 .626 .734 .723 .746 M51 .607 .724 .727 .742 M52 .579 .702 .713 .719 M53 .577 .651 .718 .675 M54 .506 .641 .683 .656 M55 .604 .713 .739 .728 M56 .591 .712 .728 .727 M57 .579 .713 .713 .717
Cronbach’s Alpha coefficient for the entire scale was found to be .943.
After the factor analysis, it was observed that the items fell under six factors. While the first factor explains 22,07% of the total variance of the scale, second 8,74%, third 8,17%, fourth 6,69%, fifth 6,05% and sixth 3,88%. The factor dimensions in total explain 55,60% of the scale.
After factor rotation, it is seen that the first factor of the scale consists of 19 items, the second factor 8 items, the third and fourth factors 6 items, the fifth factor 4 items and the sixth factor 3 items. 11 items were excluded from the scale since they did not fall under any factors or they had a value below .50. Büyüköztürk (2002) indicates that it is good if items’ common variance is close to 1 or above .66, but it is difficult to attain these values in practice. Factors were tried to be named based on the names in the original version. Accordingly, factors (basic mathematical ability, recognizing the value of mathematics, understanding mathematical concepts, paying attention and practicing study plan) were named “reflective metacognitive strategies”, respectively.
The Cronbach’s Alpha coefficients were calculated for the reliability of the scale: .943 (entire scale); .953 (first factor); .863 (second factor); .847 (third factor); .795 (fourth factor); .805 (fifth factor) and .715 (sixth factor). Tezbaşaran (1997: 47) suggests that a reliability coefficient that could be seen as adequate in a Likert-type scale should be as close to 1 as possible. Then, it could be stated that the first five sub-dimensions have high level of reliability, while the sixth sub-dimension has reasonable level of reliability. When considered the scale’s exploratory factor analysis findings and internal consistency coefficients, it is concluded that the scale is valid and reliable with these items.
Findings Related to the Scale’s Confirmatory Factor Analysis and Reliability Level
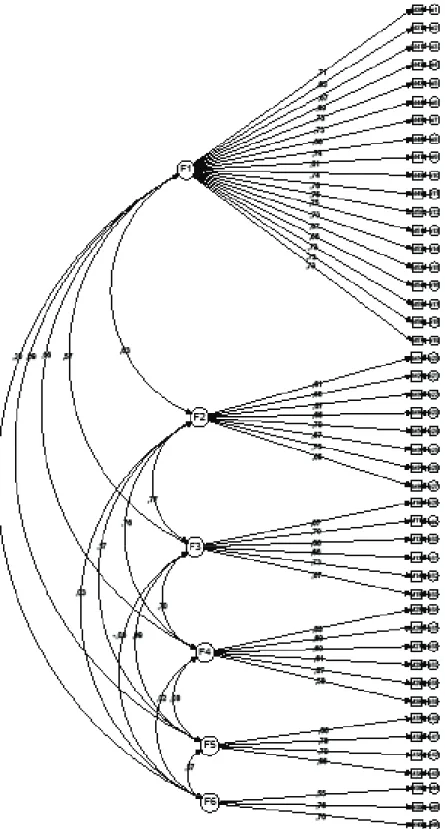
First-level confirmatory factor analysis of the scale was performed with AMOS 6.0 software and the maximum likelihood method was used in the analyses. The model of the first-level confirmatory factor analysis is presented in Figure 3.
Figure 3: First-Level Confirmatory Factor Analysis
Figure 3. shows that there exist mostly medium-level correlations between the sub-dimensions of the scale. According to Bagozzi (1981: pp. 375-376) and Peter (1981: p. 136-137), dimensions of a structure should have medium-level correlations with each other in order for each dimension to exist separately. It can be concluded that the scale satisfies this condition.
After the acceptable modifications envisaged by Amos 6.0 software, Chi-Square (c2) was
found to be 2452,609 and degree of freedom (df) was found to be 917 after first-level confirmatory factor analysis, and the model is statistically significant (P<0.01). When considered the minimum modifications (These modifications were made between the error terms of the items. It is seen likely in our scale for each item to have correlation with others. Based on these correlations, modifications recommended by the software that help improve model goodness-of-fit were made) envisaged by the software, findings of the first-level confirmatory factor analysis are presented in Table 2. The table shows items’ standardized regression weights, t values and significance levels. Table 2.
Confirmatory Factor Analysis Findings of Self-Directed Mathematics Learning Attitude Scale
Dimensions Items Standardized Regression Weights t p
Factor 1 (rC=0,95*) M36 ,710 --- ---M37 ,628 40,596 .000 M41 ,669 38,118 .000 M42 ,686 38,968 .000 M43 ,732 41,525 .000 M44 ,728 41,364 .000 M45 ,678 38,418 .000 M46 ,742 43,641 .000 M47 ,611 33,238 .000 M48 ,743 42,040 .000 M49 ,777 44,044 .000 M50 ,752 42,607 .000 M51 ,750 42,513 .000 M52 ,734 41,618 .000 M53 ,674 38,104 .000 M54 ,663 37,624 .000 M55 ,727 41,087 .000 M56 ,734 41,618 .000 M57 ,732 41,513 .000 Factor 2 (rC=0,86*) M1 ,613 --- ---M2 ,647 35,140 .000 M3 ,675 32,548 .000 M4 ,665 31,869 .000 M5 ,698 32,622 .000 M6 ,672 32,322 .000 M7 ,696 33,207 .000 M8 ,646 31,356 .000 Factor 3 (rC=0,84*) M10 ,674 --- ---M11 ,704 35,842 .000 M12 ,656 33,352 .000 M13 ,664 33,371 .000 M14 ,730 35,942 .000 M15 ,666 33,531 .000 Factor 4 (rC=0,81*) M25 ,593 --- ---M26 ,689 30,594 .000 M27 ,691 31,606 .000 M28 ,609 28,583 .000 M29 ,675 30,164 .000 M30 ,577 26,932 .000 Factor 5 (rC=0,82*) M31 ,655 --- ---M32 ,787 33,751 .000 M33 ,793 34,186 .000 M34 ,661 30,669 .000 Factor 6 (rC=0,71*) M38M39 ,555,758 26,981--- .000 ---M40 ,699 25,927 .000
*rC : Construct Reliability = (∑ standardized reg. weight)2 / (∑ standardized reg. weight)2 + ∑ measurement errors (Fornell and
Table 2 shows that the dimensions obtained after exploratory factor analysis are confirmed. Standardized regression weights of items in factors are very high and items are statistically significant. Construct reliability for factors were found as follows: first factor .95, second factor .86, third factor .84, fourth factor .81, fifth factor .82, and sixth factor .71. According to Hair et al., (1998) and Şimşek (2007), construct reliability should be .50 or above. Then, it is concluded that the items are valid, reliable and represent the relevant factors. Goodness of fit indexes related to first-level confirmatory factor analysis are given in Table 3. Since items’ goodness of fit indexes are the same with respect to both first- and second-level confirmatory factor analyses, they are given in a single table (Table 3).
Table 3.
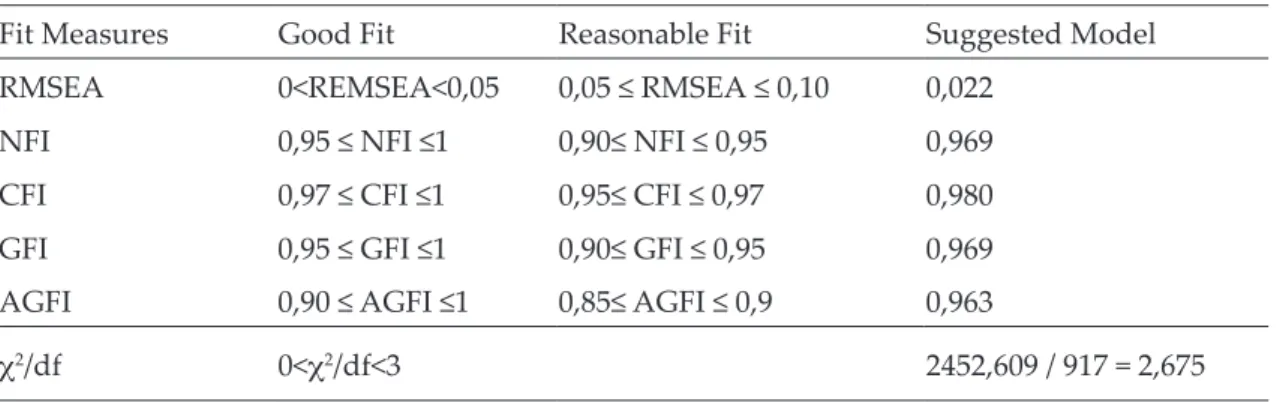
Goodness of Fit Indexes Related to the Model Emerged After Self-Directed Mathematics Learning Attitude Scale *
Fit Measures Good Fit Reasonable Fit Suggested Model
RMSEA 0<REMSEA<0,05 0,05 ≤ RMSEA ≤ 0,10 0,022
NFI 0,95 ≤ NFI ≤1 0,90≤ NFI ≤ 0,95 0,969
CFI 0,97 ≤ CFI ≤1 0,95≤ CFI ≤ 0,97 0,980
GFI 0,95 ≤ GFI ≤1 0,90≤ GFI ≤ 0,95 0,969
AGFI 0,90 ≤ AGFI ≤1 0,85≤ AGFI ≤ 0,9 0,963
c2/df 0<c2/df<3 2452,609 / 917 = 2,675
*Schermelleh-Engel and Moosbrugger, (2003: 23-74).
In the confirmatory factor analysis, the value that tests the statistical fit of the suggested model and the analyzed sample is the value of χ2 (Schumacker 2004). χ2 tests whether the covariance matrix that belongs to the population equals to the covariance matrix implemented in the model. However, since this value is sensitive to sample size and since high χ2 values will be obtained in large samples, it is seem more appropriate to use the value of χ2/df adjusted with degree of freedom (df) (Bagozzi 1981). The χ2/df value obtained in this study is 2,675, which indicates that the model is statistically significant. In addition, an IFI value, which considers both sample size and model complexity, of .95 and above points to a good fit (Şimşek 2007). The IFI value was found in this study to be .980 and this shows a good fit.
According to the goodness of fit index presented in Table 3, all values are in good fit. This finding indicates that the dimensions obtained after the exploratory factor analysis have been confirmed by the confirmatory factor analysis.
Conclusion
In this study, it was aimed to adapt SDMLAS developed by Lee and Kim (2005) into Turkish and to determine its applicability in Turkey, several noticeable differences came out. Findings of the developers of the scale and current findings overlap in terms of the main dimensions, though numbers of items and sub-dimensions do not. While the original scale had 10 SDL factors, the adapted scale had 6. On the other hand, the three main dimensions (learning process, SDL factor and learning element) did not change. However, the decline in the number of factors caused a change in the numbers of factors in these main dimensions. The new model of the scale, which includes three main dimensions, sub-dimensions and SDL factors, is shown in Figure 4.
Figure 4. New model of SDMLAS after the adaptation into Turkish
All items of “recognizing self-concept of mathematics” (Items 17-23) and items 9, 16, 24 and 35 were excluded from the scale since they did not yield adequate results. Besides, the factor “controlling learning speed” is in the scale not as a strategic and practical factor, but as a metacognitive and reflective factor. In addition, four of the factors (cognitive strategy, study plan, learning inspection and controlling learning speed) acted as a single factor during the analyses. Therefore, the need arose to rename the factor that includes these items and thus it was named “reflective metacognitive strategies”. One of the most important findings of the study is that these four factors acted as a single factor. This finding in the adaptation study of a scale, which aims to separately address metacognitive skills and to do planning by making interpretations accordingly, can be interpreted in a way that the education program implemented in Turkey has not yet completed its construction process towards differentiating and evaluating these factors. Therefore, it could be argued that the characteristics that these factors aim to demonstrate are not developed in the participant students.
In conclusion, three dimensions did not change in the adaptation of the scale into Turkish, while one of the SDL factors was entirely excluded from the scale and four SDL factors acted as a single factor. Then, it could be stated that the scale consists of three main dimensions, six SDL factors and 46 items. It is thought that the main reasons behind this change are intercultural differences and different perceptions in educational environments. Given the fact that elementary school education programs in Turkey were restructured in 2005 in a way to include metacognitive skills, different findings can be expected from studies to be conducted with 7th and 8th grade
students after 2012. Thus, the condition of elementary school programs in terms of supporting SDML in students can be examined.
It was found after both exploratory and confirmatory factor analyses that the Self-Directed Mathematics Learning Attitude Scale is valid and reliable and its Turkish version can be used in Turkey. This finding might be taken as an important step by future researchers as it provides data about measuring an important metacognitive skill (SDL) in a field like Mathematics that is necessary for every individual in the society. For the standardization of the Turkish version of
the scale, its validity and reliability should be demonstrated in different samples. In this manner, the stability -another important characteristic of reliability- should also be tested. Therefore, it is suggested that researches should be carried out aimed at exploring the relationships between Self-Directed Mathematics Learning Attitude and Mathematical Literacy, Mathematical Power, Mathematical Success and Reading Comprehension Skills.
References
Bagozzi, R.P. (1981). Evaluating structural equation models with unobservable variables and measurement error: A comment. Journal of Marketing Research, 18(3), 375-381.
Brockette, R. G., Stockdale, S. L., Fogerson, D. L., Cox, B.F., Canipe, J.B., Chuprina, L.A., Donaghy, R.C., Chadwell, N.E. (2000). Two decades of literature on self-directed learning: a content analysis. Paper presented at the 14th International Self-Directed Learning Symposium, February 3-5, Boynton Beach, Florida.
Büyüköztürk, Ş. (2002). Handbook of data analysis for social sciences. Ankara: PegemA Publishing.
Çakıroğlu, A. (2007). Metacognition. Social Studies Journal of Turkey, 11(2), 21-27.
Deniz, K., (2007). Psikolojik ölçme aracı uyarlama. Ankara University Educational Sciences Faculty Journal, 40(1), 1-16.
Fisher, M., King, J., & Tague, G. (2001). Development of a self-directed learning readiness scale for nursing education. Nurse Education Today, 21, 516-525.
Fornell, C. & Larcker, D. F. (1981). Evaluating structural equation models with unobservable variables and measurement error. JMR, Journal of Marketing Research (pre-1986), 39-50. Hair, J.F. Jr., Andreson, R.E. Tahtam, R.L, & Black, W.C. (1998). Multivariate data analysis (5th Ed.).
New Jersey: Prentice-Hall International Inc.
Hoban, S. & Hoban, G. (2004). Self-esteem, self-efficiacy and self-directed learning: attempting to undo the confusion. International Journal of Self-Directed Learning, 1(2), 7-25.
Hoyle, R.H. (1995). Structural equation modelling: Concepts, issues and applications. London: Sage Publication Inc.
Jeong, J. (2004). Analysis Of The Factors And The Roles Of Hrd In Organizational Learning Styles As Identified By Key Informants At Selected Corporations In The Republic Of Korea. Unpublished PhD Thesis. US: Texas A&M University. Major Subject: Educational Human Resource Development.
Karakelle, S. & Saraç, S. (2007). Metacognitive awareness scale for children (Forms A and B: validity and reliability study. Turkish Psychology Writings, 10(20), 87-103.
Kim, S.H. & Kim, S. (2010). The effects of mathematical modeling on creative production ability and self-directed learning attitude. Asia Pasific Educational Review, 11, 109-120.
Lee, C. H., & Kim, S. H. (2005). Development of the self-directed mathematics learning test based on Vygotsky. Journal of Korea Society of Educational Studies in Mathematics: School Mathematics, 7(3), 253-268.
Loyens, S.M.M., Magda, J., & Rikers, R. M. J. P. (2008). Self-directed learning in problem-based learning and its relationships with self-regulated learning. Educational Psychological Review, 20, 411-427.
Lucangeli, D. & Cornoldi, C. (1997). Mathematics and metacognition: What is the nature of the relationship? Mathematical Cognition, 3(2), 121-139.
Mandacı Şahin, S. (2007). The determination of 8th grade students’ mathematical power, Unpublished
Doctorate Thesis, Karadeniz Technical University, Trabzon, TURKEY.
McCallum, R. C., Keith F. Widaman, Shaobo Zhang, & Sehee Hong. (1999). Sample size in factor analysis. Psychological Methods, 4(1), 84-99.
Peter, J. P., (1981). Construct validity: a review of basic issues and marketing practices. Journal of Marketing Research, 18(2), 133-145.
Reio, T.G.Jr. (2004). Prior knowledge, self-directed learning readiness, and curiosity: Antecedents to classroom learning performance. International Journal of Self-Directed Learning, 1(1), 18-25.
Schermelleh-Engel, K., & Moosbrugger, H. (2003). Evaluating the fit of structural equation models: Tests of significance and descriptive goodness-of-fit measures. Methods of Psychological Research Online, 8(2), 23-74.
Schumacker, R.E. (2004). Beginner’s guide to structural equation modelling. New Jersey: Lawrence Erlbaum Associates Inc.
Şimşek, Ö. F. (2007). Introduction to structural equality modelling: Basic principles and LISREL practices. Ankara: Ekinoks Publishing.
Tezbaşaran, A. A. (1997). Guide to develop likert-type scales (Second Edition). Ankara: Turkish Psychologists Association.
ÖZYÖNELİMLİ MATEMATİK ÖĞRENME TUTUM ÖLÇEĞİ
Kesinlikle
Katılmıyorum Katılmıyorum Kararsızım Katılıyorum Katılıyorum Kesinlikle
1 Matematik dersinde kullanılan ders kitabını anlayabilirim. 2 Ders kitabında açıklanan içeriği okuduktan sonra, açıklanan
matematik terimlerini söyleyebilirim.
3 Ders kitabında gösterilen matematik sembollerini yazabilirim. 4 Öğretmenin ders sırasında anlattıklarını anlayabilirim. 5 Temel matematik işlemlerini (toplama,çıkarma.çarpma.bölme)
yapmakta iyiyimdir.
6 Matematik problemini okuduğumda çözüm için neyin gerekli olduğunu kavrayabilirim.
7 Matematik derslerinde görülen grafik veya tabloların anlamını anlayabilirim.
8 Matematik ders kitabını okuduğumda matematiğe özgü konuların açıklamasını anlayabilirim.
9 Matematik hakkında ne bildiğimi kelimelerle açıklayabilirim.* 10 Okulda öğrendiklerimiz hayatta faydalı olacaktır.
11 Matematik çalışmak sonradan, bana iş bulmada yardımcı olacaktır. 12 Matematik insanların öğrenmek zorunda olduğu bir derstir. 13 Herkes matematik öğrenmeye ihtiyaç duyar.
14 Matematik daha sonra çalışmama yardımcı olacak faydalı bir derstir. 15 Matematik günlük hayat problemlerini çözmekte faydalıdır. 16 Matematik dersinde öğrendiklerimi diğer derslere uygulayabilirim.* 17 Matematik öğrenmek ilginçtir.*
18 Matematikle ilgilenirim.*
19 Matematik hakkında daha fazla bilgi öğrenmek istiyorum.* 20 Bence matematikte daha iyisini yapabilirim.*
21 Bence gelecekte okulda matematik öğrenmek daha ilginç olacaktır.* 22 Matematikten hoşlanıyorum.*
23 Matematiği iyi yapabildiğim konusunda kendime güvenirim.* 24 Öğretmen açıklama yaparken ben ana kavramı bulmaya çalışırım.*
25 Bağlantılar kurarak kavramları anlamaya çalışırım.
26 Çalıştıklarımı kendi kelimelerimi kullanarak tekrar düşünürüm. 27 Çeşitli matematik kavramları arasında ilişki bulmaya çalışırım. 28 Önceki dersler arasında bugünkü ders için gerekli şeyleri bulmaya
çalışırım.
29 Aklımda yeni durumları hayal ederek matematikteki yeni kelimeleri veya kavramları öğrenirim.
30 Öğretmenin söyledikleriyle ilgili neyin daha çok veya daha az önemli olduğunu fark edebilirim.
31 Hayal kurmamdan dolayı öğretmenin sınıfta söylediklerini dinlemem. 32 Matematik derslerine konsantre olmak benim için zordur.
33 Matematik derslerinde kolaylıkla dikkatim dağılır.
34 Dikkatli dinlemediğim için dersteki kavramları anlamam zordur. 35 Matematik ödevlerini yapmakta hızlıyımdır.*
36 Birkaç şeyi yaparken neyin daha önemli olduğuna karar verebilirim. 37 Çalışmak için planladığım gibi zamanımı kontrol edebilirim. 38 Sınavlardan sonra matematik çalışmadığım için pişman olurum. 39 Sınavlarda iyi yapamam; çünkü planladığım gibi çalışamam. 40 Planlandığı gibi çalışmak zordur.
41 Anafikri bulmaya çalışırım.
42 Proje yaparken birden fazla metot ile çalışırım.
43 Matematik çalışmak için ilgili bilgileri seçer ve düzenlerim.
44 Matematik ödevlerini önceden bildiklerimle nasıl ilişkilendireceğim hakkında düşünürüm.
45 Bir matematik problemini çözerken ve hatta çözdükten sonra ne öğrendiğimi kendime sorarım.
46 Ne yapacağım ve nasıl yapacağımı anladığım konusunda kendime güvenirim.
47 Matematik ders kitabının özet bölümünü dikkatlice incelerim. 48 Verilen bir projenin amacını projeyi tamamlamadan önce anlamaya
çalışırım.
49 Projeyi nasıl tamamlayacağıma karar veririm. 50 Projenin ne gerektirdiğini anlamaya çalışırım.
51 İşe başlamadan önce projenin anlamını derinden düşünürüm. 52 Verilen bir projeyi tamamlamadan önce projeyi anlamaya çalışırım. 53 Matematik dersi boyunca aldığım notları ders kitabından kontrol
ederim.
54 Okuldan sonra sınıfta ne öğrendiğimin içeriğini anlamak için defterden ve kitaptan gözden geçiririm.
55 Bugünkü dersten önce daha önceki derste öğrendiklerimi gözden geçiririm.
56 Problemi çözdükten sonra çözümü bir kez daha gözden geçirerek sonuçları incelerim.
57 Öğretmenin söylediklerini anlayıp anlamadığımı görmek için kendimi kontrol ederim.