AN INVESTIGATION ON SINGLE-PARTICLE IMPACT BREAKAGE FUNCTIONS OF A GOLD ORE BY DROP-WEIGHT TECHNIQUE
Bulletin of the Mineral
Research and Exploration
http://bulletin.mta.gov.tr
Ömürden GENÇa*
Keywords:
Gold Ore, Comminution, Modelling, Breakage Function, Drop-Weight Test
ABSTRACT
Impact breakage functions for a gold ore from Bergama region (Turkey) was estimated based on the single-particle impact breakage distributions of particles obtained from drop weight tests. For this purpose, a modified manual version of a JK Tech drop-weight test device was used. Effect of specific comminution energy (Ecs) on impact breakage distributions were investigated. Relationship between specific comminution energy and impact breakage product fineness (t10) parameter was established. Ecs-t10 model given in the literature was successfully fitted to the breakage test results. Ecs-t10 impact breakage model for the gold ore was proposed to be used in breakage function estimation. t-family curve approach was applied to estimate single particle breakage functions of the gold ore. For this purpose, t-family curves were modelled and variations of empirical breakage functions for the gold ore were estimated on different impact energy levels for comminution process modelling.
* Corresponding author: Ömürden Genç, [email protected] Received: 27.02.2016
Accepted: 24.03.2016
aMuğla Sıtkı Koçman University Department of Mining Engineering 48000, Muğla, Turkey
Research Article BULLETIN OF THE MINERAL RESEARCH AND EXPLORATION
BULLETIN OF THE MINERAL RESEARCH AND EXPLORA TION Phone : +90 (312) 201 10 00 Fax : +90 (312) 287 91 88 Adress : MTA 06520 - Ankara - TURKEY
154
2017
CONTENTS
Foreign Edition 2017 154 ISSN: 0026-4563
One of the Main Neotectonic Structures in the NW Central Anatolia: Beypazarı Blind Thrust Zone and Related Fault-Propagation Folds
...Gürol SEYİTOĞLU, Korhan ESAT and Bülent KAYPAK Structural Features of the Niğde Massif in the Çamardı (Niğde) District ...Ramazan DEMİRCİOĞLU and Yaşar EREN Stratigraphy and Structure of the Southeastern Part of Piramagroon Anticline, Sulaimani Area, Northeast Iraq ...Kamal Haji KARIM and Polla Azad KHANAQA An Approach to Coast Edge Line at the Eastern Antalya Marginal-Marine Sea Sides ...Muhittin GÖRMÜŞ, Levent BAŞAYİĞİT and Ahmet UYSAL Grain Size, Total Heavy Mineral and Element Distribution and Control Factors Of Current Sediments on the Floor of Hisarönü and Datça Bays
...Barbaros ŞİMŞEK, Mustafa ERGİN, Murat EVREN, Özgür TÜRKMEN, Serkan PALAS, Hakan PEHLİVAN, Bahri Serkan AYDEMİR and Füsun ÖCAL Maastrichtian-Selandian Planktonic Foraminifera Biostratigraphy and Palaeoecological Interpretation of Akveren Formation in Bartin Area (Western Black Sea, Turkey) ... Caner KAYA ÖZER Sedimentology, Mineralogy and Origin of the First Discover Magnesite-Dolomite Belt in Ma’rib District, SW Arabian Peninsula
... Sa’ad Zeki A.kader AL-MASHAIKIE Sodium Sulfate (Glauberite-Bloedite) - Halite Association in the Tertiary (Upper Miosene - Pliocene) Katrandedetepe Formation, Ereğli-Bor Basin, Turkey ... Gökhan KADINKIZ, Memet PEKGÖZ, Mustafa KARAKAŞ and Abdurrahman MURAT Permeability of Savcıbey Dam (Bilecik) Axis Location and Design of Grout Curtain ...Mustafa Can CANOĞLU and Bedri KURTULUŞ The Importance of Amount of Settlement in Determining the Bearing Capacity of Soils ...Selçuk ALEMDAĞ, Aslıhan CİNOĞLU and Elif GACENER Investigation of Güllük (Muğla) Wetland Using Stable Isotopes (δ18O, δD) ... Melis A. SOMAY Assessment of Groundwater Metal-Metalloid Content Using Geostatistical Methods in Karabağlar Polje (Muğla, Turkey) ...Bedri KURTULUŞ , Çağdaş SAĞIR and Özgür AVŞAR An Investigation on Single-Particle Impact Breakage Functions of a Gold Ore by Drop-Weight Technique ... Ömürden GENÇ The Reaction of Physical Transformation of the Gravity Data And Linearity Dilemma ... Ertan TOKER Response to the “Reaction of the Physical Transformation of the Gravity Data and Linearity Dilemma” ... Uğur AKIN Bulletin of the Mineral Research and Exploration Notes to the Authors ... 1 15 27 41 59 83 109 135 157 169 181 193 207 215 219 221 1. Introduction
Comminution circuit design, simulation and optimization studies can only be achieved if the reliable models of the comminution equipment are built based on the actual breakage data. Models of comminution equipment (Napier Munn et al., 2005) require the determination of breakage distribution function which can be determined by using different methods such as single particle breakage test (Narayanan, 1985), one-size fraction batch grinding test, back-calculation using continuous grinding test data (Genç, 2002). Although many methods are suggested in the literature for the experimental measurement of breakage distributions, it is usually difficult to represent the breakage of materials by a standart method due to the mathematical formulation and non-normalizable breakage. Specific breakage function of materials is usually assumed to be independent of initial particle size, process conditions (Austin and Luckie, 1971; Austin, 1982; Narayanan, 1986; Weller et al., 1988; Zhang et al., 1988) and input energy level (Austin and Weller, 1982) to ease the comminution modelling work. Many other researchers proved the opposite case (Hukki, 1961; Yashima, 1987; Schönert, 1988; 1991; Taveres and King, 1998; Weedon, 2001). Man (2000)
showed that, particle size dependency of breakage distribution function changes from material to material.
Twin-pendulum and drop-weight devices were used to develop standard procedures for the calculation of breakage functions (Narayanan, 1985; 1986; Awachie, 1983; Leung, 1987; Narayanan, 1987; Morrell and Man, 1997). Specific breakage function can be estimated by using the relationship between specific comminution energy (kWh/t) and t10 breakage parameter and t-curve approach which were described by Narayanan (Narayanan, 1985; 1986; 1987). t-curve approach normalizes the effect of particle size. Different breakage energy levels were proposed for the estimation of breakage distribution function in the literature. According to Narayanan (1985), an input energy level of 41.788 kg-cm gives the appropriate characteristic breakage distribution function on the Ecs-t10 curve and proposed to be used in wet ore ball mill modelling. Morrell and Man (1997) suggested an arbitrary energy level of 1kWh/t. Zhang et al. (1988) used an energy range of 1.25-1.5 kWh/t for the estimation of breakage distribution functions of cement clinkers. Genç (2002) proposed 1kWh/t as a standard energy level for the breakage of cement clinker particles to estimate breakage functions.
In this study, it was aimed to evaluate the variations in the breakage distributions of different size fractions of a gold ore by drop-weight technique at different specific impact energy levels and normalize the size effect by using the t-curve approach in estimating the breakage functions. Ecs-t10 model (Napier Munn et al., 2005) was validated for the breakage test results. The model was also validated size by size. Established overall relationship between specific comminution energy and breakage distribution parameter (t10) was used to estimate breakage functions at different specific comminution energy levels. Breakage function reconstructions models (t10-tn models) were proposed for gold ore comminution modelling.
2. Materials and Methods
2.1. Drop-Weight Test Device
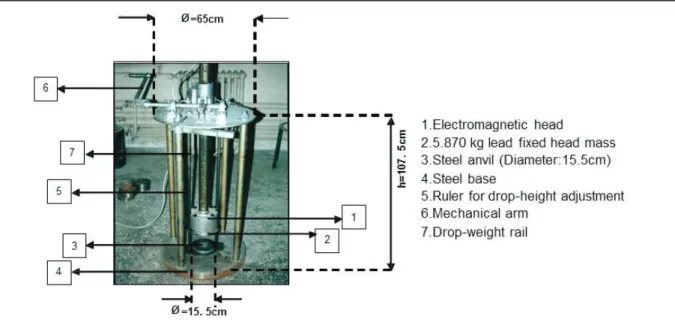
Drop-weight test device which was used in this study was previously described by Genç et al., (2004; 2014). It mainly comprises a steel anvil made from steel alloy, plate shape drop weight head, an electromagnet through which an electromagnetic field is formed so that weights can be hold or released from the desired heights (Genç et al., 2004; 2014). A photograph of the drop weight device is given in figure 1.
Impact energy level supplied by the plate shaped weight was calculated by Equation (1). Specific comminution energy level was calculated by Equation (2) (Napier Munn et al., 2005).
where,
Ei : Impact breakage energy (m2kg/sec2)
md : Mass of drop weight head (kg)
hi : Initial height of the drop-weight above the
anvil (m)
hf : Final height of the drop-weight above the
anvil (m)
where,
Ecs : Specific comminution energy (kWh/t) mp : Mean particle mass (g)
2.2. Sample and Laboratory Studies
Run-of-mine test sample was provided from the Bergama region in Turkey. Contained gangue mineral in the ore was mainly quartz. Tests were conducted on the selected narrow particle size fractions at different specific comminution energy levels (kWh/t). For this purpose, samples were dry sieved to the desired narrow size fractions and representative samples were
Figure 1- Drop-weight test device.
(
i f)
d im
g
h
h
E
=
−
p im
E
Ecs =
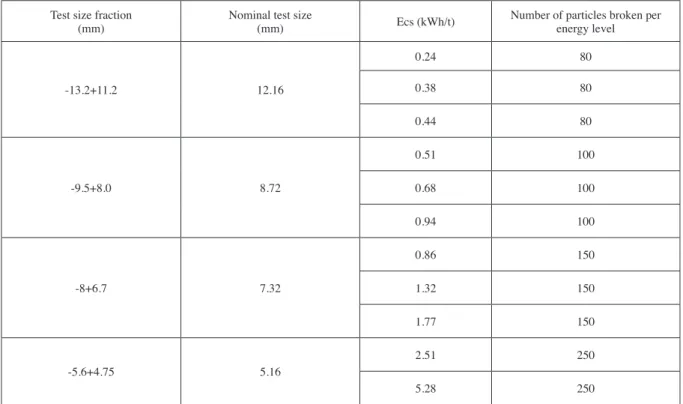
(1) (2)taken from each size fraction by using a riffler for each breakage energy level. Number of particles in each test size fraction was counted to determine the mean mass of the particles. Appropriate height and drop weights were calculated to achieve the desired specific comminution energy levels. Impact energy supplied by the plate shaped weight is calculated from the equations given by Napier Munn et al. (2005). Single particle breakage tests were carried out on each sample at the required energy levels. Broken fragments were collected from each breakage test, and dry sieved on √2 sieve series in a ro-tap sieve shaker for 15 minutes. Finally, particle size distributions of the broken gold ore samples were determined from the top size down to 0.038mm. Test size fractions, specific comminution energy levels (Ecs) in kWh/t and number of particles broken per energy level are tabulated in table 1.
3. Discussion
3.1. Impact Particle Size Distributions
Particle size distributions of the broken ore particles are given in figure 2 to 5 for different impact energy levels.
Figure 2- Size distributions of product particles from the breakage of -13.2+11.2mm at different impact energy levels.
Test size fraction
(mm) Nominal test size(mm) Ecs (kWh/t) Number of particles broken per energy level
-13.2+11.2 12.16 0.24 80 0.38 80 0.44 80 -9.5+8.0 8.72 0.51 100 0.68 100 0.94 100 -8+6.7 7.32 0.86 150 1.32 150 1.77 150 -5.6+4.75 5.16 2.51 250 5.28 250
Table 1- Drop-weight test specifications
Figure 3- Size distributions of product particles from the breakage of -9.5+8mm at different impact energy levels.
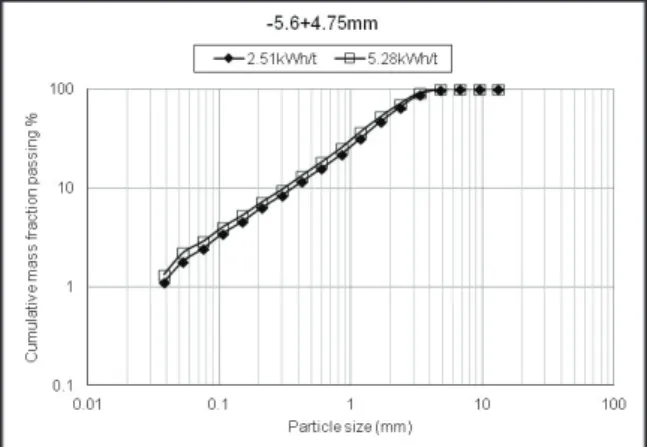
Figure 4- Size distributions of product particles from the breakage of
-8+6.7mm at different impact energy levels. Figure 5- Size distributions of product particles from the breakage of -5.6+4.75mm at different impact energy levels.
Particle size distributions of the breakage products in the breakage event of coarsest test size fraction -13.2+11.2mm indicated that finer particle size distribution could be achieved as the level of impact breakage energy was increased. It was observed that, breakage product size distributions did not change significantly although the energy level was increased by approximately 0.4kWh/t. This condition could be observed from the size distributions of product particles from the breakage of -8+6.7mm particles broken at energy levels of 1.32kWh/t and 1.77kWh/t (Figure 4). It became difficult to break particles by impact as the particle size got finer. For example, closely similar breakage product size distributions were observed in the breakage event of particles within the size fraction of -5.6+4.75 although the impact energy level was increased by about 3 kWh/t (Figure 5). This condition indicated that no more considerable size reduction would occur. More comminution energy is needed or the type of comminution mechanism should be changed for further breakage of gold ore particles. 3.2. Ecs-t10 Size Reduction Model
The value of t10 was traditionally accepted as the fineness or breakage index number. t10 was quantitatively defined as the amount of material passing
1/10th of the geometric mean of the broken size fraction.
The value of t10 distribution parameter indicates the fineness of the broken particle size fraction for different energy consumption levels. Impact breakage behaviour of materials can be characterized and compared through a single distribution parameter at any specific comminution energy level on the particle size basis by using t10 value. When the relationship between t10 and specific comminution energy level
is established, specific energy consumption required to achieve the desired particle size distribution can be predicted using t-curves. Ecs-t10 model is given in equation (3). The product of model parameters A and b is the slope of the Ecs-t10 relation at ‘zero’ input energy. Axb parameter can be used to characterize the hardness of the ore. Lower value of Axb indicates that more energy is needed for an equivalent amount of breakage (Napier Munn et al., 2005).
In this comminution model; A, b : material impact parameters
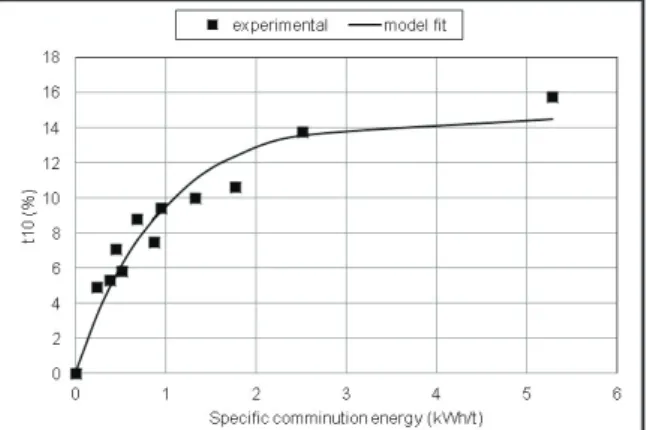
Ecs : specific comminution energy (kWh/t) Impact breakage model for the gold ore is given by Equation (4). A and b values were determined by non-linear regression using SPSS statistical program.
R2 of the overall model fit was 0.92. Axb value was
determined as 15.72.
Overall relationship between specific comminution energy and t10 parameter is given in figure 6. Experimental values were plotted as compared to model calculated values (model fit). Sufficiently good agreement between the experimental and model fitted values were observed which showed the validation of the Ecs-t10 model for the gold ore. Non-linear regression analysis was performed on the test results of each test size fraction to establish the Ecs-t10 relationship by particle size. Experimental and model fitted values are compared for different particle size
(
)
[
1-exp-b×Ecs]
× A = t10(
)
[
1
-
exp
-
1.08
×
Ecs
]
×
14.56
=
t10
(3) (4)fractions in figure 7. Model validation results for different particle size fractions are tabulated in Table 2. Ecs-t10 model could not be validated for the particle size fraction of -5.6+4.75mm as there was only two experimental results. A linear relationship was found to exist between particle size and Axb parameter. This relationship provided comparison between the hardness of different particle sizes (Figure 8). Findings also indicated that, Ecs-t10 relationships of ore particles vary by particle size for a constant level of specific comminution energy which may be linked to the probable differences in microstructure, mineralogical and chemical composition of different particle sizes.
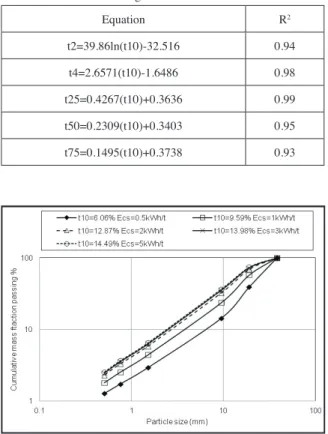
3.3. t-family Curves and Models
t-family curve approach (Narayanan, 1985) was used to determine breakage functions of the gold ore. t10-tn relationships are given in Figure 9 for breakage function reconstruction. Description of the t-curve approach which normalizes the effect of particle size was given in the literature (Narayanan, 1985; 1986; 1987). Distribution parameter, t10 was used which represents the amount of material at fine size ranges thus provides more information on the fragmentation at fine sizes. According to this approach, particle size distribution data obtained after the breakage of test samples was plotted and the size distribution parameters t2, t4, t10, t25, t50, and t75 correspondingly expressing the cumulative per cent passing size of y/2, y/4, y/10, y/25, y/50, y/75 were determined. y is the geometric mean of the size fraction of the test particles. t10 versus other distribution parameters are plotted to obtain t-family curves through which the product size distribution resulting from the breakage of the considered size fraction at any specific
comminution energy levelcan be established. t10-tn
family curves for the gold ore are given in Figure 9. Regression equations of the t-curves are tabulated in Table 3. Single particle impact breakage functions of the gold ore were estimated for different specific
Figure 6- Overall relationship between specific comminution energy and t10% for the gold ore sample.
Figure 7- Relationships between specific comminution energy and
t10% for different size fractions of the gold ore sample. Figure 8- Relationship between particle size and Axb.
Size fraction (mm) A b R2 Axb
-13.2+11.2 8.86 3.06 0.96 27.16
-9.5+8.0 15.29 1.07 0.98 16.38
-8.0+6.7 12.58 1.10 1.00 13.85
energy levels using the regression equations in table 3 and given in figure 10. It was observed that, gold ore particles started to exibit similar breakage functions at impact energy levels higher than 1 kWh/t which indicated that no more considerable size reduction could be achieved at energy levels higher than 1kWh/t by impact mechanism.
Table 3- Normalized breakage function re-construction models.
Equation R2 t2=39.86ln(t10)-32.516 0.94 t4=2.6571(t10)-1.6486 0.98 t25=0.4267(t10)+0.3636 0.99 t50=0.2309(t10)+0.3403 0.95 t75=0.1495(t10)+0.3738 0.93 4. Conclusion
Relationship between specific comminution energy and t10 breakage distribution parameter for the gold ore was found to be successfully fitted to the Ecs-t10 model given in the literature (Napier Munn et al., 2005). Impact breakage of gold ore particles were found to be size dependent. A linear relationship was found to exist between particle size and Axb impact breakage parameter. t-curves for the gold ore were modelled and proposed to reconstruct breakage functions which can be used in modelling of gold ore comminution. Variation in normalized breakage distribution functions were determined for different energy levels. Impact breakage distribution function was found to not change considerably at energy levels higher than 1kWh/t. Breakage function reconstruction models were proposed to be used in comminution modelling and simulations of size reduction machines operating on the basis of the impact mechanism in the processing of the related gold ore.
Acknowledgements
Author would like to acknowledge to Prof. Ş. Levent Ergün from the Mining Engineering Department of Hacettepe University.
References
Austin, L.G., Luckie, P.T. 1971. Methods for determination of breakage distribution parameters. Powder Technology 5, 45-52.
Austin, L.G., Weller, K.R. 1982. Simulation and scale-up of wet ball mills. XIV International Mineral Processing Congr., Toronto, Canada, 8.1-8.24. Awachie, S.E.A. 1983. Development of crusher models
using laboratory breakage data. PhD Thesis. The University of Queensland, JKMRC, Australia. Genç, Ö. 2002. An investigation of the breakage distribution
functions of clinker and additive materials. MSc Thesis. Hacettepe University, Mining Engineering Department, Turkey.
Genç, Ö., Benzer, A.H., Ergün, Ş.L. 2004. Single particle breakage characterization of materials by drop weight testing. Physicochem. Probl. Miner. Process. Poland, 38, 241-255.
Figure 9- t10-tn family relationships for the gold ore.
Figure 10- Typical impact breakage functions for different specific comminution energy levels.
Genç, Ö., Benzer, A.H., Ergün, Ş.L. 2014. Analysis of single particle impact breakage characteristics of raw and HPGR-crushed cement clinkers by drop weight testing. Powder Technology 259, 37-45.
Hukki, R.T. 1961. Proposal for a Solomonic settlement between the theories of von Rittinger, Rick and Bond. Trans SME/AIME, 220, 403-408.
Leung, K. 1987. An energy based ore specific model for autogeneous and semiautogenous grinding. PhD Thesis. The University of Queensland, JKMRC, Australia.
Man, Y.T. 2000. A Model-based scale-up procedure for wet, overflow ball mills. PhD Thesis. Julius Kruttschnitt Mineral Research Centre, Department of Mining, Minerals and Materials Engineering, The University of Queensland, Australia.
Morrell, S., Man, Y.T. 1997. Using modelling and simulation for the design of full scale ball mill circuits. Minerals Engineering (10) 12, 1311–1327. Napier Munn, T.J., Morrell, S., Morrison, R.D., Kojovic,
T. 2005. Mineral Comminution Circuits Their Operation and Optimization. JKMRC Monograph Series in Mining and Mineral Processing, No.2, The University of Queensland, Brisbane, Australia. Narayanan, S.S. 1985. Development of a laboratory single
particle breakage technique and its application to ball mill modelling and scale-up. PhD Thesis. Julius Kruttschnitt Mineral Research Centre, The University of Queensland, Australia.
Narayanan, S.S. 1986. Single particle breakage tests: A review of principles and applications to comminution modeling. Bull Proc. Australas. Inst. Min. Metall. 291, 4, 49-58.
Narayanan, S.S. 1987. Modelling the performance of industrial ball mills using single particle breakage data. International Journal of Mineral Processing 20, 211-28.
Schönert, K. 1988. Fundamentals of particle breakage. Course notes. University of Witwatersrand, Division of Continuing Engineering Education, Johannesburg, Section F6.
Schönert, K. 1991. Advances in comminution fundamentals and impacts on technology. Aufbereit.-tech. 32, 487-494.
Tavares, L.M., King, R.P. 1998. Single-particle fracture under impact loading. International Journal of Mineral Processing 54 (1), 1-28.
Weedon, D.M. 2001. A perfect mixing matrix model for ball mills. Minerals Engineering 14, 10, 1225-1236. Weller, K.R., Sterns, U.J., Artone, E., Bruchard, W.J.
1988. Multicomponent models of grinding and classification for scale-up from continuous small or pilot scale circuits. International Journal of Mineral Processing 22, 19-147.
Yashima, S., Kanda, Y., Sano, S. 1987. Relationships between particle size and fracture energy or impact velocity required to fracture as estimated from single particle crushing. Powder Technology 51, 277-282.
Zhang, Y.M., Napier Munn, T.J., Kavetsky, A. 1988. Application of comminution and classification modelling to grinding of cement clinker. Trans. IMM. 97, C207-C214.