Technical Note
High-Resolution MRI of Deep-Seated
Atherosclerotic Arteries Using Motexafin
Gadolinium
Chris Brushett, MS,
1,2Bensheng Qiu, PhD,
1,3Ergin Atalar, PhD,
1,4and
Xiaoming Yang, MD, PhD
1,3*
Purpose: To evaluate the potential of using motexafin
gad-olinium (MGd) to characterize atherosclerotic plaques of deep-seated arteries with MRI.
Materials and Methods: We exposed vascular endothelial
cells (EC) and smooth muscle cells (SMC) in vitro to varying concentrations of MGd. The fluorescence properties of MGd were then exploited using confocal microscopy to image exposed cells. For an in vivo validation study, we performed surface coil– based and intravascular coil– based high-res-olution MRI of the iliac arteries and the abdominal aorta of three atherosclerotic Yucatan pigs. Subsequently, MGd en-hancement of the target vessel walls was quantitatively evaluated and MR images were correlated with histology of the target vessels.
Results: The in vitro study confirmed the intracellularization
of MGd in both cell types and determined the optimum MGd dosage of 0.004 mmol/kg that produced the sufficiently high intracellular fluorescent intensity. The in vivo study showed a steady increase of MGd enhancement to approximately 25% at three hours postinjection of MGd. MRI showed areas of strong enhancement along the lumen boundary, which cor-responded to fibrous tissue seen in histology.
Conclusion: This study provides initial evidence that MGd
may enhance MR vessel wall imaging for the characteriza-tion of plaque in deep-seated arteries.
Key Words: atherosclerotic cardiovascular disease;
mo-texafin gadolinium; contrast agent; vessel wall; intravascu-lar MRI
J. Magn. Reson. Imaging 2008;27:246 –250. © 2007 Wiley-Liss, Inc.
ATHEROSCLEROTIC CARDIOVASCULAR DISEASE is still the leading cause of death in developed countries. Atherosclerosis refers to the buildup of fatty deposits or “plaque” in the innermost lining of the arterial wall. Atherosclerotic plaque causes hardening of the artery and narrowing of the vessel lumen, which can result in the obstruction of blood flow and the reduction of oxy-gen supply to the important tissues and organs of the body. Current diagnostic techniques, such as conven-tional X-ray angiography, focus on determining the de-gree of stenosis in arteries, but it is now understood that the composition and shape of the plaque, and not the degree of stenosis, are the best indicators of future acute events (1–3). A large lipid core with a thin or ruptured fibrous cap is thought to indicate “vulnerable” plaque with an elevated risk of thrombosis. To diagnose a plaque as vulnerable, the plaque composition, rather than plaque burden, must be identified. Previous works using MR contrast agents to discriminate between plaque components in the surface-seated arteries, pri-marily the carotid arteries, have shown an increased contrast between plaque components, such as fibrous tissue and lipid (1– 4).
However, it is a challenging task to generate high-resolution MRI of atherosclerotic plaques in the deep-seated arteries, such as the iliac arteries, the renal arteries, and the aorta, due to insufficient MR signal-to-noise ratios (SNRs) when using the body coil or sur-face coils. Motexafin gadolinium (MGd; Pharmacyclics Inc.), a gadolinium texaphyrin analog, is primarily de-signed as an intracellularly localized anticancer agent (5). MGd selectively accumulates in metabolically active tissues, such as tumors. In addition, MGd can produce red fluorescence when stimulated by blue light, and, thus, can be tracked under fluorescence microscopy (5,6). Because MGd contains gadolinium, it can also function as a T1 MR contrast agent. These characteris-tics of MGd encouraged us to evaluate MGd for
high-1
Russell H. Morgan Department of Radiology and Radiological Science, Johns Hopkins University School of Medicine, Baltimore, Maryland, USA.
2
Department of Biomedical Engineering, Johns Hopkins University School of Medicine, Baltimore, Maryland, USA.
3
Image-Guided Bio-Molecular Interventions Section, Department of Ra-diology, University of Washington School of Medicine, Seattle, Wash-ington, USA.
4
Department of Electrical and Electronics Engineering, Bilkent Univer-sity, Ankara, Turkey.
Contract grant sponsor: National Institutes of Health; Contract grant number: R01HL66187.
*Address reprint requests to: X.Y., Image-Guided Bio-Molecular Inter-vention Section, Department of Radiology, University of Washington School of Medicine, 1959 NE Pacific Street, HSC AA-036, Seattle, WA 98195. E-mail: [email protected]
Received July 21, 2006; Accepted August 22, 2007. DOI 10.1002/jmri.21174
Published online 29 November 2007 in Wiley InterScience (www. interscience.wiley.com).
resolution MRI of atherosclerotic plaques, which are also metabolically active tissues, similar to tumors. Currently, no studies have been performed investigat-ing the in vitro localization of MGd within the vascular cells involved in atherosclerosis. The potential of MGd to provide plaque-specific contrast enhancement for vulnerable plaque diagnosis of atherosclerotic disease is also unknown.
The objectives of the present study were to: 1) evalu-ate, in vitro, the intracellular properties of MGd, spe-cific to atherosclerotic plaques, by confirming the inter-nalization of MGd by vascular endothelial cells (EC) and smooth muscle cells (SMC); and 2) investigate, in vivo, the potential of using MGd as an MR T1 contrast agent to discriminate between tissues in the atherosclerotic plaques of the deep-seated iliac arteries in an athero-sclerotic animal model.
MATERIALS AND METHODS
MGd
MGd is an expanded porphyrin (texaphyrin) that con-tains bound gadolinium within its macrocyclic core. Texaphyrin molecules are known to be attracted to met-abolically active cells, such as tumor cells, and there-fore have strong potential in tumor imaging (5,7). The mechanisms of cell uptake of MGd are not clear, but considered as the effects of microenvironmental factors present in cells such as low pH and hypoxia (8). The fluorescent properties of MGd allow it to be imaged under a confocal microscope, with fluorescence at 740 nm when excited at 470 nm.
In Vitro Study
The in vitro study included two cell groups: 1) the first group to confirm intracellularization of MGd in vascular ECs and SMCs; and 2) the second group to determine the optimum concentration of MGd for subsequent in vivo animal study.
In the first cell group, human ECs and SMCs (Cam-brex Bio Science Walkersville, Inc., Walkersville, MD, USA) were cultured in a six-well plate. 0.1 mL of 2 mM MGd was added to 3 mL of basal media in each well. The cells were cultured with 70M MGd and the cell culture medium (provided by the manufacturer) in a 37°C in-cubator for 24 hours. Then, the cells were washed five times with phosphate-buffered saline to remove all MGd not bound to the membrane or internalized. The cells were then allowed to culture in cell culture me-dium for an additional 24 hours. After detaching the cells from each other by 0.5 mL trypsin (25%) per well, the cells from each well were collected in a centrifuge tube. Nonexposed control cells were prepared in a sim-ilar manner. Subsequently, cells were centrifuged, scraped from each of the four tubes, and then fixed in formalin on microscope slides for confocal microscopy imaging.
The cells were imaged with a Zeiss LSM 410 confocal microscope using a 470⫾ 10 nm excitation band-pass filter with a 700-nm emission long-pass (far-red) filter, and a power of 63 mW/cm2. Because MGd has an
emission wavelength (⬎700 nm) at which mammalian
cells do not autofluoresce, all fluorescent signal de-tected on the confocal microscope with the 700-nm long-pass filter comes from the presence of MGd. A standard black and white microscope image was also taken and fluorescence images were displayed in pseudocolor over the black and white images to show the cellular location of the MGd.
The second cell group was used to determine the optimum MGd dosage for subsequent in vivo animal study. Additional ECs and SMCs were subcultured and transferred to other six-well plates. The cells in each well were exposed to solutions of 0, 5, 10, 25, 50, and 100 M MGd, respectively, for 24 hours. They were washed, incubated, and extracted with the same method described above. In each of cell groups, five cells were randomly selected and imaged with the con-focal microscope. Signal intensity was averaged over the volume of the cells to obtain a measure of fluores-cence, which was subsequently plotted against MGd concentration. The MGd concentration at which the increase fluorescent intensity became negligible was considered the optimum MGd concentration. This con-centration was used to determine dosages for the sub-sequent in vivo study with atherosclerotic animal mod-els.
In Vivo Study
Animals
In vivo MRI studies were performed on three athero-genic Yucatan pigs (approximately 65 kg). The pigs were subjected to injury of the iliac arteries by balloon denu-dation followed by a high-cholesterol diet (Research Di-ets, Inc., New Brunswick, NJ, USA) for 18 –24 months. In addition to essential nutrients, vitamins, and salts, the atherogenic diet contains 4% cholesterol, 14% beef tallow, and 1% hog bile extract in daily amounts of 1000 g (9). All animals were treated according to the “Principles of Laboratory Animal Care” of the National Society for Medical Research and the “Guide for the Care and Use of Laboratory Animals” (10). The Animal Care and Use Committee at our institution approved the experimental protocol.
Surface Coil–Based MRI
Under general anesthesia, the first and second Yucatan pigs were placed in the 1.5T GE MR scanner. Dual 3-and 5-inch surface coils were placed on the abdomen and lower back, respectively. Two-dimensional time-of-flight (TOF) MR angiography was performed to obtain scout images to localize stenotic areas in the iliac arter-ies distal to the aortic bifurcation and in the lower abdominal aorta. Then, transverse images covering 3 cm of the iliac artery starting at the aortic bifurcation were obtained using high-resolution MRI.
MR images were acquired with a double inversion-recovery, fast spin-echo (FSE), black blood, electrocar-diograph (ECG)-gated pulse sequence using breath-holds in several locations along the 3-cm-long iliac arteries. The imaging parameters were as follows: TI⫽ 280 or 400 msec, TE⫽ 4.7 msec, heart rate (HR) ⫽ 80 bpm, TR ⫽ 1 heartbeat (⬃750 msec), field of view
(FOV)⫽ 30 cm, matrix size ⫽ 256 ⫻ 256, echo train length (ETL)⫽ 10, number of excitations (NEX) ⫽ 2 or 6, slice thickness⫽ 2 mm, and scan time ⫽ 30 seconds. This was a modified version of the imaging protocol used by Wasserman et al (4).
With pig 1, we compared MR contrast enhancements between MGd and gadopentetate dimeglumine (Magne-vist®, Berlex Laboratories, Inc., Montville, NJ, USA). After baseline images were taken, 11-mL Magnevist (0.1 mmol/kg) was intravenously administered via an ear vein using a digital injector at the injection flow rate of 5 mL/second and flushed with 20-mL saline. Contrast-enhanced imaging of the iliac artery was obtained in the same locations as preinjection, at 5, 15, 30, 45, 60, 90, 115, and 120 minutes postinjection. Following this pro-cedure, the pig was given a one-week break to allow for complete washout of Magnevist. Subsequently, the ex-act imaging of the iliac artery at the same level as im-aged above was repeated using 25 mL of 2 mM MGd (0.001 mmol/kg), which enabled us to achieve the same dose of gadolinium as that of 11-mL Magnevist (0.1 mmol/kg) we used above.
With pig 2, we tested the ability to use surface coil– based MRI with intravenous administration of MGd at the optimized MGd dosage (0.004 mmol/kg, as estab-lished from the in vitro study). We performed high-resolution MRI of the iliac artery wall using the same imaging protocol as used above, but the FOV was de-creased to 18 cm for improved resolution and the NEX was increased to 6 to compensate for lost SNR. In ad-dition, the scan was extended to capture images at 150 minutes and 180 minutes postinjection.
Intravascular MRI
In the third Yucatan pig, we attempted to validate the feasibility of performing intravascular high-resolution MRI of the aortic plaques with MGd enhancement. Through a surgical cutdown, a 7-F introducer was in-serted into the left carotid artery, through which a cus-tom 0.0032-inch MRI-guidewire (MRIG) (11,12) was po-sitioned into the lower abdominal aorta under X-ray guidance. The pig was then transferred to the 1.5T GE scanner and high-resolution imaging was performed using the intravascular MRIG and a 5-inch surface coil placed on the abdomen. FSE, black-blood, ECG-gated scans were prescribed in cross-section to the lower ab-dominal aorta. The following MRI parameters were used: TI⫽ 260 msec, TE ⫽ 11.5 msec, HR ⫽ 90 bpm, TR⫽ 1 RR (⬃670 msec), FOV ⫽ 10 cm, matrix size ⫽
256⫻ 192, ETL ⫽ 10, NEX ⫽ 10, slice thickness ⫽ 2 mm, and scan time ⫽ 130 seconds. The MRIG was operated in receive-mode only. After baseline imaging, 68 mL of 5 mM MGd (0.004 mmol/kg) was injected at a flow rate of 5 mL/second. Images were taken up to three hours postcontrast.
Image Analysis
Using the surface coil– based MR images, MGd en-hancement of the iliac artery wall was measured. Three imaging slices of each artery were examined before and up to two to three hours postinjection. For each image, a series of 30 points were chosen randomly within the vessel wall. These were averaged and normalized for all three slices to achieve an average MR amplitude. Sub-sequently, the amplitude was plotted for each agent and for each time point to show how contrast enhance-ment developed.
Histology
Once MRI was completed, the pig was euthanized with a dose of 100 mg/kg of pentobarbital, and the imaged tissues from the bilateral iliac arteries and the lower abdominal aorta were harvested. The specimens were embedded in paraffin, cut into 5-m slices on a cross-sectional view, and stained with hematoxylin and eosin (H&E) stain for microscopy examination.
RESULTS
In Vitro Study
Fluorescence was detected in exposed cells and was contained within the cellular membrane, as shown in Fig. 1. Confocal imaging showed internalization of MGd in both ECs and SMCs. MGd was shown to accumulate in the cytoplasm and was retained there for longer than 24 hours. Figure 2 shows fluorescence signal intensity plotted against concentration for confocal microscopy imaging. Near-maximal intensity was achieved with a 50M concentration of MGd. This concentration
cor-Figure 1. Confocal microscope images with MGd fluorescence
overlaid in red pseudocolor. a: Endothelial cell after exposure to 50M MGd. b: Unexposed endothelial cell. c: Smooth mus-cle cell after exposure to 50M MGd.
Figure 2. Average fluorescence intensity plotted against MGd
concentration for EC and SMC. The paired histogram for each concentration was similar in shape and showed nearly maxi-mal intensity at 50M concentration. au ⫽ arbitrary unit.
responded to the manufacturer-recommended maxi-mum dose of 0.004 mmol/kg MGd, which was selected as our optimum concentration of MGd for the subse-quent in vivo animal experiments. We achieved the op-timal concentration of 0.004 mmol/kg MGd by estimat-ing an amount of 5 liters of blood in the⬃65-kg pigs we used. From there we converted the 0.004 mmol/kg dose into a blood concentration of about 50 M ([0.004 mmol/kg] ⫻ [65 kg]/[5 liters] ⫽ 0.052 mmol/liter ⫽ 50M).
In Vivo Study
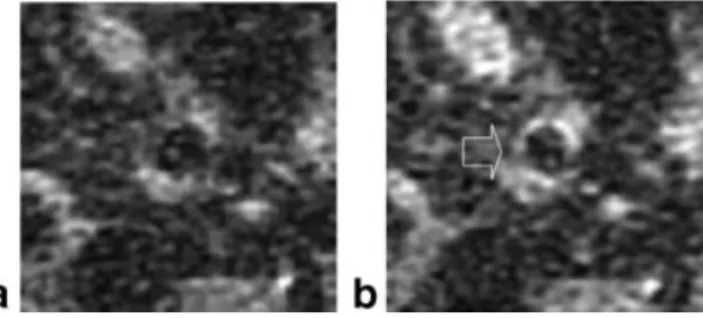
Since the vessels are small and deep inside the body, the surface coil MR images suffer from low SNR. Al-though this is the case, the effect of the contrast en-hancements to the images could be visualized and quantified. Contrast enhancement with Magnevist de-veloped rapidly to a maximum of 37% by five minutes, and then quickly began to decrease due to washout from the blood stream. MGd exhibited a different be-havior: enhancement increased steadily over the entire three-hour period of imaging. An increased average sig-nal enhancement of approximately 25% was seen at three hours postinjection of MGd (Fig. 3). Wall thicken-ing with nonuniform enhancement was visualized with the enhancement being greatest close to the lumen (Fig. 4).
With intravascular MR vessel wall imaging using the MRIG, image SNR increased significantly and thus we were able to reduce the FOV to 10 cm from 18 cm. Contrast enhancement in the atherosclerotic aortic wall was seen to occur again in a very nonuniform manner. Vessel wall thickening became more clear two hours after intravenous injection of MGd compared to the preinjection image. Areas of strong enhancement were seen along the lumen boundary, which corresponded to the fibrous tissue seen in histology (Fig. 5). Histological examination confirmed the presence of extensive wall thickening due to complicated plaques.
DISCUSSION
MR vessel wall imaging of deep-seated arteries has been a difficult task due to the low SNR when performing MRI of these vessels with a surface or body coil. To overcome this problem, we attempted to apply two different tech-niques, including: 1) an intracellular MR contrast agent, MGd, to specifically characterize different com-ponents of the atherosclerotic plaques, and 2) an intra-vascular MRIG to generate high-SNR MR vessel wall imaging.
This study has confirmed the in vitro internalization of MGd by both vascular endothelial and SMC using confocal microscopy. MGd was shown to accumulate in the cytoplasm of EC and SMC, and was retained there for longer than 24 hours. These findings are similar to
Figure 5. (Left column) Intravascular 1.5T MR images of the
atherosclerotic aorta using the 0.032-inch MRIG before and after intravenous administration of MGd. From top to bottom: pre-, 30 minutes, 60 minutes, and 120 minutes post-MGd injection. The fibrous cap (arrow) is outlined by MGd at 120 minutes. Scale bar⫽ 5 mm. (Right column) A corresponding histology image of the aorta. The arrow indicates the fibrous cap (H&E stain, 1.25⫻). [Color figure can be viewed in the online issue, which is available at www.interscience.wiley. com.]
Figure 3. Average MR signal enhancement of the target vessel
wall over a two- to three-hour period for the two contrast agents, presenting a sharp contrast enhancement with Mag-nevist and a slow contrast enhancement for MGd (curve ob-tained by combining the results of the MR signal intensities from pigs 1 and 2).
Figure 4. Surface coil– based MR images of the iliac artery of a
pig, before (a) and three hours post-MGd injection (b). Uneven enhancement of the artery wall (arrow) was seen with MGd.
those found by Woodburn (6) with tumor cells (7), which indicate that MGd can be taken up by not only tumor cells but also vascular cells. These results may indicate that under in vivo conditions, MGd should localize into fibrous tissue and healthy vessel wall tis-sue, which contain endothelial and SMC. Lipid pools have few of these cells while necrotic cores are noncel-lular; therefore, both should have low MGd concentra-tions at equilibrium. Thus, MGd may allow differentia-tion between fibrous caps and lipid cores under MRI. In addition, we also determined a suitable dosage (0.004 mmol/kg) of MGd for near-optimal internalization and enhancement of the vascular cells.
Surface coil– based MRI generated during this study demonstrate a potential for MGd to discriminate be-tween atherosclerotic plaque components, which can be further enhanced by using the intravascular MRI technique for better plaque characterization in the deep-seated vessels. In addition, MRI showed that MGd enhancement of the target vessel wall increased slowly over at least a three-hour period. This may be reflective of the slow cellular uptake of MGd by the vascular cells. These results are particularly encouraging, suggesting that MGd is steadily accumulating in the vessel wall and being retained in the vascular cells over time. These manifestations further support that MGd may function as a useful MR contrast agent for plaque characteriza-tion of deep-seated vessels using high-resolucharacteriza-tion MR vessel wall imaging.
Magnevist, a commonly used contrast agent with well-documented effects, was used here as a control. Magnevist is a small molecule that diffuses freely from the bloodstream into the vascular wall. It remains in the extracellular fluid and does not chemically target spe-cific cell types. It is also cleared from the bloodstream rapidly. In this study, Magnevist exhibited characteris-tic behavior: reaching maximal enhancement very quickly and then diminished as it was cleared from the blood. The administered dose of MGd was 100-fold less than that of Magnevist, which may explain the lack of immediate enhancement of the vessel walls. The slow build-up of enhancement is believed to be due to the necessary time period for vascular cells to uptake and internalize the agent. The limitation of this study is that it was unclear whether MGd enhancement continued to increase beyond this point of three-hours postinjection. A longer time period after injection would be needed to fully determine the enhancement behavior.
MGd is a texaphyrin molecule that covalently binds the paramagnetic metal gadolinium. Texaphyrins have several useful qualities. They accumulate in highly metabolic tissues, not only tumors but also plaques as demonstrated in this study. Some texaphyrins function as radiation enhancers, photosensitizers, or chemo-therapy enhancers. In the present study, we demon-strated the added benefit of MGd in functioning as a T1 MR contrast agent. This function is due to the bound gadolinium ion within the MGd molecule. In addition, texaphyrins are fully aromatic with a dark green color and emit fluorescent light when excited by a laser. This allows for accurate molecular optical imaging. Appar-ently, the further combination of the two MGd func-tions, therapy and imaging, should enable us to open
new avenues, using MGd-enhanced MRI technology to simultaneously diagnose atherosclerotic plaques and guide interventional therapies of atherosclerotic cardio-vascular disease.
The limitation of this study is that the initial nominal concentration of MGd for our in vivo experiments was calculated assuming distribution in blood plasma only. Its actual free concentration may depend on binding with albumin, lipoproteins, and blood cells. Further-more it is possible that MGd is able to diffuse through the vascular wall into the interstitium and some amount of MGd is cleared by the kidneys and liver over two to three hours of experiments. These factors war-rant further studies to understand the working mech-anisms of MGd as an intracellular MR contrast agent.
In conclusion, the present study provides initial evi-dence that MGd can generate contrast between various vascular tissue types, such as fibrous tissues involved in atherosclerotic plaques, and may be useful for plaque characterization of deep-seated arteries using high-resolution, contrast-enhanced MR vessel wall im-aging.
ACKNOWLEDGMENTS
We thank Drs. Dara Kraitchman and Bruce Wasserman for their constructive advice; Dr. Lawrence Hofmann for providing the animal models; Ms. Mary McAllister for her editorial assistance; and Pharmacyclics, Inc. for providing the motexafin gadolinium for this study.
REFERENCES
1. Yuan C, Miller Z, Cai J, Hatsukami T. Carotid atherosclerotic wall imaging by MRI. Neuroimaging Clin N Am 2002;12:391– 401. 2. Fayad Z. MR imaging for the noninvasive assessment of
athero-thrombotic plaques. Magn Reson Imaging Clin N Am 2003;11:101– 13.
3. Barkhausen J, Ebert W, Heyer C, Debatin J, Weinmann H. Detec-tion of atherosclerotic plaque with Gadofluorine-enhanced mag-netic resonance imaging. Circulation 2003;108:605– 609. 4. Wasserman B, Smith W, Trout HR, Cannon RR, Balaban R, Arai A.
Carotid artery atherosclerosis: in vivo morphologic characterization with gadolinium-enhanced double-oblique MR imaging initial re-sults. Radiology 2002;223:566 –573.
5. Woodburn J, Fan Q, Kessel D, Wright M, Mody T, Hemmi G, et al. Phototherapy of cancer and atheromatous plaque with texaphyrins. J Clin Laser Med Surg 1996:14;343–348.
6. Woodburn K. Intracellular localization of the radiation enhancer motexafin gadolinium using interferometric Fourier fluorescence microscopy. J Pharmacol Exp Ther 2001;297:888 – 894.
7. Mody T, Fu L, Sessler J. Synthesis and development of a novel class of therapeutic agents. In: Karlin K, editor. Texaphyrins. Chichester: John Wiley & Sons, Ltd; 2001. p 551–598.
8. Magda D, Miller R. Motexafin gadolinium: a novel redox active drug for cancer therapy. Semin Cancer Biol 2006;16:466 – 476. 9. Holvoet P, Theilmeier G, Shivalkar B, Flameng W, Collen D. LDL
hypercholesterolemia is associated with accumulation of oxidized LDL, atherosclerotic plaque growth, and compensatory vessel en-largement in coronary arteries of miniature pigs. Arterioscler Thromb Vasc Biol 1998;18:415– 422.
10. National Institutes of Health. Guide for the care and use of labora-tory animals. NIH Publication No. 86-23, revised 1985. NIH, Wash-ington, DC; 1985.
11. Ocali O, Atalar E. Intravascular magnetic resonance imaging using a loopless catheter antenna. Magn Reson Med 1997;37:112–118. 12. Yang X, Atalar E, Zerhouni EA. Intravascular MR imaging and
intravascular MR-guided interventions. Int J Cardiovasc Intervent 1999;2:85–96.