SO R PT IO N ST U D IE S OF C E SIU M A N D B A R IU M O N M A G N E SIT E U SIN G R A D IO T R A C E R A N D
X -R A Y PH O T O EL EC TR O N SPE C T R O SC O PY
A THESIS
SUBMITTED TO THE DEPARTMENT OF CHEMISTRY AND THE INSTITUTE OF ENGINEERING AND SCIENCES
OF BILKENT UNIVERSITY
IN PARTIAL FULFILLMENT OF THE REQUIREMENTS FOR THE DEGREE OF
MASTER OF SCIENCE
l ALAL SHAHWAN
SORPTION STUDIES OF CESIUM AND BARIUM ON MAGNESITE USING RADIOTRACER AND
X-RAY PHOTOELECTRON SPECTROSCOPY
A THESIS
SUBMITTED TO THE DEPARTMENT OF CHEMISTRY
AND THE INSTITUTE OF ENGINEERING AND SCIENCES
OF BILKENT UNIVERSITY
IN PARTIAL FULFILLMENT OF THE REQUIREMENTS
FOR THE DEGREE OF
MASTER OF SCIENCE
By
TALAL SHAHWAN
в и т
-І93Х
I certify that I have read this thesis and that in my opinion it is fully adequate, in scope
and in quality, as a thesis of the degree of Master of Science
Prof. Dr. Hasan N. Erten (Principal Advisor)
I certify that I have read this thesis and that in my opinion it is fully adequate, in scope
and in quality, as a thesis of the degree of Master of Science
Prof. Dr. Şefik Süzer
I certify that I have read this thesis and that in my opinion it is fully adequate, in scope
and in quality, as a thesis of the degree of Master of Science
Prof Dr. Hale Göktürk
Approved for the Institute of Engineering and Sciences
Prof Dr. Mehmet Baray
ABSTRACT
SORPTION STUDIES OF CESIUM AND BARIUM
ON MAGNESITE USING RADIOTRACER AND
X-RAY PHOTOELECTRON SPECTROSCOPY
TALAL SHAHWAN
M.S. in Chemistry
Supervisor: Prof. Dr. Hasan N. Erten
June 1997
As the consumption of the radioactive materials is continuously increasing, the
problem o f disposing the resulting v^^astes safely is becoming more challenging. One way
through which these radioactive wastes could be isolated from the biological
environment is by disposing them in deep geological formations. Clay minerals are
proposed as backfill buffering materials that can delay the migration of the radionuclides
and thus decrease the contamination of underground waters.
The extent of retardation of the radionuclide migration is dependent on factors
like time of contact, pH and Eh of groundwater, concentration, temperature and grain
size o f the mineral particles. Up to now, several studies were carried out to examine the
effect of such parameters on the sorption behavior of different radionuclides on various
kinds of minerals.
This study was conducted to investigate the effects of time, concentration and
temperature on the sorption behavior of cesium and barium ions on magnesite. Cesium
137 140
and barium have the radioactive isotopes Cs (t^^^ = 30.1 y) and Ba (t^^^ = 12.8 d)
1/2
produced in high yields during the fission process which are important in radioactive
waste considerations. Magnesite is a mineral composed mainly of magnesium carbonate
2+
together with minor amounts o f quartz and has a single exchangeable cation. Mg .
The radiotracer method and x-ray photoelectron spectroscopy, which is a
powerful surface sensitive tool, were used in this study. The results obtained from both
methods complemented each others and were in good agreement. Kinetic studies of the
sorption process show that equilibrium was approached within one day of contact for
both of cesium and barium ions.
The data of the sorption of both cations using different concentrations at various
temperatures were most adequately described by the Freundlich type isotherms which
correspond to multilayer adsorption on heterogeneous surfaces. The values of the
Freundlich constants k and n imply that barium ions have slightly larger adsorption
affinity and adsorption intensity than cesium ions. The adsorption data at low
concentrations were also observed to obey the Dubinin-Radushkevich type isotherms
which describe monolayer adsorption on heterogeneous or homogeneous surfaces. The
adsorption data were very poorly described by the Langmuir type isotherms.
Thermodynamic parameters such as enthalpy change, AH°, entropy change, AS°
and free energy change o f adsorption, AG°, were calculated from the sorption data of
cesium and barium ions at different temperatures. The values obtained for AH° and AS°
were -37 kJ/moL, -0.09 kJ/moL.K and -13 kJ/moL, -0.009 kJ/moL.K for cesium and
barium ions respectively. The negative AH° values indicate the exothermic nature of
adsorption which means that low temperatures are favored. The decrease in entropy upon
adsorption implied by the negative AS° values is indicative of the stability of adsorption
for both cations.
The values of AG° at different temperatures were all negative indicating the
spontaneity of the adsorption process for both cesium and barium ions. The magnitudes
of AG° were seen to be within the 8-16 kJ/moL range which is the energy range of ion-
exchange type processes.
Keywords: Sorption, Cesium, Barium, Magnesite, Batch Operation, Radiotracer Method, X-ray Photoelectron Spectroscopy, Distribution Ratio, Atomic Concentration Ratio, Isotherm Models, Enthalpy of Sorption, Entropy of Sorption, Gibbs Free Energy.
ÖZET
SEZYUM VE BARYUM İYONLARININ MAGNEZİT MİNERALİ
ÜZERİNE TUTULMASININ RADYOKİMYASAL YÖNTEMLE
VE X-IŞINI FOTOELEKTRON SPEKTROSKOPİSİ İLE
İNCELENMESİ
TALAL SHAHWAN
Kimya Bölümü Yüksek Lisans
Tez Y öneticisi: Prof. Dr. Haşan N. Erten
Haziran 1997
Radyoaktif maddelerin artan üretim ve kullanımı sonucunda oluşan radyoaktif
atıklar gün geçtikçe büyüyen bir sorun olarak ortaya çıkmaktadır. Bu atıkların derin
jeolojik oluşumlara depolanması için planlar yapılmaktadır. Oluşumlarda bulunan kil
mineralleri, radyoaktif izotopların dağılımını sorpsiyon yoluyla azaltmaktadır. Bunun
sonucunda, bu izotopların yeraltı sulann ulaşmaları ve meydana getirebilecekleri
radyoaktif kirlenme önemli ölçüde önlenebilmektedir.
Radyoaktif maddelerin mineraller üzerine tutulma davranışlan çeşitli faktörlerce
etkilenmektedir. Bunların arasında temas süresi, yeraltısulannm pH'ı ve Eh'ı, iyon
konsantrasyonu, ısı, ve mineral taneciklerin büyüklüğü sayılabilir. Bu faktörlerin
sorpsiyon davranışları üzerinde olan etkilerini daha önceden birçok araştırmalarca
incelenmiştir.
Bu çalışmada temas süresi, konsantrasyon ve ısı, sezyum ve baryumun iyonlanmn
137
magnezit üzerine sorpsiyonunu nasıl etkelediği araştmlmıştır. Cs 30.1 y) ve
140
Ba 12.8 d) izotoplan nükleer fizyon neticesinde yüksek verimle meydana gelen
ve radyoaktif atıklar bakımından önemli olan radyoizotoplardır. Magnezit büyük ölçüde
magnezyum karbonat az miktarda da kuartz içeren ve değişebilen tek iyonu olan bir
mineraldir.
Bu çalışmalarda radyokimyasal yöntemle beraber güçlü bir yüzeysel teknik olan
x-ışını fotoelektron spektroskopisi (XPS) de kullanılmıştır. Her iki yöntemden elde
edilen sonuçların birbirlerinin tamamlayıcı ve birbirlerine uyum içinde olduğu
gözlenmiştir.
Sezyum ve baryumun sorpsiyon kinetiği çalışmaları dengeye bir gün kadar bir
sürede ulaşıldığı gösterilmiştir. Elde edilen sorpsiyon verilerine değişik izoterm
modelleri uygulanmıştır. Sorpsiyon verilerin Freundlich izoterm modeline en iyi uyduğu
görülmüştür. Küçük konsantrasyonlarda verilerin ayrıca Dubinin-Radushkevich izoterm
modeline de uyduğu gözlenmiştir. Verilerin Langmuir izoterm modeline uymadığı
görülmüştür.
Değişik sıcaklıklarda elde edilen deneysel verileri kullanarak sorpsiyonda entalpi
değişimi, AH°, entropi değişimi, AS° ve Gibbs serbest eneıjisi değişimi, AG°,
hesaplanmıştır.
Sezyum ve baryum iyonlannın AH° ile AS° değerleri -37 kJ/moL , -0.09
kJ/moL.K ve -13 kJ/moL , -0.009 kJ/moL.K olarak bulunmuştur. Her iki katyon için
entalpi değişiminin eksi değerlerde olması sorpsiyon olayının ekzotermik olduğunu ve
düşük sıcaklıklarda daha fazla katyon tutulduğunu göstermektedir. Diğer yandan, entropi
değişiminin de eksi değerlerde olması sorpsiyonun her iki katyon için kararlı olduğunu
göstermektedir.
Değişik sıcaklıklarda sezyum ve baryum için yapılan AG° hesaplamalannda
negatif değerler elde edilmiştir. Bunlar ise, sorpsiyonun kendiliğinden oluştuğunu
göstermektedir. Hesaplanan AG° değerlerinin tümü, 8-16 kJ/moL değerleri arasında
bulunmaktadır. Bu düzeyedeki enerjiler, sorpsiyonun daha çok iyon değişimi yoluyla
meydana geldiğini göstermektedir.
Anahtar Kelimeler: Sorpsiyon, Sezyum, Baryum, Magnezit, Baç Tekniği, Radyokimya, X-Işmı Elektron Spektroskopisi, Dağılım Oranı, Atom Konsantrasyonu Oranı, izoterm Modelleri, Tutulma Entalpisi, Tutulma Entropisi, Gibbs Serbest Enerjisi.
ACKNOWLEDGEMENT
I would like to express my deep gratitudes towards my supervisor Prof. Dr. Hasan
N. Erten for his cooperation and guidance throughout the course of this study.
I wish also to thank Prof Dr. Şefik Süzer for his help and guidance in developing
this thesis.
I debt thanks also to the department technitians, department secretary and to my
friends for their help and encouragement.
I would like to express my endless thanks to my family and my wife for their
TABLE OF CONTENTS
1. INTRODUCTION j
1.1- Radioactive Waste Disposal... 1
1.2- Groundwater and Radionuclide M igration...3
1.3- The Sorption Process... 5
1.4- Cation Exchange Capacity...8
1.5- The Batch Technique...10
1.6- The Radiotracer M ethod... 11
1.7- X-ray Photoelectron Spectroscopy...12
1.8- The Present Study... 14
1.8.1- Cations and Their Radioactive Isotopes... 14
1.8.2- Magnesite...15
2. MATHEM ATICAL TREATMENT 20 2.1- The Distribution R atio... 20
2.2- The Atomic R atio...22
2.3- Adsorption Isotherm Models... 23
2.3.1- Langmuir Isotherm M odel...24
2.3.2- Freundlich Isotherm Model... 25
2.3.3- Dubinin-Radushkevich Isotherm Model... 26
2.4- Thermodynamic Relationships... 28
3. EXPERIMENTAL 30 3.1- Analysis o f Bilkent Groundwater...30
3.2- Experiments Using the Radiotracer Method... 31
3.2.1- Pretreatment of Magnesite Samples... 31
3.2.2- Isotopic Tracers... 31
3.2.3- Kinetic Studies...32
3.2.4- Studies o f the Sorption Isotherms at Different Temperatures...32
3.3- Studies Using XPS... 33
3.3.1- Kinetic Studies... 34
3.3.2- Loading Experiments...34
3.3.3- Experiments at Different Temperatures...34
4. RESULTS AND DISCUSSIONS 36 4.1- Kinetic Studies...36
4.2— Concentration and Temperature Dependence of Sorption...43
4.2.1- Loading Curves... 43
4.2.2- Freundlich Isotherms... ... 47
4.2.3- Dubinin-Radushkevich Isotherms... 55
4.2.4- Langmuir Isotherms... 58
4.3- Thermodynamic Parameters... 60
4.4- Conclusions... 72
REFERENCES... 74
LIST OF FIGURES
1.1 (a) Structure o f the Calcite Group, (b) Hexagonal Unit Cell, (c) Structure of
Refractory Magnesia, MgC0 3 ... 29 4.1 Variation of Values as a Function of Time for Sorption of Cesium and Barium
on M agnesite...
4.2 Variation o f Atomic Concentration Ratio as a Function of Time for Sorption
of Cesium on M agnesite... 42 4.3 Variation o f Atomic Concentration Ratio as a Function of Time for Sorption of
Barium on Magnesite ... 42 4.4 Variation o f R j as a Function of Cation Loading for the Sorption of Cesium on
M ag n esite ...^ 45 4.5 Variation of R^j as a Function of Cation Loading for the Sorption of Barium on
Magnesite... 4^ 4.6 Freundlich Isotherm Plots for the Sorption of Cesium on Magnesite at Various
Temperatures... 4g
4.7 Freundlich Isotherm Plots for the Sorption of Barium on Magnesite at Various
Temperatures...49
4.8 Photoelectron Spectra of Magnesite Before Sorption and Cs and Ba 3d Regions
After Sorption of Cs+ and Ba^+ Ions on M ag n esite... 53
4.9 Variation o f Atomic Concentration Ratio as a Function of Initial Concentration for
for Sorption of Cesium and Barium on M agnesite... 54
4.10 Dubinin-Radushkevich Isotherm Plots for Sorption of Cesium on Magnesite at
Various Tem peratures... 56
4.11 Dubinin-Radushkevich Isotherm Plots for Sorption of Barium on Magnesite at
Various Temperatures... 57
4.12 Variation of R^j as a Function of Temperature for the Sorption of Cesium on
Magnesite ... 65
4.13 Variation of R^ as a Function of Temperature for the Sorption of Barium on
M agnesite...66 4.14 Variation o f Atomic Concentration Ratio as a Function of Temperature for
Sorption of Cesium and Barium on Magnesite ... 71
LIST OF TABLES
1.1 Natural Mechanisms Governing Migration of Radionuclides in Permeable Media 7
1.2 Cation Exchange Capacities for a Number o f M in e ra ls ...8 1.3 Composition o f Typical Natural and Sea-water Magnesite ...18
+ + 2+ 2+
3.1 Ionic Concentrations o f Na , K , Ca , Mg in Bilkent Tapwater ... 30
3.2 Initial Cation Concentrarions of Cesium and Barium Ions used in Studying the
Effect of Concentraion and Temperature on Sorption ... 33
4.1 The Average Values Obtained as a Function of Time for Sorption of Cesium on
M a g n esite ...37
4.2 The Average R^ Values Obtained as a Function of Time for Sorption of Barium on
M a g n esite ...38
4.3 Variation of Atomic Concentration Ratios as a Function of Time for Sorption of
Cesium and Barium on M agnesite... 39
4.4 The Average R^ Values Obtained as a Function of Concentration and Temperature
for Sorption of Cesium on M agnesite... 44
4.5 The Average Values Obtained as a Function of Concentration and Temperature
for Sorption of Barium on M agnesite... 44
4.6 Parameters o f Freundlich Isotherm Fits to the Data for the Sorption of Cesium and
Barium on Magnesite at Various T em peratures... 50
4.7 Variation of Atomic Concentration Ratios as a Function of Initial Concentration for
Sorption of Cesium and Barium on Magnesite ... 52
4.8 Cation Adsorption Capacity (C^) of Magnesite Obtained from D-R Isotherm Model
Using the Sorption Data of Cesium and Barium Ions at Low Concentrations . . 58
4.9 The Linear Correlation Coefficients for Langmuir Least Square Fits to the Sorption
Data o f Cesium and Barium on M agnesite... 59
4.10 Values of the Enthalpy Change, AH°, and Entropy Change, AS° , Obtained from
the Sorption Data of Cesium on Magnesite...62
4.11 Values of the Enthalpy Change, AH°, and Entropy Change, AS° , Obtained from
the Sorption Data of Barium on Magnesite...63
4.12 Values of the Gibbs Free Energy Change of Adsorption, AG°, Obtained from the
Sorption Data of Cesium and Barium on M ag n esite... 69
4.13 Variation of Atomic Concentration Ratios as a Function of Temperature for
Sorption of Cesium and Barium on M agnesite... 70
1. INTRODUCTION
1.1- Radioactive Waste Disposal
Safe disposal o f the radioactive materials that are no longer useful to man is
a big theme in many countries nowadays. The overall objective o f radioactive
waste disposal is to dispose the wastes in a manner which ensures that there is no
unacceptable detriment to man and to the biological environment, as a whole at
present and in the future. Waste confinement by the disposal system should remain
effective until the radionuclides have decayed to acceptable levels, and are no
longer forming a potential hazard to the human environment.
With a sufficient number of natural and man-made barriers, the release of
radioactive materials can be limited or delayed, its transport retarded or its
concentration sufficiently diluted to assure that impact on man will remain within
According to the International Atomic Energy Agency, IAEA, five major
options are valid for underground disposal of radioactive wastes [1]:
1- Disposal in shallow ground
2- Disposal in deep geological formations
3- Disposal in rock cavities
4- Disposal by liquid injection
5- Disposal by hydraulic fracturing
In general safe disposal of radioactive wastes is acheived by [2]:
1- Confinement of the waste in one or more natural or man-made barriers
and thus its adequate isolation from the human environment, in particular fi-om
ground water.
2- Retardation of radionuclide migration if the waste is, or will be, in contact
with ground water or subject to other migration mechanisms.
3- Disposal of the waste at a depth or location where fixture natural or man
Appropriately conditioned wastes may be disposed of in an underground
repository. Conditioning aims at immobilizing the radionuclides and packaging the
waste in order to make it safer for handling, storage, transport and disposal. An
underground repository consists of both natural geological environment and man
made facilities. The geological environment of the repository includes the starta in
which the wastes are emplaced, the surrounding starta and the natural materials of
the land surface. The man made facilities include the excavated cavities, engineered
features within the cavities, backfill and sealing materials, and facilities at or near
the surface which are integral with the function of the underground repository (e.g
engineered barriers to control erosion or waste movement, facilities for handling
wastes etc.)
The function of the underground repository is to provide primary barriers
for controlling possible radionuclide release from the emplaced waste to man so as
to keep them at acceptable levels.
1.2- Groundwater and Radionuclide Migration
One way through which radionuclides could be transported to the biosphere
is by groundwater flowing through a network of fractures in the surrounding rocks.
times of water are sufficiently long in comparison with the half-lives of the
radionuclides [3].
The migration process of the radionuclides by groundwater is affected much
by various parameters . Among these parameters are; the pH, the radox potential,
Eh, the total salinity of water and the concentration of potential complexing agents.
pH determines the degree of hydrolysis and the ion-exchange. Eh determines the
valence state for multivalent waste elements.
The pH of groundwater is influenced mainly by the presence o f carbonates
in the system. In the absence of air. Eh is largely determined by the presence of
minerals containing natural metal redox systems [4].
A large amount of laboratory and field work is being carried out
internationally to study the extent of radionuclide migration. Part of this work
includes the determination of sorption, or distribution coefficients for fission
products and actinides from a wide range of groundwater compositions on various
geological materials. Sorption studies are being carried out on unaltered and altered
rock, on unconsolidated mineral infillings from water bearing fractures and on the
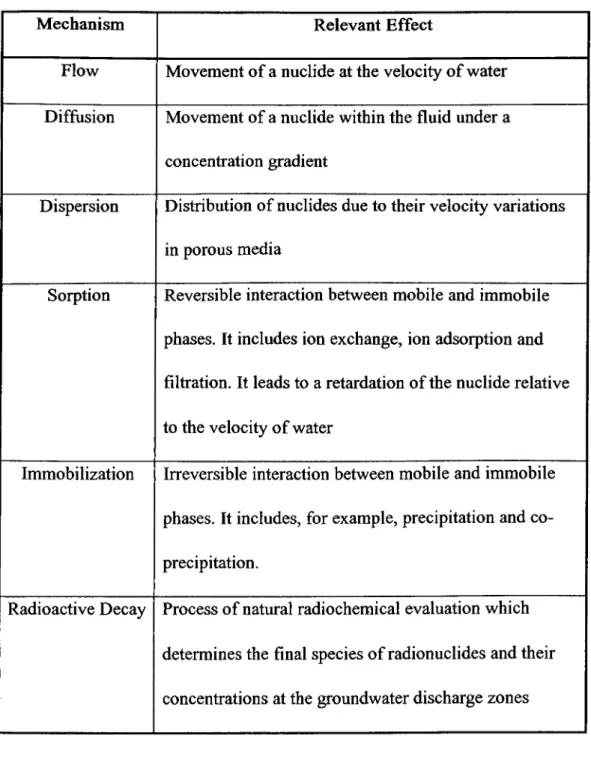
Table 1 gives the different natural mechanisms governing migration of
radionuclides in permeable media [6]. Sorption is one of the mechanisms that govern the migration of radionuclides in groundwater . It can affect radionuclide
concentration and as a result retard or delay their migration into the biosphere. The
sorption or desorption of radionuclides by soil fractions is affected by parameters
like their concentration in groundwater, the contact time, temperature, pH, the grain
size of soil particles, formation of colloids and others.
The terms sorption and adsorption are often used to describe the process by
which radionuclides are removed from solution by a solid phase. Solutes which
undergo sorption are commonly termed sorbates, and the solid phase as, the sorbing
phase or sorbent.
Sorption or adsorption process is usually interpreted as a reversible ion
exchange or surface sorption reaction that can be described by a sorption isotherm.
In general, the sorption process may be classified as [7]:
1.3- The Sorption Process
1- Physical Adsorption:
Non-specific attractive forces between the trace elements and the solid
rapid, pH independent, reversible and relatively independent on temperature and
concentration.
2- Electrostatic Adsorption:
Sorption occurs as a result of coulombic attractive forces between
electrically charged surfaces and ions in solution. Ion exchange is an example of
such kind o f adsorption. This process is rapid, largely reversible, strongly dependent
on the ionic strength and composition of the solution and to a certain extent
temperature dependent.
3- Chemical Adsorption (Chemisorption):
Specific chemical forces involving chemical bonding between the dissolved
component and the solid surface are responsible for this type of adsorption.
Chemisorption is slow, partially irreversible, highly dependent on composition of
the sorbent and concentration of the solute and often strongly temperature
Table 1.1: Natural Mechanisms Governing Migration of Radiouclides in Permeable Media.
Mechanism Relevant Effect
Flow Movement of a nuclide at the velocity of water
Diffusion Movement of a nuclide within the fluid under a
concentration gradient
Dispersion Distribution of nuclides due to their velocity variations
in porous media
Sorption Reversible interaction between mobile and immobile
phases. It includes ion exchange, ion adsorption and
filtration. It leads to a retardation of the nuclide relative
to the velocity of water
Immobilization Irreversible interaction between mobile and immobile
phases. It includes, for example, precipitation and co
precipitation.
Radioactive Decay Process of natural radiochemical evaluation which
determines the final species of radionuclides and their
The process in which cations from natural waters are sorbed by mineral
particles with the concurrent release of an equivalent amount of cations is termed as
cation exchange process. The cation exchange capacity, CEC, of a component is the
summation of the exchangeable cations. It is reported as milliequivalents of cation
per 100 g of mineral. Different methods are proposed for the measurement of CEC
of various minerals [8, 9, 10]. One of the most widely used methods is to measure the uptake of ammonium ions from IM ammonium acetate solution at pH 7. Table
1.2 gives CEC values for a number of materials [11].
1.4- Cation Exchange Capacity
Table 1.2: Cation Exchange Capacities for a Number of Minerals
Material Magnesite Kaolinite Illite Chlorite Humic Acids
CEC(meq/100g) 3-7 3-15 10-40 20-50 170-590
Values for CEC are pH dependent and vary as a function of the ion
accompying the exchange sites. There are several factors that will affect the
1- Quality of clay and silt fractions. The silt fractions generally have an appreciable
exchange capacity.
2- The kind o f clay mineral present. As an example, a small quantity of illite can
give a greater exchange capacity than a larger amount of kaolinite.
3- The amount of organic matter present. Organic matter increases the exchange
capacity irrespectively of the clay mineral present.
4- Cation exchange capacity figures for the clay fractions are only a slight
indication of the clay minerals present when mixtures of clay minerals occur. Hence
the CEC figure should not be used as the only indication of the presence of certain
clay minerals.The data should be supplemented with the x-ray diffraction analysis.
The affinity o f a certain cation, M+, for an exchange site is affected by
several factors, such as [12]:
1- Concentration in solution: As [M+] increases, there is an increase in the
fractional surface covarage.
2- Oxidation state: An increase in the oxidation state of an element favours its accumulation at the surface, the order of affinity being:
M+ < m2+ < m3+
3- Charge density o f the hydrated cation: the greater the charge density, the greater
is the affinity for an exchange site.
1.5- The Batch Technique
The batch technique is widely used in sorption studies which aims at
investigating the effect of different parameters on the sorption behaviour of
radionuclides.
In a batch operation, the adsorbent is contacted with the liquid phase in a
container, for a period of time. The adsorbent is seperated from the liquid by
centrifugation, filtration or settling. The time required to approach equilibrium
condition depends on the concentration of the solute, the amount of solid, the
particle size o f adsorbent and the degree of shaking.
For batch operations, the adsorbent is usually applied in powdered form to
increase the surface area and reduce the diffusional resistance inside the pores.
Agitation o f the suspension improves contact of particles with liquid and decreases
the mass transfer resistance at the surface [13].
The important drawback of batch operation is believed to result from the
continuous creation o f fresh fracture surfaces as a result of shaking. This leads to
increase in the surface areas in contact with the radionuclide solution and hence,
increases the distribution ratio [14].
1.6- The Radiotracer Method
The radiotracer method is widely used in studies o f the sorption
characteristics of radioactive wastes on various minerals. The experimental
procedure consists of spiking a solution containing the stable isotope of a certain
element in the ionic form with the radionuclide of that element, then contacting the
solution with the geological mineral. The radionuclide concentration in an aliquot
o f the solution is monitored periodically during the sorption process. The decrease
in the radionuclide concentration in solution is attributed to sorption by the mineral.
The radioactive isotope added to a solution serves as a tracer because it behaves as
the other inactive isotopes of the same element originally present in the same
chemical form.
The radiotracer method was applied in this study, to examine the sorption
behavior of cesium and barium on magnesite. The two elements posses the
radioactive isotopes (tj/2= 30.17 years) and *‘’®Ba (t,/2= 12.79 day) which are produced in high yields during fission and are important fi'om radioactive waste
management view point.
Previously, a number of studies to examine the sorption properties of cesium
and barium on different clay and soil fractions fi'om various regions of Turkey,
were carried out in the laboratories at BiUcent and at the Middle East Technical
Universities using the radiotracer method [15 - 19].
1.7- X-ray Photoelectron Spectroscopy
X-ray photoelectron spectroscopy (XPS), is one of the most widely used
surface sensitive technique. It comprises a group of techniques in which
photoelectrons emitted fi’om a sample, which is irradiated by electromagnatic
radiation of a suitable wavelength, are seperated on the basis of their kinetic
energies and detected by a photomultiplier device which is then recorded in the
form o f electron yield against the electron energy. In XPS, the irradiating source is
an x-ray beam and the photoelectrons are emitted from the core and valence levels
of the constituent atoms of the sample.
Although originally conceived as an analytical technique, XPS can also give
informations on the 'chemical environment' of constituent atoms. The information
content o f the XPS specrum may be considered in two parts; Elemental
composition and chemical spéciation. XPS is basically a form of atomic
spectroscopy and, as such, it has a clear and well-defined analytical role based on
the positions and sizes of peaks within the spectrum. However, the exact energy
levels of the core and valence electrons respond to their electronic environment and
additional structural or chemical information, may be obtained from binding energy
shifts and spectral fine structure [20].
Application of XPS to sorption studies has shown an increase in the last
decade. A number of studies in which XPS was used for obtaining qualitative and
quantitative analytical informations and/or chemical and structural informations are
available in literature [21 - 27]. XPS technique is really suitable for the study of
sorption reactions for a number of reasons. First and foremost is that it is inherently
surface sensitive. It is particularly versatile because it can detect any element of
geochemical interest except hydrogen, it can be used to estimate surface coverage of
sorbed species or thickness of their precipitate films,and it can provide important
informations on the chemical state of the substrate surface before reaction, and both
the substrate and sorbed species after reaction [28].
1.8- The Present Study
The sorption characteristics of a trace element are affected by a number of
chemical and physical parameters, such as, the radionuclide concentration in
solution, pH and ionic strength of the solution, the surface properties and surface to
volume ratio of the solid phase, time of contact and temperature of the medium.
In the present study, the batch technique was used in examining the effect of
4- 2+
time, concentration and temperature on the sorption behaviour o f Cs and Ba
ions on magnesite by the radiotracer method and x-ray photoelectron spectroscopy,
XPS.
1.8.1- Cations and Their Radioactive Isotopes
Barium is an alkaline earth element, its radioactive isotope i‘*°Ba (tj/2= 12.79 day) is a fission product with a high yield. This radionuclide is a serious
radiocontaminant during the first 100 days when fission products are discharged into the environment. Furthermore, Ba being a homolog of Ra is a suitable cation
for the radiochemical study of Ra, which have several radioisotopes that are
important in waste considerations. ^^^Ba was chosen as a suitable tracer in our
studies because of it long half life (10.7 years) and well observable y-ray of 361
keV energy.
(tj/2= 30.17 years), a product of the nuclear age, is produced by the nuclear fission reaction in high yield. No natural sources of exist, thus its
presence in the environment is due to either nuclear weapons testing or disposal of
the radioactive wastes of nuclear reactors or nuclear accedents like Chernobyl in
1986. i^^Cs is a principal radiocontaminant due to its long half life. It emits a strong
y-ray (662 keV) making its measurement in environmental samples relatively easy
and accurate.
1.8.2- Magnesite
Magnesite is a member of the isomorphous group of minerals that includes
calcite and dolomite. The structure o f magnesite is similar to that of calcite but with
a slightly smaller cell due to the smaller size of magnesium ion as shown in Figure
1.1. Magnesite commonly occurs in veins and irregular masses derived from the
alteration o f Mg-rich metamorphic and igneous rocks through the action of water
containing carbonic acid. Such magnesites are compact, crystalline and often
contain opaline silica. Beds of crystalline cleavable magnesite are (i) of
metamorphic origin associated with talc schists, chlorite schists, and mica schists,
and (ii) of sediamentary origin formed as a primary precipitate or as a replacement
of limestones by Mg-containing solutions, dolomite being formed as an
intermediate product [29].
Magnesite resembles dolomite in being only slightly soluble in cold dilute
HCl, but it dissolves with effervescence in warm acids. It differs from dolomite and
calcite in having higher refractive indices [30].
The mineral magnesite crystallizes in the hexagonal system and has
rhombohedral cleavage. Individual crystals of magnesite are rare and the mineral is
commonly massive. It occurs commercially as crystalline masses, which resembles
marble or coarse-grained dolomite, and as a cryptocrystalline (amorphous ) masses,
which have a dense porcelainlike texture and conchoidal fracture. There is some
variation in color but the mineral is generally white or grayish. The specific gravity
is between 2.9 to 3.1 and hardness ranges from 3.5 to 4.5. Like calcite and
dolomite, magnesite loses carbon dioxide on heating. Calcining at 1450-1750°C
drives off all the carbon dioxide except about 0.5 percent yielding a dense , sintered,
inert product called refractory magnesia [31]. The structure of this resulting product
(MgO) is given in Fig. 1.1(c).
The major deposits of natural magnesite, often associated with limestone
and dolomites, occur in Austria, -previous- Czechoslovakia, Greece, Yugoslavia,
Russia, Canada, the United States, Brazil and North East China.
Sea-water magnesite has largely replaced natural magnesite in countries
where minor deposits of magnesite exist. Sea-water magnesite, used in industry, is
obtained by chemical reactions involving sea-water and calcium hydroxide and
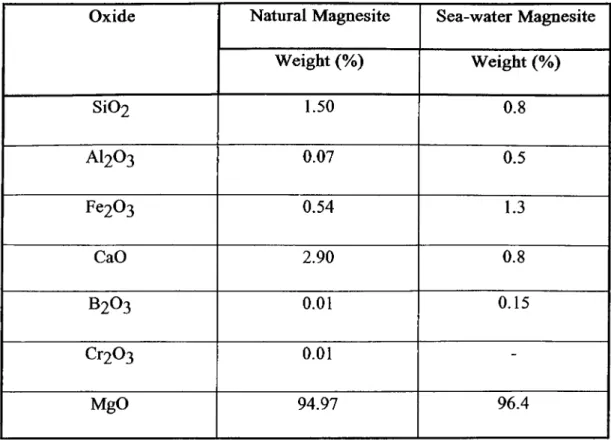
differs slightly in composition from natural magnesite. Compositions of typical
natural and sea-water magnesite samples are given in Table 1.3 [32].
2+
Magnesite, contains a single cation. Mg , that can be exchanged with other
2+
cations. It IS possible that MgC03 loses Mg and accepts instead other divalent or monovalent cations. In addition, if any isomorphous substitution of a Si atom by
another atom (e.g A1) in any array of SiOj tetrahedra structure occurs, a negatively
charged framework will be established. This charge is localized, and relatively
strong surface complexes with cations can be formed [33].
Table 1.3: Composition of Typical Natural and Sea-water Magnesite Samples
Oxide Natural Magnesite Sea-water Magnesite
Weight (%) Weight (%) SÍO2 1.50 0.8 AI2O3 0.07 0.5 Fe203 0.54 1.3 CaO 2.90 0.8 B2O3 0.01 0.15 Cr203 0.01 -MgO 94.97 96.4
18
= 46° 07'
or« = 101° 55'
(c)
Fig. 1. 1: (a) Structure of calcite group (b) The relation of the steep, true unit cell to the cleavage rhombohedron, which is face-centered. A hexagonal cell is also
shown (c) Structure o f refractory Magnesia, MgO.
2. MATHEMATICAL TREATMENT
2.1- The Distribution Ratio
The distribution ratio, R^, of a certain species represents its concentration at
the solid phase to that in the liquid phase:
R
h
msIMm i / V
(
2
.
1)
where mg, ni| are the masses of the nuclide (meq) at the solid phase and in the
solution respectively, M is the mass of the solid phase (g) and V is the volume of
the solution (mL).
In sorption studies, Rj aids in quantifying the extent of retardation of a
certain trace element by the solid phase from solution under certain conditions. In
the experimental determination of Rj, the the behavior of a radioactive isotope is
monitored periodically by measuring its activity in the liquid phase. It is assumed
that the physical and chemical properties of the stable isotope do not differ from
that o f the radioactive isotope for an element, and thus can be used to describe
the behavior o f that element rather than the behavior of the radio-isotope alone.
The equation above relates to a reversible sorption. Yet often a portion of
sorbed nuclide does not desorb, so there is a need to define distribution ratios for
adsorption and desorption separately. The distribution ratio of adsorption, R_, for a
d,ad
component C is expressed as:
R
d,ad
[Cy.ad
[C]ad
(
2
.
2
)
Where [C]g ^d [CJad (meq/niL) are the concentrations of species C in
the solid and liquid phases respectively. At the beginning of the sorption step, V
(mL) of solution with initial concentration [C]° (meq/mL) is used, and at the end of
sorption step V+AWpt (mL) of solution with concentration [CJad are present, hence
the concentration of C in the solid phase after sorption can be expressed as :
[C]s.ad = V [C ]°-iV + AW,„)[C]ad
W., (2.3)
In terms of activity, [CJ^d can be written as
[CJ,. = % i [ c r
(2.4)From (2.1), (2.2), (2.3) and (2.4), the following equation is obtained :
_ VA°-(V + AWp,)A,.aj
At.udWs (2.5)
w here:
A° =initial count rate of solution added for sorption (cps)/mL
Al,ad""count rate o f solution after sorption (cps)/mL
Wg =weight of solid material (g)
^'^pt^^niount of liquid remaining in the tube after pretreatment, before sorption
(g,mL).
2.2- The Atomic Ratio
The elemental content of the samples analyzed by x-ray photoelectron
spectroscopy, XPS, can be identified from the corresponding peaks in the spectrum.
The fact that the intensities of these peaks (their areas) are proportional to the
elemental concentrations of the atoms or ions within the sample forms the basis of
the quantification analysis. In this analysis, first it is necessary to choose an element
whose content remains constant before and after sorption. Then the peak intensities
of the other elements in the same sample are normalized with respect to the
observed intensity o f the chosen element. The atomic ratio can then be calculated
from the observed intensities using the formula [34]:
[A]/[B] - (Ia/Ib) (ob/o a) (Ek(B)/Eit(A))3/2
(2.6)
where [A]/[B] is the atomic ratio of A and B, I is the observed intensity, a is the
tabulated cross section [35], and E|f is the kinetic energy (ht) - B.E) of the electrons
emerging from the analyzed sample.
2.3- Adsorption Isotherm Models
The equilibrium sorption data at a given temperature are usually represented
by an adsorption isotherm, which is a relationship between the quantity sorbed per
unit mass of solid and the concentration of the sórbate in solution. Many theoretical
and empirical models have been developed to represent the various types of
adsorption isotherms. Langmuir, Fruendlich and Dubinin-Radushkevich are the
most frequent isotherm models used for this purpose.
2.3.1- Langmuir Isotherm Model
A simple model of the solid surface is used to derive the equation of this
isotherm. In this model, the solid is assumed to have a uniform surface at which
there are no interaction between one sorbed molecule and another, the sorbed
molecules are localized at specific sites and only a monolayer can be sorbed. The
Langmuir isotherm is given as:
Cv = b. Cm. C
\ + bC (2.7)
where:
Cg : Amount of solute sorbed per unit mass of solid (meq/g)
C : Maximum amount of solute sorbed by the solid (meq/g)
m
C : Equilibrium concentration of solute in solution (meq/mL)
b : A constant related to the energy of sorption
When the sórbate concentration becomes very low, the equation approaches
linearity.
The equation above may be rearranged to lead to the linear form:
Q. = Cm- —
bC (2.8)
By plotting Cg versus Cg/C, a straight line is obtained. The slope of that line gives
1/b and the intercept gives C . The distribution ratio, R., can be obtained by
m d
rearranging the above equation to give:
Ra =
bCm
l + bC (2.9)
2.3.2- Freundlich Isotherm Model
Fruendlich isotherm is the most widely used non-linear model for
describing the dependence of sorption on concentration. The general expression can
be written as:
C g = k C ,
(
2.
10)
where:
C : amount of solute sorbed per unit weight of solid (meq/g) s
C] : equilibrium solute concentration (meq/mL)
k and n: constants
The expression above can be linearized to give:
Cg = log k + n log C| (2.11)
Plotting log Cg versus log C| yields n as the slope and log k as the intercept.
Freundlich isotherm model allows for several kinds of adsorption sites on
the solid, each kind having a different heat of adsorption. The Freundlich isotherm
represents well the data at low and intermediate concentrations and is a good model
for heterogeneous surfaces.
Equation (2.10) can be rearranged to give the disrtibution ratio, R j :
Rd = kC,n-1 (
2
.12
)2.3.3- Dubinin-Radushkevich Isotherm Model
This isotherm resembles Langmuir isotherm in being applicable at low trace
concentrations, but differs in not requiring homogeneous adsorption sites. The
equation is given as:
Cg=C exp-(K£2) (2.13)
where
£ : Polanyi potential, RTln( 1+1 /C)
C : solute equilibrium concentration in solution (meq/mL)
R : gas constant
T : absolute temperature (K)
K : constant
· sorption capacity of adsorbent per unit weight (meq/g)
Cg : observed amount of solute sorbed per unit weight (meq/g)
The linear form of the equation above may be obtained by rearranging it to
give:
lnCg = lnC -K£2 (2.14)
If In Cg is plotted against 8^, K and In will be obtained from the slope and the
intercept, respectively. Equation (2.13) may be written in a form that gives R :
R =(l/C )C „exp-(K £2) (2.15)
2.4- Thennodynamic Relationships
Gibbs Free energy change ( kJ/moL) is defined for a chemical process by the
following equation:
^ G = ^ G ‘’ + R T \ x \ K (2.16)
where R is the gas constant , T is the absolute temperature (K) and K is the
equilibrium constant. If the distribution constant is used as an equilibrium constant,
where AG becomes zero, then the following equation can be written:
^G‘’=-RT\nRu
(2.17)In literature , another expression of AG° exists. This expression relates Gibbs free
energy change to the enthalpy and entropy changes. The equation is given as:
AG° = AH° - TAS° (2.18)
If equations (2.17) and (2.18) are equated and rearranges for In Rj , the following
expression can be obtained :
InRj = A S " A H "
R R T
(2.19)
where R is the gas constant (=8.314 J/mole.K)
Equation (2.19) approximates Rj as a fully equilibrium constant and
assumes the enthalpy to be constant within the entire temperature range. This
equation was used by many authors [36, 37, 38] in the determination of the enthalpy
and entropy changes, and it was applied in our thermodynamic calculations for the
same purpose. Plotting In Rj vs (1/T), the enthalpy change can be determined from
the slope and the entropy change from the intercept. For the determination of
Gibbs free energy o f adsorption (AG°), equation (2.17) was used.
3. EXPERIMENTAL
3.1- Analysis o f Bilkent Groundwater
Bilkent tapwater -as a substitute for groundwater- was used in the
pretreatment of the mineral samples which were used later in the radiotracer studies.
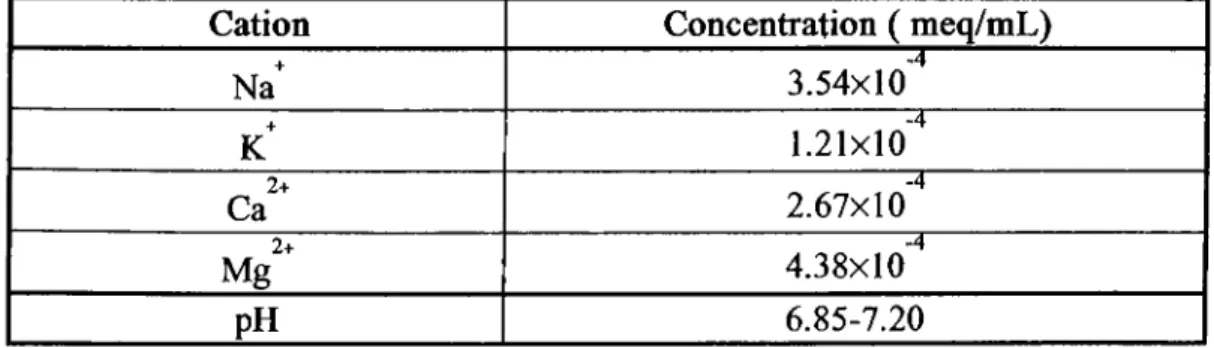
+ + 2+ 2+ the concentrations of each of the primary cations N a , K , Ca and Mg in
tapwater was determined by atomic absorption and atomic emission spectrometries
in analytical chemistry laboratory at METU. Table 3.1 gives the concentrations of
these cations.
+ + 2+ 2+
Table 3.1: Concentrations of Na , K , Ca and Mg Ions in Our Laboratory Tapwater Used in Sorption Studies
Cation Concentration ( meq/mL) T · Na 3.54x10 K 1.2 1x 10 2+ Ca 2.67x10 Mg2+ 4.38x10 pH 6.85-7.20 30
3.2- Experiments Using the Radiotracer Method
3.2.1- Pretreatment o f Magnesite Samples
The pretreatment step aimed to mimic the equilibrium situation of the
magnesite samples with groundwater prior to sorption experiments. Tubes were first
cleaned, dried at 60°C overnight, cooled and weighed. 30 mg of magnesite and 3
mL of our laboratory tapwater as substitute for groundwater were added into each
tube that were then shaken for 4 days with a lateral shaker at 125 rpm. The shaker
provided continuous shaking of the thermostate in which the tubes of samples were
placed. Samples were then centrifuged at 6000 rpm for 30 minutes and the
supernatant phases were discarded. Each tube was weighed again, and from the
weight difference the amount of water left after pretreatment (AWp^) was
determined. The pretreated solid samples were later used in the sorption
experiments carried out by the radiotracer method.
3.2.2- Isotopic Tracers
The tracers used in the sorption experiments carried out by the radiotracer
method were ‘^'^Cs with a specific activity of 5325 Bq/mL and *^^Ba with a specific
activity of 1126 Bq/mL. Appropriate amounts of stable isotopes solutions were
spiked with the corresponding radionuclides solutions used in the different
experiments. The count rates of the particular peaks for the two solutions were
measured as 3901 cpm for 3 mL cesium solutions and 3957 cpm for 3 mL barium
solutions.
3.2.3-Kinetic Studies
-3 + -4
To each of the samples, 3 mL solutions (1x10 meq/mL of Cs and 1x10
2+
meq/mL of Ba ), prepared from CsCl and BaCl2.2H20 salts, with appropriate amounts of ‘^"^Cs or i^^Ba radiotracers were added, separately. Sample tubes were
shaken at room temperature for periods ranging from half an hour to eight days.
Samples were then centrifuged and 2 mL portions of the liquid phases were counted
using a Spectrum 88 instrument with a calibrated Ge detector connected to a multichannel analyzer.
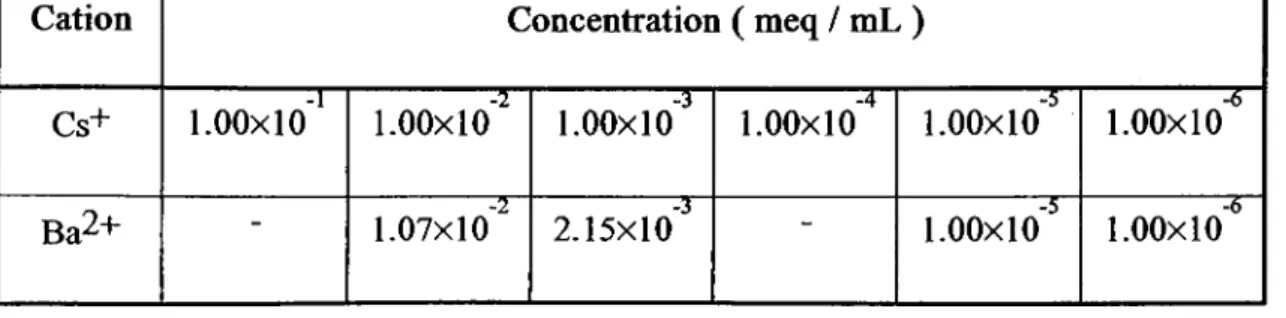
3.2.4- Studies o f the Sorption Isotherms at Different Temperatures
The effect of concentration and temperature on sorption was studied for
each of the initial cation concentrations given in Table 3.2. Experiments were
carried out at four different temperatures : 30, 40, 50 and 60°C. Three mL of the
cation solution of interest containing an appropriate amount of radiotracer was
added to each sample tube containing 30 mg of magnesite at the desired
temperature. Temperature was maintained constant using a thermostated water bath.
The samples were shaken for one day, centrifuged and 2 mL portions of the liquid
phase were counted.
+ 2+
Table 3.2: Initial Cation Concentrations of Cs and Ba Used in Studying The Effect of Temperature on Sorption
Cation Concentration ( meq / mL )
Cs+ 1.00x1 o'* l.OOxlO'^ l.OOxlO’" l.OOxlO''’ 1.00x1 o'" LOOxlO"^
Ba2+ “ 1.07x10'^ 2.15x10''’ “ l.OOxlO'^ l.OOxlO'*^
3.3- Studies Using XPS
The XPS technique was used in this study to carry out qualitative and
quantitative analysis o f the extent of exchange in the samples. Spectra of the
samples were recorded using a KRATOS ES-300 spectrometer with A1
(h\)= 1486.3 eV) source. Samples were introduced as powders pressed on adhesive
copper tapes, and the pressure in the analyzer chamber was kept below 10”^ torr during analysis. For calibration purposes C Is line (B.E =285.0 eV) was used. This
peak arised in the spectra as a result of residual or deposited hydrocarbons on the
surface. Silicon content was assumed to be constant before and after the exchange,
therefore Si 2p peak was used to normalize the intensity of the peaks belonging to
other elements.
3.3.1-Kinetic Studies
Three mL portions of O.IM Cs+ or Ba2+ solutions were added to 30 mg
magnesite samples. Exchange was carried out at room temperature for periods
starting from an hour up to several days. Mineral samples were then filtered and
dried at 60°C for 24 hours. Then the XPS spectra were recorded. Cs and Ba 3d5/2
peak areas were used to calculate the atomic concentrations of each species in the
samples.
3.3.2- Loading Experiments
To 30 mg magnesite samples 3 mL portions of solutions containing 1, 0.1,
0.01, O.OOIM Cs or Ba cations were added in each case. Exchange was carried at
room temperature by shaking for one day. Samples were then filtered, dried and
their XPS spectra were recorded.
3.3.3- Experiments at Different Temperatures
To study the temperature effect on sorption, experiments were done at 30,
40, 50, 60 and 70°C . Three mL O.IM cation solutions were added to 30 mg
magnesite samples both of which were previously brought to the desired
temperatures and samples were shaken for one day. The phases were then separated
by filtration, dried and the XPS spectra were recorded.
4. RESULTS AND DISCUSSIONS
4.1- Kinetic Studies
The sorption kinetics of Cs^ and ions on magnesite were studied by the
radiotracer method and x-ray photoelectron spectroscopy, XPS, in order to
determine the time required to approach the equilibrium state. This equilibrium time
was later used as a fixed parameter in the studies carried out to examine the effect
of other parameters on the sorption process. The results of the experiments carried
out by the radiotracer method were expressed in terms of the distribution ratio, Rj.
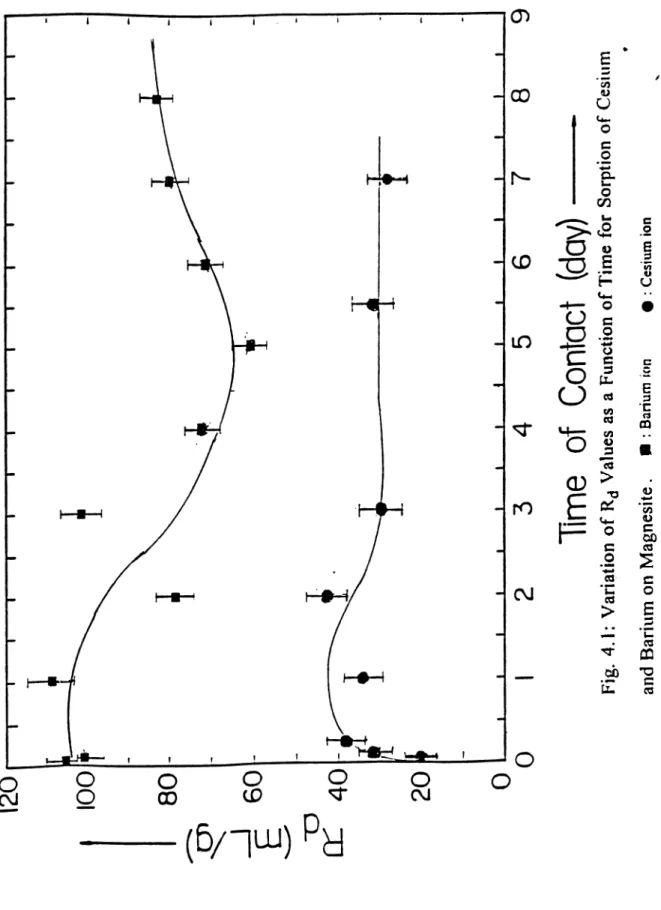
These results are given in Tables 4.1, 4.2 and plotted in Fig. 4.1 for Cs^ and Ba^^
ions respectively.
The results show that equilibrium is approached within about a day of
contact for both cases. In the Cs sorption case, the Rj values show an exponential
increase in the first hours of contact, followed by a slight decrease leading to
an equilibrium
Table 4.1: The Average Rj Values Obtained for the Sorption of Cs^ on Magnesite as a Function of Time Time o f Contact Rd (mL/g) 1 hour 21 ± 4 2 hours 31 ± 4 6 hours 38 ± 5 1 day 35 + 5 2 days 43 + 5 3 days 30 + 4 5 days 32 + 5 7 days 28 + 5
plateau. In the Ba sorption case, however, the equilibrium plateau is not clear as
such and the Rj values vibrate up and down before arriving to the equilibrium
value. Such a behavior indicates that in the first hours of sorption, rapid
accumulation of the sorbates on the sorption surface occiu·, followed by desorption
of a small portion of the solutes and diffusion of the others toward the sorptive sites
so that equilibrium is approached. Fig. 4.1 shows that this process is faster in Cs
case than it is in the case of Ba.
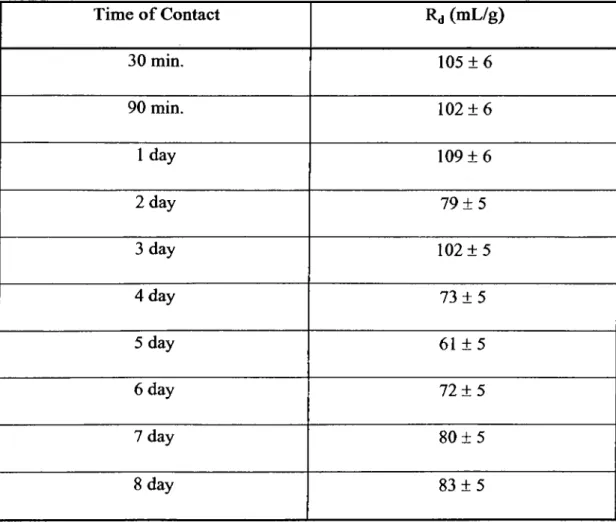
Table 4.2: The Average Rj Values Obtained for the Sorption o f Ba^^ ion on Magnesite as a Function of Time
Time o f Contact Rd (mL/g) 30 min. 105 + 6 90 min. 102 + 6 1 day 109 ± 6 2 day 79 ± 5 3 day 102 + 5 4 day 73 ± 5 5 day 61 ± 5 6 day 72 ± 5 7 day 80 + 5 8 day 83 + 5
The experimental results of the XPS analysis were expressed in terms of the
atomic concentration ratios calculated from the peak intensities which are then
corrected for the kinetic energies and the cross sections as given in section 2.2.
The atomic ratios are given in Table 4.3 and plotted against time in Figs.
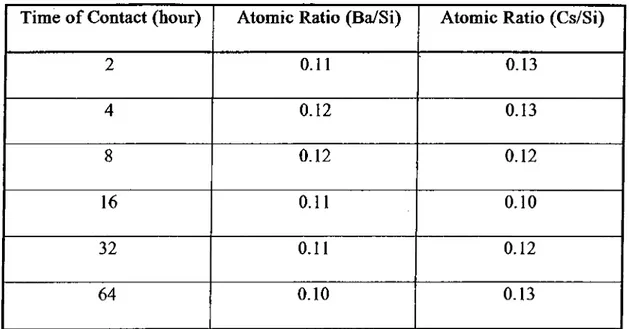
4.2 and 4.3 for the sorption of Cs^ and Ba^^ ions respectively. The behavior of the
curves obtained by XPS method are similar to those obtained by the radiotracer
method. Due to higher initial concentrations, somewhat shorter times o f saturation
were observed.
The rapid approach of equilibrium in both cases indicates that fast sorption
steps are envolved and suggests that ion-exchange at the surface might be the
dominating sorption mechanism.
Table 4.3 : Atomic Concentration Ratios as a Function of Time for The Sorption of
2+
Cs and Ba on Magnesite Obtained by XPS Studies
Time o f Contact (hour) Atomic Ratio (Ba/Si) Atomic Ratio (Cs/Si)
2 0.11 0.13 4 0.12 0.13 8 0.12 0.12 16 0.11 0.10 32 0.11 0.12 64 0.10 0.13 39
4^ O F ig . 4 .1 : V a ri a ti o n o f R j V a lu e s a s a F u n c ti o n o f T im e f o r S o rp ti o n o f C e si u m a n d B a ri u m o n M a g n e si te . · : B ar iu m i on · : C es iu m i on
T
im
e
(h
ou
r)
F ig . 4 .2 : V a ri a ti o n o f A to m ic C o n c e n tr a ti o n R a ti o a s a F u n c ti o n o f T im e fo r S o rp ti o n o f C e si u m o n M a g n e si te-P^ to
Ti
me
(ho
ur
)
F ig . 4 .3 '· V a ri a ti o n o f A to m ic C o n c e n tr a ti o n R a ti o a s a F u n c ti o n o f T im e fo r S o rp ti o n o f B a ri u m o n M a g n e si te4.2— Concentration and Temperature Dependence o f Sorption
4.2.1- Loading Curves
The experimental values o f the distribution ratio, R^, obtained by the
2+
radiotracer method for the sorption of Cs and Ba ions at different initial
concentrations and different temperatures are given in Tables 4 .4 ,4 .5 and plotted
versus the cation loading in Figs. 4.4 and 4.5 respectively.
In Fig. 4.4, the loading curves show characteristic inverse S-shapes at all
temperatures, suggesting that two different sorption sites on the solid matrix are
present. This implies that cesium ion is sorbed via two mechanisms each
corresponding to a different equilibrium constant. One equilibrium constant refers
to a range o f high values, which most probably represent sorption at or near the
surface of the solid matrix. The second equilibrium constant, however, corresponds
to a range o f lower R^ values that are supposed to refer to sorption on sites that lie
inside the solid matrix. The R^ values obtained for the different cesium
d
concentrations decrease as the sorption temperature increases. In the case of barium
ion sorption. However, a single sorption site is suggested as shown in Fig. 4.5.
Furthermore no significant temperature dependence of isorption was observed and
R values show a constant plateau , then start to drop sharply upon increase in
d
concentration.
Table 4.4 : The Experimental Values o f (mL/g) for the Sorption of Cs on Magnesite at Different Initial Concentrations and Temperatures
Concentration Ra (mL/g) (meq/mL) 303 K 313 K 323 K 333 K 1 xlO"' 1 7 ± 6 15 + 6 5 + 4 5 + 4 1 xlO'^ 24 ± 5 12+7 8 + 6 5 + 4 1 xio"" 28 + 7 28 + 6 20 + 6 9 + 6 1 x i o “ 102 + 9 50 + 7 23 + 6 15 + 6 1 xlO'" 132+10 89 + 9 52 + 7 65 + 8 -6 1 xio 225 + 14 170+ 12 127+10 72 + 8 2+
Table 4.5: The Experimental Values o f (mL/g) for the Sorption of Ba on Magnesite at Different Initial Concentrations and Temperatures
Concentration Rd (mL/g) (meq/mL) 303 K 313 K 323 K 333 K 1.07x1 o'" 18 + 7 15 + 6 19 + 6 10 + 6 2.15 X lO’^ 84 + 9 51 + 8 41 + 7 41 + 8 1.00 X lO'' 8 3 + 1 0 70+ 10 76+ 10 6 1 + 9 1.00 X lO'^* 130+13 118+12 105+12 93+11
44
-4 -3 -2
L
o
g
LC
s]
,
0 F ig . 4 .4 : V a ri a ti o n o f a s a F u n c ti o n o f C a ti o n L o a d in g fo r th e S o rp ti o n o f C e si u m o n M a g n e si te O :T *= ^0 °C ♦ :T = 5 0 °C # :T = 60 °C5 0 0 “1- -r T- -r o 1 0 0 E TD 0 ^ 10 -5 -4
-I
0-3
-2
L
o
g
r.
B
a]
s
-F ig . 4 .5 . V a ri a ti o n o f R j a s a F u n c ti o n o f C a ti o n L o a d in g fo r th e S o rp ti o n o f B a ri u m o n M a g n e si te O -F = 3 0 °c O :T= 40' ’c ♦ :T = 50 “c • t =6 0‘ ’C
4.2.2- Freundlich Isotherms
Freundlich isotherm plots of the data obtained by the radiotracer method for
4- 2+
the sorption of Cs and Ba ions on magnesite are shown in Figs. 4.6 and 4.7
respectively. As seen in the plots, Freundlich type isotherms provide an adequate
description o f the sorption behavior for all concentrations at different temperatures.
The results o f the least square fits to the experimental data together with the
linear correlation coefficient values (L.C.C) are given in Table 4.6. A higher value
of the constant k indicates higher sorption affinity for ions in solution, whereas a
higher value o f n suggests higher sorption intensity. The numerical value
of n (< 1.0), suggests that the surface of the sorbent is of heterogeneous nature [39]. At the limit when n equals unity, the sorption is said to be linear and the
constant k becomes equivalent to the distribution ratio, R^.
o o
‘
0
toto
U-I
c n -2Q
-3
-4
5
-7
-6
-5
-4
-3
L
o
g
[
C
s
]
l
-2-I
0
F ig . 4 .6 . F re u n d li c h Is o th e rm P lo ts f o r th e S o rp ti o n o f C e si u m o n M a g n e si te at V a ri o u s T e m p e ra tu re s ■ :T “ 30 ‘’C # :T -4 0 ° c O :T = 50 ® c O : T = 60 °CFi g . 4 .7 : F re u n d li c h Is o th e rm P lo ts fo r th e S o rp ti o n o f B a ri u m o n M a g n e si te a t V a ri o u s T e m p e ra tu re s ■ :T -3 0 * c • :T “ 4 0 “C □ ; T -5 0 '’C O :T = < i0 '’C
Table 4.6: Parameters for the Freundlich Type Isotherm Fits to the Data for the
2+
Sorption o f Cs and Ba Cations on Magnesite at Different Temperatures
T Cs^ Ba^^ (K) k (meq/g) n L.C.C k (meq/g) n L.C.C 303 7.9 0.77 0.998 16.2 0.87 0.991 313 4.0 0.75 0.999 10.4 0.85 0.995 323 2.4 0.74 0.999 9.1 0.81 0.997 333 1.8 0.74 0.995 5.9 0.80 0.992 2+
It is interesting to observe that Ba ion, has both higher affinity and higher
•f ^ + 2+
sorption intensity than Cs ion. The sorption o f both of Cs and Ba ions at the
same concentration is affected by two factors each acting in opposing directions.
The first factor is the oxidation state and the second is the charge density of the
hydrated ion. As was mentioned previously in section 1.3, an increase in the
oxidation state favours the accumulation of the ion on the sorption surface leading
2+
to electrostatic stability, the thing that enhances the sorption o f Ba relative to that
of Cs^. In contrast, the size of the hydrated barium ion is larger than that of cesium
ion which is likely to be sorbed as 'naked' cation owing to its low hydration energy
[40], the thing that hinders the sorption o f the former cation . The results obtained
for n and k shows that the effect o f the first factor exceeds that o f the second,
slightly in the case of G s* and Ba^'^ ions sorption on magnesite.
Furtheremore, the n value o f both species seems to be very slightly dependent on
2+ +
temperature. The k values of both Ba and Cs show however a drastic decrease
with increasing temperature. The decrease for the latter is more pronounced,
indicating that stability o f Cs sorption at higher temperatures is less than that of
Ba2+
Fig. 4.8 shows an XPS spectrum o f magnesite before sorption and the
2+
relevant regions of the spectrum after Cs and Ba sorption. Mg A refer to KLL
2
-Auger lines o f Mg and one C Is peak arrises from CO^ (the other one is due to
the presence o f some hydrocarbons). These peaks originate from the major
component of magnesite, MgCO^. Si 2s and 2p peaks belong to quartz, the minor
component o f magnesite. The peaks of Cs and Ba refer to the photoemission of
3d^^^ and 3dj^^ electrons. The area of these peaks were used in expressing the
amounts o f Cs and Ba ions sorbed in terms of the cation concentration ratios.
The loading experimental results obtained by XPS are given in Table 4.7 in
terms of the cation concentration ratios and plotted in Fig. 4.9. It is seen that the
amount of cations sorbed increases with increasing initial concentration. The
increase in the cation concentrations is nonlinear for Cs and Ba ions sorption, the
thing inline with what have been shown by Fruendlich isotherms.
Table 4.7: The Atomic Concentration Ratios of Cesium and Barium Ions Obtained as a Function o f Initial Concentration Using XPS technique
Concentration (M) Atomic Ratio (Cs/Si) Atomic Ratio (Ba/Si)
1.0 0.21 0.19
0.1 0.12 0.088
0.01 0.076 0.068
0.001 0.053 0.049
Ln U) 7 0 0 6 0 0 5 0 0 4 0 0 3 0 0 2 0 0 10 0 B in d in g E n e rg y (e V ) F ig . 4 .8 : P h o to e le c tr o n S p e c tr a o f M a g n e si te B e fo re S o rp ti o n a n d C s a n d B a 3 d R e g io n s A ft e r S o rp ti o n o f C s+ a n d B a 2 + I o n s o n M a g n e si te


![Bitkisel ve mikrobiyal kökenli preparatların kültür mantarı [Agaricus bisporus (Lange) Imbach]’nda yaş kabarcık (Mycogone perniciosa) ve kuru kabarcık (Verticillium fungicola) hastalık etmenlerine etkilerinin in vivo ve in vitro koşullarında değerlendiril](data:image/gif;base64,R0lGODlhAQABAIAAAP///wAAACH5BAEAAAAALAAAAAABAAEAAAICRAEAOw==)