ee
^/
Ú .8 J·SX
'
¡89
S
H d • « 5 ·· w .,'· i“-* · . - *· C fЖ>и
¥Ш
^Ш
М<3
¥
JO
%і М^ хШ і£ 'Л !? Ж ! ^â - JO İiî fİs ffT FiS ^r îri J ' “ У u ,?^ ï'ü . £ ^.'·* ХІШ Шк ШП.и
ч УТТ
Т в, ,
£ C
m sM
k$
iw
mm
mm
кш
ішкш
ш
AN INVENTORY MANAGEMENT SYSTEM
EOR
THE PURCHASING DEPARTMENT OF
BILKENT UNIVERSITY
A THESIS
SUBM ITTED TO THE DEPARTMENT OF MANAGEMENT
AND GRADUATE SCHOOL OF BUSINESS ADMINISTRATION
OF BILKENT UNIVERSITY
IN PARTIAL FULLFILLM ENT OF THE REQUIREMENTS
FOR THE DEGREE OF
MASTER OF BUSINESS ADMINISTFiATION
By
T u r a i i T U R H I I L I
δ
H P
Т 8 Гİ 3 9 İ
')Ч‘, ' ы \j \JI certify that I have read this thesis and in my opinion It Is
fully adequate, in scope and in quality, as a thesis for the
degree of Master of Business Administration.
0
■- \ IYrd. Doç. Dr. Can Şımga
I certify that I have reao this thesis and In my opinion 1t is
fully adequate, in scope and in quality, as a thesis for the
degree ,''f Master of Business Administration.
V /
Yrd. Doç. Dr. Dilek Yeldan
I certify that I have read this thesis and In my opinion It Is
fully adequate. In scope and In quality, as a thesis for the
degree of Master of Business Administration.
Yrd. Doç. Dr. Erdal Erel
Approved for the Graduate School of Business Administration.
‘
a
' < 5 ^
ABSTRACT
AN INVENTORY MANAGEMENT SYSTEM
FOR
THE PURCHASING DEPARTMENT OF BILKENT UNIVERSITY
By
Turan TURANLI
Supervisor; Assist. Prof. Erdal EREL
May, 1991, 59 Pages
ABC
Classification
enables management to establish
an
effective inventory management system. The Economic Order
Quantity (EOQ) model minimizes the costs associated with
ordering items and holding stocks. This study applies the ABC
method and the EOQ model to examine the inventory profile of
Bilkent University so that it will aid management in lowering
inventory costs and controlling stocks more effectively.
Keywords: Inventory Control, ABC Inventory Classification,
Stock Keeping Unit, Distribution By Value.
ÖZET
BILKENT ÜNİVERSİTESİ ALIMLAR MÜDÜRLÜĞÜ
İÇİN
ENVANTER YÖNETİM SİSTEMİ
Tutan TURANLI
Yüksek Lisans Tezi, İşletme Enstitüsü
Tez Yöneticisi: Assist. Prof. Erdal EREL
Mayıs 1991, 59 Sayfa
ABC Envanter sınıflandırması yönetime etkin bir stok kontrol
sistemi kurma imkanı tanır. Bu sistemde, Ekonomik Sipariş
Miktarı (ESM) modeli, stokların teminindeki ve saklanmasındaki
maliyetleri en aza indirger.
Bu çalışma, ABC metodunu ve ESM
modelini
Bilkent
üniversitesi’nin
envanter
profilini
incelemekte
kullanarak,
yönetimin
stok
maliyetlerini
azaltmasına ve stokları daha etkin kontrol etmesine yardımcı
olacaktır.
Anahtar Kelimeler': Stok Kontrol, ABC Envanter Sınıflandırması,
Stok Birimi, Değer Dağılımı, Ekonomik Sipariş Miktarı.
ACKNOWLEDGEMENTS
I gratefully acknowledge patient supervision and helpful 1
comments of Assist. Prof. Erdal Erel. I would also like to
express my thanks to Assist. Prof. Dilek Onkal and Assist.
Prof. Can §imga for their valuable suggestions.
TABLK OK CON'rKNTS
ARSTKACT ... İ Ü
ÖZKT ... iv
ACKNOWLKDiiKMKNT ...
v
TABÎ,K OK (X)NTKNTS ... vi
LIST OK TABLKS ... viii
Ü S T OF FÎOURKS ... viii
1. INTRODliCTTON ...
1
1.1 Prublem Def ini Lion ...
1
1.2 Purpose' of lh(i Thesis ...
2
1.3 Outline of t;Iie Thesis ...
3
2. LITKHATURK SDRVKV ...
5
2.1 The Inventory Concept ...
5
2.2 Functions of lnventor‘
y ...
5
2.3 Objectives of inventory Management ...
7
2.‘
1 Requirements for Kffective Inventoi*y Management .
8
2.1.1 Invent.oi'y Costs....,...
10
3. METHODOLOGY ... 13
3.1 Making ABC Classification ... 13
3.1.1 Control
(;f Class A I terns ...
15
3.1.2 Cont.rol
of Class B I terns ... 16
3.1.3 (’
oiitrol
of (Mass C Items ...
17
3.2 D(M (*rmi n i ng Order Quantity ... 17
3.2.1 Economic Order Quantity Model ... 17
3.2.2 EOQ Model Under Inflation ... 20
Dec i (I i ni' Klirii lo O r d i T ... '¿'L
■
1
. AN AIMMJCATION: Tilt: FlJl'iClIAS I NO DEPARTMENT ...24
4.1
Ci.li rent S i t . u a L i o i i i n D ie DepafLmenL ...24
1.2
Dili a C() I I ('cl ion ...24
4.3
The C l a s s i r i c a l i on ...25
1.1
KOQ and ROP ...26
4.5
R e s u l t s ...27
5
. CONCT.USION ...30
A P P E N D IC E S :32
TAIil.l·:1
33
TABLE2
42
F I CURE I ...49
REFERENCES ...50
V I 1I,I ST 01' TABLES
TAHI,K 1
TABf,E 2
I II V e i l lor y Li st...
lii.'order Poi nt s of Items 42
33
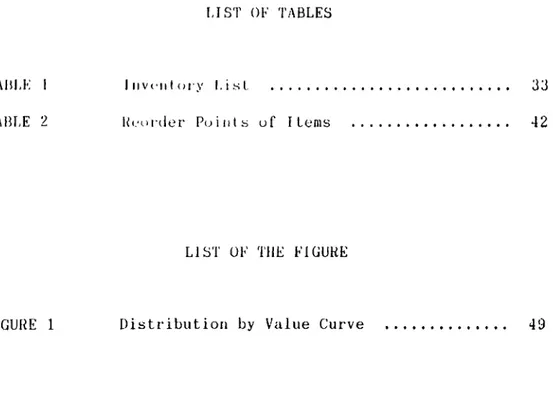
LIST OF THE FIGURE
FIGURE 1
Distribution by Value Curve
49
1. INTRODUCTION
1.1 PROBLEM DEFINITION
'riie Purchasing Department oT Bilkent University concerned with
inventoi'y managiiincnt. is facing (he problems of high inventory
costs and inefficient service for orders placed by the various
depar(ment.s cd' the university.
The
Pur’
chasing Deijiir* tmen t is often unable to meet
the
raaju i r'emcfiit s of the other- de])cir tmen ts because of its inability
to predict demand therciby causing shortages of certain items to
occur. This gives rise to complaints from the other departments
in the university
in order to prevent tliese complaints,
tlie department invests
moi(‘
money and keejjs larg(*r i n ven (.or i es Ilian actually needed,
'flu' dc‘
partaneni, ¿ilso points out, that by doing so, it takes
acccjunl (;f Uie inflationary trends in the country. Therefor*e,
it believes that investing more for inventory is profitable. In
fact, this may not b(* 1 he* case siru:e it. is not, obvious that
prices of items in inventory will increase more than the
inflation rate, and also because Bilkent University is not a
pi-of i t-making organization.
Financial management in the university knows that if more money
is invested in inventory, then less funds will be available for
other investments. Therefore, its aim is to strive for lower
i riven tory 1 ('ve 1 s .
The requirements for less inventory costs, on the one hand, and
the ability of ju-oviding an order immediately, on the other
hand, poses the problem of finding an optimum point between
U
k'
scít wo objt*stives.
An cx¿im i nat. i on of the features of inventories shows that
- I terns held in inventory can differ in cost, weight, volume,
color or physical shape.
- Demand for items can occur in many ways, items may be
witdidrawn from inventory by the thousands, by the dozen, or
unit by unit.
I terns can be substitutes or complements with each other.
_ Goods also arrive for inventory by a variety of modes and in
(jiiantities that are different from the way they will be
eventually demanded,
Decision making in inventory management is therefore basically
a problem of coping with large numbers of items and with a
diversity of factors external and intenial to the organization.
1.2 PURPOSE OF THE THESIS
The purpose of this thesis is to apply the ABC inventory
classification as a basis for designing an individual item
decision model, order point, and order quantity systems, which
will minimize inventory costs in the Purchasing Department in
order to help and solve its difficulties in managing the great
numbers of inventory items.
The total number of items is approximately 400 and the only
control system is the annual physical counting of the items,
(hirrently, the IHirchasing Department purchases goods four times
a yecir and determines order quantities of purchased goods on
judgemental basis, depending on their past experiences. This is
a
time consuming task, and makes it impossible to minimize
i nventory costs.
This study will (*nal)lfi management to use ¿inalytical techniques
in solving some of the problems encountered, liowever, it is not
a (.auiii) 1 id (? so In Id on becciuse of the following recisons:
Kii'st, this is Llie first stage of imijlementirig an inventory
managcancMit systaMU. Siicond, a major* gap exists between the
theoretical solutions and the real world problems. Therefore,
tli('i*e will always be room foi* pe r*sona 1 i zed , tes ted-in-prac t i ce
a[)i)i*oaches 11.) fill I I
k* gai)s in tlieoi*y (1).
(.’
urr'cn 1 1 y , a continuous ('ontrol system for* the inventor*y is
being develo[)ed as a separate software which will make up-to-
date inventor’
y data available in the university. This will
(uiable management to use this study more effectively.
1.3 OUTLINE OF THE THESIS
This thesis consists of two main parts; theory and application.
Tlie second chapter is an overview of the theory and considers
tdie inventory concept and functions of inventory. Then, the
objectives of inventory management from the perspective of
different level of managei*s, and factors influencing the
decision systems are explained. The third chapter describes the
AlU’
classification
as a basis for designing individual item
decision models,
and controlling each class of items. At the
end of the chapter, we tr*y to find answers to the questions of
”li()W many and when to order”.
The fourth chapter is concerned with the practical applications
of
the (heoiy in the Purchasing Department of
Bilkent
University. Tlu." piocedure for data collection followed by the
c I ass i I'i cal i on is given, tlien, order quantities and reorder
points are determined and the results are evaluated.
In the last, cdiajilcr, i nq)! i cat ions of the results are described
and some recommendations for improvement of the system are
given.
2.
LITERATURE SURVEY
2.1. THE INVENTORY CONCEPT
The slock of goods on hand at a given time is called inventory.
Coods arc slocked for shori.-term before being converted into
sales or into use.
Since inventories are produced, used or
distribut(‘
d by (‘
ver'y organization, the control of inventory is
a common problem to all organizations in any sector. Not only
profit-making organizations but also nonprofit and social
institutions have inventory problems. Inventories are common to
farms,
maimf a d urers,
hosp i tais,
retailers,
prisons,
universities, wholesalers, zoos, national states, and local
governments (2).
A review of Turkish industry balance sheets reveals that, on
average, ‘
10-50 percent of total assets and 80-90 percent of
woi'king
cai^ital of a typical company are
invested
in
inventories. For many firms, inventory costs are approximately
as large as before-tax opcM-ating profits. On an aggregate
national basis, the total investment in inventory represents a
sizable iiortion of the gross national product. Thus, we see
that even a small percentage reduction in costs will be
transformed into a huge ¿ibsolute savings, when viewed from a
micr*o oi‘
maci-o perspective (1).
2.2 f^UNCTlONS OF INVENTORY
Inventory is necessary for organizations because supply and
demand may not be eciual in a given time period. For several
reasons, supply and demand differ so that they provide and
require stock resi)ec t i ve ly. These reasons are caused by four
functional
factors
of inventory
-time,
discontinuity,
uncertainty, and economy.
The time factor involves the time period between production and
delivery of goods to the final consumer. Since no consumer
waits for sucli a long time,
inventory -as a working stock-
must be held to satisfy the consumer immediately or within a
resonable time.
The
discontinuity factor is especially valid for
firms
experiencing seasonal patterns in demand. These firms often
build up inventories- as an anticipated stock- during off
season periods so that stocks would be available during certain
time periods of high requirements.
The uncertainty factor comes from an unexpected increase in
demand and/or delayed deliveries. In this case a safety stock
is held to reduce the risk of shortages. The safety stock
inventory level is a function of the anticipated forecast error
and the number of stock-outs that can be tolerated by the
management.
The economy factor permits the organization to take
advantage
of cost reducing alternatives. Some of these alternetives are
quantity discounts, price breaks, and purchasing goods at time
of price increase expectations.
In order to utilize these functions of inventories efficiently
and effectively, managers need decision and control systems.
This study deals with the utilization of these systems as a
niancigenK-iiil tool.
2.3 OBJECTIVES OF INVENTORY MANAGEMENT
Tlio
ol)j(‘
c i VOS (>r inveiitory management are to have
the
appropriate amounts of raw materials, supplies, and finished
goods in the right place, at the right time, and at low cost.
In each organization, managers at different levels tend to give
different degree of importance to each of these objectives.
Tlierefore, one might say tliat managing inventory means managing
conf1ict.
Middle to senior management, in general, prefer higher buffer
stocks
to
cover mistakes and inefficiencies
in
their
operations that they have not been able to remove. Their
promotion and reward depend on smooth operation (1).
Production management prefers higher inventories to increase
efficiency
of plant operation.
Because efficient
plant
operation can be maintained if production levels are seldom
changed, no overtime is incurred and macliines are run for long
periods once they are set up on a particular product. However,
this results in large inventories and poor customer service
(3).
A purchasing manager is more inleresLed in volume discounts,
price fluctuations, and ordering costs, and consequently he
prefers ordering in large quantities at infrequent intervals
wliich causes high level of stocks and high inventory costs.
Marketing/sales management prefer higher inventories to provide
bet.ter customer service, higher order fill rates, full product
lines, more new products, and more flexibility. On the other
linnd,
financial/accounting
management
prefer
a
lower
inventory, and the aims of the management are reducing capital
requirements, demonstrating liigher return on investment of
stocks, reducing carrying costs,
diverting money used in
inventory into other investments,
and having control on
managers using inventory buffers inefficiently.
When the
management says "We must tighten our belts!" due to difficult
time faced by the corporation, they start tightening from
lowering inventory investment (1).
To come to a conclusion, we can say that there are two main
objectives of inventory control. One is to maximize the level
of customer service, and the otlier is to minimize the cost of
providing the high level of customer service. Since high level
of customer service leads to high costs, and low costs are
usually accompanied by low levels of customer service, these
two objectives are generally in conflict with each other.
Therefore, in meeting these objectives, the major problem of
tlie decision maker is to achieve a balance in stocking
decisions, avoiding overstocking as well as understocking. The
two fundamental stocking decisions that relate to tlie size and
timing of orders are examined in section 2 and 3 of chapter 3.
2.4 REQUIREMENTS FOR EFFECTIVE INVENTORY MANAGEMENT
stocking decisions (how many to order and when to order) to
balance the two main objectives of inventory control. This
information should include the following:
1. A system to keep track of the inventory on hand and on
order,
2. A reliable forecast of demand,
3. Knowledge of lead times,
4. Reasonable estimates of inventory holding costs, ordering
costs, and shortage costs,
5. A classification system for inventory items.
Inventory accounting systems cun be periodic or continuous.
Under a periodic system, a physical count of items in inventory
is made at periodic intervals in order to decide how many items
of each type to order. A continuous inventory system (also
known as a perpetual system) keeps track of removal from
inventory on a continuous basis, so the system can provide
information on the current level of inventory for each item.
Demand, another factor influencing the decisions, is units
taken from inventory in a time period. To be effective in
making tlie decision, it is essential to have a reliable
estimate of the amount and timing of demand requirements.
Historical records or sales forecast may be used to do that.
TI
k: anticipated demand must allow for fluctuations and must be
frequently modified.
Fluctuations in demand is the most
important factor that reduces effectiveness of the decision
system.
Tlie third factor, lead time, is the length of time between the
decision to replenish an item and its actual addition to stock.
Lead time can be divided into two components.
1. Administrative time (order preparation time) : the time
tliat elapses from the moment at which it is decided to place
the order until it is actually transmitted from the stocking
point to the supplier,
2. Tinu! fii,)m transmission of the order until it is iivailable
on the shelf: it constitutes the primary variable component,
its
duration materially depends on the supplier’
s stock
position (1).
2.4.1 INVENTORY COSTS
One
of the objectives of inventory management
is
the
minimization of costs. Inventory costs are associated with the
operation of an inventory system and result from action or lack
of action on the part of management in establishing the system.
These are the basic economic parameters to any inventory
decision model, and the more relevant ones to most systems are
listed as follows.
1. The Unit Variable cost,
2. The Cost of Carrying I terns in Inventory (Holding Cost),
3. The Ordering or Setup Cost,
4. The Sl-ockout Cost.
The Unit Variable Cost: For a nonproducer, it is simply the
price (including freight and V.A.T.) paid to the supplier. The
unit value is important because the total cost invested in
iiivciilüi'y
1И‘Г
yo¿ir and Llie cosí of holding
an item in
inventory clearly depend on the unit variable cost.
lliLldiilE' Costs relate to physically holding items in storage.
Tlu^y incorptH'ate sucli items as taxes, insurance, spoilage,
i)ilferage,
deterioration of stock, obsolescence, and the
<‘
Xp(Mis(‘
s incurred in running a warehouse. Holding costs ¿ilso
include opportunity cost.
By far the largest portion of the carrying cliarge is made up of
th(‘
op|)ortunity cost. This cost is associated with having funds
tied up in inventory that could be earned on the next most
atti-active opj)(jrtun i ty.
Such a marginal cost concept is
difficult to implement in practice.
Also,
theoretically
speaking, the next most attractive investment opportunity,
namely, holding cost can change from day to day. In practice,
such f luclajal ions arc» difficult to administer; instead, the
cost of capital is set at some level by decree and is changed
only if there is a major change in a company’
s environment (1).
In practice, typical annual holding costs often range from 20
to 40% of tlie value of an item under no inflation.
Thus, to
hold a TL 100 item for one year could cost from TL 20 to TL 40
(2 and 4).
The Oriieririg or Setup
Ci}sl:This cost ic a fixed cost
associated with ordering and receiving inventory.
It is
regardless of order size. For a nonproducer it is called an
ordering cost and includes such items as making requisitions,
Tiialyzing vendors, writing purchase orders, receiving and
inspecting miiterials, following up orders, and doing the
paijorwork necessary to complete the transaction. Tlie setup cost
comprises tlie cost of changing over the production process to
produce the ordered item.
It usually includes preparing
eciuipment for the job by adjusting the machine, installing new
fixtures, scliedii 1 i ng the work, and (juality acceptance.
5J <Jidu)ut Cost occurs when demand exceeds the supply of
inventory on hand. Th<; stockout cost can be caused by an
external shortage or an internal shortage. An external shortage
occurs when a customer’
s order is not fulfilled; whereas, an
internal shortage oc(;ui's wlieii an order of a group or department
witliin the organization is not fulfilled. External shortages
can include the opportunity cost of not making a sale, loss of
customer goodwill, and lateness charges. Internal shortages can
incur lost production (idle men and machines) and a delay in a
completion date.
For one thing, only those costs which depend on stock level
should be considered in any analysis. For example, lighting,
lieating, and security services expenses for a warehouse should
be ignored if they do not change with stock level.
Explicit Measurement of the Costs: It often comes as a surprise
to technically trained individuals that cost accountants and
managers cannot always determine exactly the costs of some of
I h(‘
vnrial)lcH tluiy si)ecify in llieir model (1).
Cost measurement is in practice a problem because it is not
possible and often is not economical to trace all costs
(variable or fixed) to each and every item.
3. METHODOLOGY
3.1 MAKING ABC CLASSIFICATION
For Llie problem defined in Section 1.1 of Chapter 1, a three
ste|) solnl,ion is suggested. These steps are as follows:
1. Making ABC classification,
2.
l)e t(irni i n i ng the amount of tlie item to request on any
particular order.
3. Deciding when to order an item.
It is obvious tliat each specific unit of stock should receive a
different level of managerial attention according to its
importance. We will use the annual usage value (Dv), which is
the annual usage (D; demand) times the unit value (v; price),
in order to give some degree of importance to each and every
item (s.k.u.; stock keeping unit). And we will make categories
of items called A, B, and C according to their importance.
The following steps show how the classification is made:
1. The demand (D) and price (v) for each s.k.u are obtained,
2. The annual-usage-value (Dv) for each item is calculated by
multiplying tlie cpiantity demanded in a year (D), by the unit
price (v) of the item,
3. All items are arranged in the order of decreasing annual-
usage-value ,
1.
These values are converted into cumulative annual usage
plus cumulative percentage of total annual usage,
5. The list of values is roughly divided into three groups:
A items with high-value of Dv; B items with medium-value of
Dv; and C items with low-value of Dv.
We CcUi use ¿i graph to make that division. In this graph, y-axis
shows "the cumulative percentage of total annual usage", and x-
axis shows "the ¡)ercentage of total number of s.k.u.". The
division is made at two points of the curve where the slope
changes significantly. Since there are no strict rules, the
division is determined on judgemental basis, supported with
exper ience.
A Class items are usually 5 to 10 percent of total number of
s.k.u. but account more than 50 percent of the total annual
usage of the items. A class items should receive the most
personalized attention from management.
Class B items ai'e of secondary importance in relation to Class
A items. Usually more than 50 percent of the stock, accounting
f(M· most of l.he rtuiiaining 50 pei-cent of the annual TL usage is
designated for class B items.
Class C items are the relatively numerous remaining items that
make up only a minor part of total TL investment.
Tliere
are
two
general suggestions given by
tlie
ABC
classi ficat ion:
1. Have plenty of the low value items; these must be
availal)le wlien netaled,.
2. Use the control effort saved to reduce the inventory of
high value itiuiis.
Maiuigemenl should give the most ’
’
personalized”
attention to
(his gt'ouij of items because of the potential high pciyoff
warrants, in such cases, mathematical models are not enough for
replenishment. dec:isions bul. they ¿lid the manager. Normally
l.hese models cannol
i ncoriiorat e all the important factors,
'riierefoi’
c, l.he manager must modify suggested action by the
model through the subjective incorporation of any important
i'actor omitted in the model. The art of management becomes
important ill tiiis type of ac.d. ivity (1).
3.1.1 CONTROL OF CLASS A ITEMS
Idle following guidelines art* suggested to deal with Class A
i terns (3 ) :
1. Degree of Control: Exert Lhe tightest possible control,
including most complete, accurate records, regular and careful
ri'view by s(M)ior managtaiient. Replenish the i t.ems frequently to
eliminate the stock-outs. Negotiate with suppliers to reduce
lead tiiiK'.
2. Inventory Records: Class
A items require the most
ac( iirat (.*, comiilete and detailed r'ecords with freciuent even
real-time updating. The use of a manual system for these
|)urposes is more attractive tlian a computer due to the
relaliv(ily small number of A items. And tight control of
transaction documents, scrapp losses, receipts, and issues is
essent. i al .
3. Priority: High priority should be given to A items in all
activities to reduce lead time and inventory.
1. Ordering Procedures: II is necessary to provide careful,
acc:ui7
it(‘
det.(irminal. ion of order (plant i ties and order points lor
A itcims. Manual check of computer data is advisable, along with
frequent review to i*educe inverilory.
5. Estimate Demand: Management should try to have knowledge
of intentions of important customers and predict demand of
a certain tiiiK*.
(For (example a secretary can guess the time
wI
kmir-il)l)on cart.ridge of lier' pr*intei· will become useless ¿uid
she will iK.'ed anotluer cartridge. Inventory management must
utilize this information). This allows management not to carry
pr(.)t ec: t i on ( safet y ) st.ock.
3.1.2 CONTROL OF CLASS B ITEMS
For
B
items most decisions would be made by
routine
(computerized or manual) rules after order points and order
quantities are determined according to holding cost, demand,
unit price, ordering cost, and lead time for each item. It is
advisable to management to review order points and order
(juaii t i 1 i (‘
s (iuart(*rly or when major changes occur.
if the inveuitory system is computerized, the number of items
classified as class B in an inventory should be increased to
take the advanlagc's of the? computer facility because costs of
clerical labor and the i)otential costs of human error are
continuously i iK.-rcuis i ng while cost of data processing is
cons tan 11y dec reas i n g .
Wluui th(*r(‘
ar’
(‘
no comput(‘
r facilitic‘
s, the fraction of s.k.u.
classified as B items should be reduced, and the fraction of C
items I
k‘
increased to t.ake ¿idvantage of the lower costs of less
paperwork and clerical handling (5).
For C i Lems Llie simplest, possible controls, such as periodic
review with a relatively long interval, should be used to keep
control costs (juil.e low.
In
most cases,
there is no need for recording
each
t.ransaction. However, for demand estimation and order control
purposes, a record of tlie dates of placenient, and receipts
of replenishment orders can be kept (1).
The C items do not re<iuire order quantity and order point
calculations. 1 year’
s supply can be ordered while there is
plenty of stock on hand.
When one item needs reordering, several others from the same
supplier
should
be
included in the order
to
reduce
replenishment costs.
3.2 DETERMINING ORDER QUANTITY
The two fundamental questions posed to any inventory system are
how many and when to order. The answers depend on the nature of
demand and the pariimeters defining the system. We assume that
demand is known and continuous. Therefore, tlie same number of
units (how many) is iilways ordered, and the time between
orders (when) is not expected to vary.
Thus, the size of the
order (Q) and the time of order become defining parameters of
the system (2).
3.2.1 ECONOMIC ORDER QUANTITY MODEL
In
determining
tlie appropriate order quantity of an item, we
3.1.3 CONTROL OF CLASS C ITEMS
use Llie Economic Order QuanLiLy (EUy) model. Tlie criLerioii used
in this mode] is minimization of total costs which are truly
affected by the choice of order qucintity. These costs are
annual order* ing costs and annual holding costs of an item.
Th(‘
optimum order quantity reflects a trade-off between holding
costs and oi-dering costs:
As order size clianges, one of the costs increases while the
otlier one decreases. For example, if order size is relatively
large, the average inventory will be high and this will result
in high holding costs. However, a large order size will make
order intervals infrequent, and that will reduce ordering
costs. Conversely, this is true as well.
Therefore, the ideal solution will typically be an order size
that lies somewhere between those two extremes. The exact
amount to order will depend on the relative importance
of
holding and ordering costs.
Before
d(‘
r*ivation of EOQ model,
let us stipulate
the
assumi)tions, since considerable discussion will be directed to
this model (1).
1. The demand rate is constant and deterministic.
2. The order quantity need not to be an integral number of
units, and there? are no minimum or miiximum restrictions on its
size.
3. There are no budget restrictions.
4. The unit variable cost does not depend on the order
quantity; in particular, there are no discounts in either the
unit purchase cost or the unit transportation cost.
5. The cost factors do not change appreciably with time; in
particular, inflation is at low level.
6. The item is treated entirely independently of other
items; that is, benefits from joint review or order do not
exist or are simply ignored.
7. No shortages are allowed.
8. Tlie entire order quantity is delivered at the same time.
The assumption of low level of inflation will be relaxed in the
next section.
In the calculation of EOQ, we will use the following notation:
1
VQ
Q/2
H
0
s
: Carrying charge. The cost of having one lira of
the item tied up in inventory for one year.
Expected, continuous inflation rate
Current unit price
Order quantity
Average inventory
H=rv Holding cost of an item for one year
Annual demand
Ordering cost
Using these symbols, the total annual holding cost and annual
ordering cost are as follows:
Annual holding cost = (Q/2)rv
Annual ordering cost = (D/Q)S
Tlic total ¿uinual cost associated with carrying and ordering
inventory when Q units are ordered each time is:
Annual
Annual
(Total Cost)
TC = holding +
ordering
cost
cost
= (Q/2)rv
(D/Q)S
Following figure reveals that the total cost curve is U-shaped
and that it reaches its minimum at the quantity where holding
and ordering costs are equal. The minimum point can be found by
differentiating TC witli respect to Q, setting the result equal
to zero, and solving for Q. Thus,
Q ’
= (2DS/rv)''l/2
Q ’
= Economic Order Quantity.
3.2.2. EOQ MODEL UNDER INFLATION
One of tlie assumptions in the derivations of the EOQ was that
the inflation rate was at a negligiable level, llovewer, the
country has been confronted with fluctuating inflation rates
that liave been far from negligiable. There are several options
available in terms of modeling the effects of inflation on
costs. We resrict our attention to the case wliere the following
additional assumptions are stipulated.
1. All unit prices increase continuously at the inflation
rate.
Carrying charge!, r, is expectiicl to bo at least equal to or
larger than the inflation rate, since r includes opportunity
cost which is related to the inflation rate and the expenses of
holding the item in stock (6).
By Lciking into cons idiration this point our next assumption is
til a t :
2. The cai'rying charge is larger than the inflation rate
An (‘
xact analysis in the jiresence of inflation would be
extrcimely conii) 1 i c'ated. The rccison is that costs varying with
time, in principle, should lead to the order quantity changing
with time. At any point in time our primary concern is with
choosing the value of only the vary next order quantity. To
obtain a (a-actable analytic result, we assume that
3. All future order quantities will be of the same size as
the current order quantity.
Because costs are changing with time, we cannot compare costs
over a typical year. Instead, we resort to a common tool of
investment analysis, namely, the use of the present value (PV)
of the stream of future costs.
Supi)()se that, the continuous discount rate is denoted by r which
turns to be equivalent mathematically the discount rate, that
is, a cost of F at time t has a present value of Fe'^-rt. Note
that: e is the constant 2.71829,... Thus if S and v are the cost
factors at time zero, then their values at time t are Se^it and
ve"it, respectively. With a demand rate of D and order size of
Q received at time 0, the present value of the stream of costs
is given l)y (1)
PV(Q) = S + Qv -f (S+Qv)(e^iQ/D)(e'"-rQ/D)
+ (S+Qv)(e''2iQ/D)(e"-2rQ/D)
For a minimum, by setting dPV(Q)/dQ = 0, E.A. Silver and R.
Peterson obtained the following result:
Q ’
= (2DS/(rv-iv) ) n / 2
In (rv-iv) part of the formula, iv shows the holding revenue
resulting from the inflation by keeping tlie item on hand, and
rv shows tlie nominal holding cost. The difference is the real
holding loss, wliich is equal to the holding cost in absence of
inflation,
sinct'
tlie holding revemui is zero under no
inflation.
And, the minimum total cost is:
TCm = (Q’
/2)rv + (D/Q’)S
The important consequence of the total cost curve is that the
curve is relatively flat near the EOl^. This implies that
relatively small fluctuations and/or errors in data collection
do not significantly change the EOQ.
3.3 DECIDING WHEN TO ORDER
EUO iy the answer to the question of "how many to ordei'" but
this model does not address the question of "when to order".
This question is related with reorder-point models, which
identify tlie reorder point (ROP) in terms of a quantity: The
stock
level is reviewed continuously,
and whenever the
inventory position reaches a predetermined quantity, reorder
point occurs. At this point, the remaining stocks generally
include
expected demand during lead time and safety stock
which laulnces the risk of probable stock-out during lead time.
There are four factors influencing the reorder point quantity:
1. Rate of demand,
1, L c in g U i o T l(í¿ ı(.l L im e ,
3. VcU'icibi 1 i Ly of demand and lead time,
4. Degree of sl.ock-oul risk acceptable to management.
In determining t tie reorder point, we will use the simplest
case, wliich considers constant demand and constant lead time
dii(‘
to assumptions we iiave already made. In order to use other
models, which employ variable demand rate and/or- variable lead
time,
it is necessгir·y to know the avei-age daily demand , lead
time and their standard deviations. Since we have not been
able to find out tlris i n foi-ma t ioir in the university, we will
use tlie simplest model in this study.
'riius,
in this modt'l, the ROD is eMpicil to the product of usage
per day and lead time; no safety stock is needed.
4. AN APPLICATION : THE PURCHASING DEPARTMENT
This sludy aims to apply an inventory classification and
decision system in the Purchasing Department of
Bilkent
Universi ty.
4.1 CURRENT SITUATION IN THE DEPARTMENT
IMirchases made
bythe department can be divided into two
groups:
The first group consists of irregular purchases of items which
are only purcliased if a demand occurs for them in the
university.
(e.g. a photocopy machine). Since they are not
available in stocks, this study does not include this group of
items. The second group of items, which are needed more
frequently, are purchased for stocking purposes every three
months. The items stocked consist of five types of goods. These
are stationery,
cleansing, installation, electricity, and
carpentery. Each type of items needs to be ordered from
different suppliers, in other words, suppliers have also the
siimo five types.
In the time of stocking, the department
receives offers from suppliers for each type of item. Then, a
committee in the university chooses the best offer to purchase
and stock.
4.2 DATA COLLECTION
The data consists of annual demand and unit value (V.A.T.
included) for each s.k.u.. The data was collected for all five
type
of items purchased by the department for stocking
purposes.
Т1іс‘
l.ul,tLl. number о
Г
i Lems is 105 ¿uid llie ¿iiinual ainounl paid Г
о
г
such a large number of items is arround TL 416 million.
For all groui)s of items, excluding stationery, the annual
d(.*mand rates were obtiiined from (die 1989 records. To determine
the annual demand raLe for' stationery, since no records were
available, W(* (люк i n (x) cons i d(M'a ( i on the 1988 ¿uul the 1989
ending'· inventory I'ecords, in addition to the 1989 stationery
invoices. By sub(.racting the 1989 ending inventory from the
1988 ending inventory, and adding the total purchases shown in
the 1989 inv(jices we obl-ained the demand for st¿ıtionery.
For unit values, we used the prices paid for the last purchase
of the i (л
!ііі in 1989.
4.3 THE CLASSIFICATION
In Table 1, the data, namely each s.k.u. in the inventory,
annual demand, and unit value were listed in columns 1, 2, and
3 r(.'si)ect.ively. To nmke the classification, Columns 4, 5, and 6
were ob(,aim‘
d by following the steps explained in Section 1 of
Chapter 3.
The distribution-by-value graph, which helps us in dividing the
inventory into classes (A, B, and C), was constructed by
[ilacing the values in Column 6 on y-axis, and Column 7 on x-
axis (Figure 1).
Since there are no specific rules on how to make that division
we relied on
the Purchasing Department and the existing
examples in the literature to help us in devising the following
cl ass i r i c a l , ion:
TİK' first. 3f) of the lOT) items W(*r‘
e identified as class A, the
next 262 i tcMiis as class B, and the last 108 items as cl¿ıss C.
4.4 EOQ AND ROP
In
calculating the EOQ and ROP values, three other values
should be known in a d d i U o n to the demand rate. These are
holding cost, ordering cost, and lead time. As we already
explained, holding and ordering costs are very difficult to
determine. Since holding costs, in practice, range from 20% to
40% of the value of an item under no inflation, and the
financial management felt that it is relatively high for the
university, we thought 90% would be an acceptable amount with
the assumption that the inflation rate was 60%.
For the ordering cost, we consulted the Purchasing Department
whose fcim i 1 i ¿iri ty and experience with the nature of the
ordering process made it clear that setting an order cost for
each item is difficult because of the coiitinuously changing
features of the process. Although order costs, associated with
paperwork, telephone calls, freight, etc, fluctuate with time
of order, place of supplier, nature of item, and conditions of
delivery, the effects of these fluctuations on order costs are
negligible. However, a large percentage of order cost results
from labor cost which is almost tlie same for all ordering
processes, therefore, we thought TL 18500 is an acceptable
amount for the cost of an order process.
The last value,
lead time,
was considerably easier to
deter‘
mine. Altliough Lliis Lime varies with the supplier, 15 days
can be accepted with confidence.
4.5 RESULTS
'fable 1 shows the classification results of all classified
items. Below, a sample of the classification results is given.
Class
Dv
# of
B. k.u.
percent
B.k.u.
Dv
Dv %of
Tot. Dv
35
8.64%
245,046,824
58.92%
262
64.69%
166,702,195
40.08%
108
26.67%
4,141,551
1.00%
In Figure 1, Class A constitutes the part of the curve where
the slope is high because such a small group of the stock, i.e.
8.61% accounts for 58.92% of total annual usage of items. In
the curve, the slope is very close to zero for Class C items.
Class B items constitute the reiiuiining p£irt of the curve. Since
the University is going to use a computerized system we kept
the number of Class B items considerably large (64.69% of the
total number of items), and consequently the number of Class C
ilcms low. Therefore, Class (· accounts only for 1% of total
investment.
Economic order quantities and reorder points obtained in this
study are shown in Table 2. As it can be seen in Column 13 of
tlu* table, the maximum number of orders in a year is 12. This
tells us tliat, tire purchasing process for the item should be
made 12 limes a year Lo minimize inventory costs for that item.
Currently, the department is doing it 4 times a year. This
item, namely, Kablo Bir Gift Telefon is included in the
electricity group and we assume tliat all items in tliis group
can be ordered from the same supplier at the same time. (This
assumj)l i(Ml is also valid for other types of items, namely,
stationery,
installation,
cleansing,
and
carpentery.)
Therefori·, we can also include tlie other electricity items with
number of orders in a year less than 12 in that single order,
since this does not effeiit the order cost. In addition, making
purchases of the other electricity items more frequently will
certainly
reduce
the average inventory
quantities
and
consequently the total holding costs of the electricity items.
The next number in Column 13 for a stationery item is 11.84
which can also be accepted as 12 so in addition to the
electricity items, all stationery items should also be ordered
monthly from the stationery supplier.
In Column 13, the largest number for installation, cleansing
and carpentery are 9.36, 8,37 and 7, therefore, purchases for
this group of items should be made in every 40, 43, and 52 days
respectively t.o reduce the total holding costs.
Order ciuantities in Column 11 should be revalued, since making
purchases mor-e frequently reduces the order quantities. These
new values are shown in Column 14.
However, making purchases more frequently will probably reduce
(lUMiil ily (iiscouiils Llioiigh we hiive made the assumption ol* no
quantity discounts. Therefore, negotiations with suppliers will
become more important.
5. CONCLUSION
This study intended to help the Purchasing Department of
Bilkent University in dealing with inventory problems. These
problems are basically control of items and high costs of
investment on stocks.
Tlie results revealed that practising the same level of control
effort on all items was not feasible, therefore, to reduce
control effort and to make it more effective the classification
of items can be used as a guide for management. The results
also showed that 8.64 percent of all items accounted for 58.92
percent of total value, while 26.67 percent of items accounted
for only 1 percent of total value. This situation should
convince management to implement appropriate control systems as
explained in chapter 3.
The EOQ model reveals that stocking purchases should be made
more frequently instead of making them 4 times a year. Since
this will reduce tie inventory costs at least 5-6 percent (TL
25 mi’
lion), financial management is expected to support this
result. However, the Purchasing Department will undoubtedly
reject this because its work will increase to a level where, it
believes, new labor force will be needed.
The results mentioned above, on the one hand, and the gaps
between tlieoretical solutions and real world problems, on the
other hand, allow room for personalized, tested-in-practice
approaches to fill the gaps in theory. For example, the EOQ
model does not give a solution for the items having an annual
demand less Lliari the number ol‘
orders in a year for Llie iLem.
Since the number of the items to purchase in a single
order
can not be between zero and one, The Purchasing Department may
order the total number of items in a single order. Also, for
sucli items management must take into account a
minimum
allowable order ciuantity specified by the supplier.
Despite our assumption that demand rate is constant, in fact it
is not because of the nature of universities. Since demand for
most items decreases in summer months, the system should be
modified to take into consideration the demand rate.
Tfie data used in tliis study can be updated, and this system can
be technically combined with the new perpetual inventory system
of the university. Thus, if a change occurs in one of the
variables,
new classes and new order quantities can be
automatically determined by the combined system. For example,
financial management may set opportunity cost at a new level
wlien major changes occur in the environment of the university.
In this case, the combined system can utilize this information.
If oi)portunity cost increases, then, order intervals are
expected lo be moi’
e freciuent.
In conclusion,
the classification study,
allocation
of
appropriate control effort among classes, and monthly orders
will ccrl.ainly improve the current situation of the university.
Planning the future will be possible with an up-to-date
inventory data available at any time, and investment decisions
will luive a reliable base.
VPPENDÎCES
M PIE
I
I
INO :
I______ CLASS A S. L y..'iNNljAl
! Of «ANÎ' ON I IlALljt
CüHOlAHVEÛV
U'HüLAHyE I'CuNulA I IvE
S of l o i a l U of Total Dii I I of s.k.u,
1 ;
a
A
8
LO BIS
cifi
IELEFON
2 lA A G lî A4 FOI'î i i'jPI SOOLÜ^ I j GF/HI
1 !iA G I( A4 !E^SIf^ S00LU4 /5 GS'NI
4 >II MJ-280
5 ;
aa
?
i
CE
a
2 NO
(' Ihahü aAGİI SOlO it ftıJiO
I i m i m
SN'MAN
8
,'ELENÎNÖSIENSIL NE» NOlAKy
I |
a
IÎ i'.y-İSO
10 lANPUL /5
H
II :0I$AEI
12 :GL0BE C IIPI CAN
13 lAILII G08EGI
14 ,'AHPOL 80 «
15 lAHFOl 100 N15 lAHPOL 50 N HA.NIAP
11 lOETEPJAN CIFF
18 lANPıJL 40 N FlORESAN
10 ,'AHPyi 13 4 SL
20 lîONtii RltOli N-lûO
İ5AGII 84 FOÎOf.OPI 500111» 15 GR/N2
.'BALASI 40 N
İSERIÎ EPSON LQ-800
I sifon lavabo¡ANPOL 20 4 FLORESAN
25 İSIARIEP
2
/ :
faleh
peliîan
signal
»
eceli
28 ;iONER GESİEINER 2130
l
20 İNASÎER RI50 RULO 2100 S-I82
30 :CA.v· 25 5G
31
,'ARHAiyR 2.A40
32 ‘DfîERJA.N OlAl 15 ADI
1
»OLI
33 IaA.LEN SNOnNAN
34 IflI K.y-150
35 i KLASÖR AVROPA OAR HERLII2H
: 21
:
22
! 23i
24 : 25 4800 1513 2 350 20 150 4512 1050 45 4 ; 5/05 ! 2300 ' 1 5 / : 355 ; 5550 ; 523/ ' 3580 I 2444 1 1/ / 0 ' 155 ; 43 ; 300 i 525 ;110;
/ / : 14/8 : 3405 : 2550 :80:
1 4 :'
-» (
II:
: 1213 ;
: 18/5 I I 5 ' 3/50 I I '300 5100 5//500/2000
1888/400
!^Ü!00
lO'JioOO
1085 i 2450 !30000 ;
1/000 :
1085:
1085 ; 1521 : 2180 I 2/80 I 20300 ; ııoooo I 15550 1 8400 30505 ; 2/80 1125 1450 45000 251000: 430:
48500 2800 1800 5//500 //80 10800000 10033300 15835500 1400/200 11880000 0405130 854/000 /855550 /04/040 5810111 5/3/5'30 5/35300 5538500 5536850 5250350 51/2055 5850/12 6440182 5425850 5203000 5154500 4850240 4803005 4558500 45IS/24 4325053 405/250 3350000 3855400 3350000 3/8/850 3/35040 3/31053 3/25800 35/3940 38833300 54558300 (35/5100 81455100 30351250 33438230 10/353880 114400320 121211031 12/348531 134583831 I4I32233I 14/358191 154208550 150380515 155241328 1/1581510 I//108350 182311350 18/4/5850 132335100 13/133135 201/3/695 20531/419 210542482 2I4/03/J2 218553/32 222535132 225385132 2301/2382 233903022 23/540084 241355884 245045824 4,/6A! 3.34NİI3.!5A:
I6./3<119,59i!
21 .8 /i! 23.32i! 25.81i! 2 / ,5 l i ! 23.14i! 3 0 ./5i! 32,38i! 33,38i! ■ 35.58i! 3/.08Ü 38.551! 33,9/i! 41.28i! 42.59i! 43.84i! 45,08i! 45,25i! 4 / . 40i! 48,52i! 4 3 ,5 li! 50,55i! 51.53i! 52.58i! 5 3 .5 li! 54,43i! 55,34i! 55.24i! 5 / . I4 Ü 58,04i! 58,32i! 0,43i! 0 ./4 İİ 0 . 991. 1.23i! 1.48i! 1 . /3Ü 1.98i! 2.22i! 2 .4 / i!2. /2Ü
2.95i! 3.21i! 3.45i! 3 . /0İ! 3.95i! 4.20i! 4.44i! 4,59i! 4.94i! 5,19i! 5,43i! 5,58i! 5 .93ü 5 .1 / i! 6.42i! 5 .5 / i! 5.91i! / . I5 Ü /.4 1 i! / .5 5 i! /.9 0 i! 8.15i! 8.4Ci! 8,54i! CLASS B 35 !SERII 18/ C 3/5 /544 3111900 248158/24 59 .5/Ü 8.89i3/ !iı..ABL0 3.A1.6 TIR 1590 1550 2881450 2510401/4 60.36i! 9.14i
38 !NUREmİ.EP RİSO SI/AH 2/00 S-5/9 24 10/900 2848580 253888/34 51.05ü 9,38i,
39 ! KLASÖR AVROPA GENİŞ NERlIIZH 310 //80 2652980 266641/14 51.58ü 9.63i!
40 ! K IL If OIS KAPI 291 8000 2550800 259102514 52,30i! 9.88ü
41 !0EÎERJAN P R Il 15 .AOl /54 3031 254/453 2515499// 52.91i! 10.12i!
42 !REZERViJAR IC I.AKIN 26 85000 2431000 2540809// 53.50ü IÛ.3/Ü
43 !KALEN POSPÖRLO ,AÖEL RENKLİ 1100 1960 2359500 2554404// 54 .0 /i! 10.52i!
riBLt
44 ;4,SPHT A·! FOLt« 45 :M 0ZtI MPAGI <5 :FABlO 2 CIFÎ ÎFIFFON
4i .'»(İJSLİJK ÎFPE5I 48 IFOIOStL
48 |C0P POSEII NA5L0N MjCiJf, 5') P.*.î 5ö İFABlO J»2,6 ANIlGPOlı 51 ;H45IEP ı.HiîıJi 52 !5ERIÎ IBH 6?45 4/ 5i |m3NİAFIOP 54 İSERIl 185 C 55 :SEAEP 25 *G 55 lOöS sp ir a li
5? liiP IS IIfilC I PRIÎ 0R14 211 58 ,'OOSiA ASiILl 5.ARIOR 59 IREZERVIJAR ZİNCİRİ 50 ;CAH B IIP I BALPEIEGI 51 !0OS BORIJSU
52 iflANI f.ESHE HAAİNASI 5i IaİL II cephece
54 'DOSiA ÛElI U I
55 ;PRIZ iJCLü löPRAALi ZI04 55 ;0EÎER.JAN TOZ VIH 24 A.ül 51 lOIOHAÎ 15 AHPER V 58 İHASİER 220 B4
59 ,'OEIERjAN OHöHAIIp 12 AOI 1İOO GR 10 MAS ALAIÜRM,
M :aapi folo c if i
U lOIöHAT 25 AHPER 9
U liNAHIAR ANMSTRA NORHAl
14 lAHPIJL CIVALI 15 :GL0BE B IIP I CAH 15 'lERHöSTAI ISITIC I î! ;foP Blöf 18 ,'TüZROhU /9 ,'OOSi.A OElIp.SIZ 80 'ASET4T A4 81 ,'BALAST 20 R 82 :OTOHAT HEROIVER 8'j !HoREFFEP ORİ. INp 84 IFOTOSEl ORB 1 85 |y4PÎSTİPICI DERBf 15 85 ;aHPuL 15 » 81 İRORTOH VApİT 88 IHAROHETRE 89 : REZERVUAR BAS 90 ISELOBANI 12Aİ'i 91 IBEVELOPER GESIETNER 2130 Z ANRUAL ÖEHANO ! yRlT 1 VALUE 1 i Ov ; CuHULATİVE ; Ov 1 t of T o ia ljA of Totdl 1 Ov U of s.k.u. 30 : n o o o ; 2343000 1 258/834// : 54.5311 10.85» 49 43000 231//00 1 2/11011// 65.1941 11.11 4p i5 450 2294325 ! 2/3395502 55 ./4İ; 11.35 131 15500 2233550 2/5529062 55.2/Al 11.50 21 95000 221/500 2//84555Z 5 5 .8 u ; 11.85 1550 1200 2059200 2/9905852 5/.30St; 12.10 1592 1091 2030559 281935421 5 / ./ 9 » I 12.36 3 515000 2029500 283955921 58.28Aİ 12.59 100 m o o 1925000 285890921 58./4»; 12.84 43 3/450 1//I858 28/552//9 5 9 .1 /i; 13.09 125 12500 1/18/50 289381629 59.58A; 13.33 35 4/500 1/123/5 291093904 69.99a; 13.58 418 35/5 1589/55 292/83559 /o.40a; 13.83 )50 4300 1555500 294439159 /fl.80j| 14.0/ i<№) /50 1550000 295089159 t i.i9a; 14.32» 54} 2/00 1512/10 29//Û18/9 /1.58t; 14.5/» 2! 54000 150}800 2993055/9 /1 .9 /a: 14.81» 124 11500 1582240 30088/919 /2.35Aİ 15.05» 93 14/50 1508925 302395844 / 2 . / U İ 16.31» 524 2500 1498540 303895484 / 3 .0 /j; 15.55» 5000 2/0 1485000 305380484 /3.43Aİ 15.80» 321 3950 1420815 305801299 /3.//A İ 15.05» 524 2052 141535/ 308215555 / 4 .1 U İ 15.30» 151 //00 1414490 309531145 /4.45Aİ 15.54» 4 319390 1405315 311035452 /4./9Aİ 15./9» 140 9042 139241/ 3124288/8 I5.12.A; 1/.04» 14 900ÛÖ 1385000 3138148/8 /5.45\; 1/.28» 221 5450 1350855 3151/5/43 /5 ./8a; 1/.53» 205 5000 1359500 315535343 / 5 . m ; 1/./8» 504 2000 1328800 31/854143 /5.43A; 18.02» 24 50000 1320000 319184143 /5./6Aİ 18.2/» 22 54000 1305800 320490943 //.0 5a; 18.52» 31 32000 1302400 321/93343 11.m : 18.//» 295 3900 1255550 323058893 //.58A; 19.01» 1340 850 1252900 324311/93 ı ı m ] 19.25» 5000 11) 123/500 325549293 u . m : 19.51» 15 /4/50 12333/5 j 2 6 / i 2 6 C' p l i . i h i 19./6» 130 8400 1201200 32/983858 l i . m ı 20.00» 55 19000 11/0400 329154258 /9.14»; 20.25» 35 301/5 1151/38 330315005 /9.42»; 20.49» 10 105000 1155000 3314/1005 /9./0»; 20./4» 29 35000 1 1115500 33258/605 /9.9/»; 20.99» 900 1104; 1092950 333580455 80.23»; 21.23» 9 0 : 11000 ; 1089000 ! 334/59455 1 80.49»; 21.48» 3 5 ; 28000 1 10/8000 ; 33584/465 : 80./5»; 21./3» 1 5 ; 55000 : 10/2500 ; 335919955 | 81.01»: 21.98» 8 0 0 ; 1200; 1055000 : 33/9/5955 : 81.2/»; 22.22» 1 0 : 95000 ; 3 4 1045000 1 339020955 1 81.52»; 22.4/»