EXPERIMENTAL AND MODEL BASED
INVESTIGATION OF THE EFFECTS OF
HIGH STIMULUS PRESENTATION RATE
ON CODE-MODULATED VISUAL EVOKED
POTENTIAL BASED BRAIN-COMPUTER
INTERFACES
a thesis submitted to
the graduate school of engineering and science
of bilkent university
in partial fulfillment of the requirements for
the degree of
master of science
in
electrical and electronics engineering
Experimental and Model Based Investigation of the Effects of High Stimulus Presentation Rate on Code-Modulated Visual Evoked Poten-tial based Brain-Computer Interfaces
By Toygun Ba¸saklar September 2018
We certify that we have read this thesis and that in our opinion it is fully adequate, in scope and in quality, as a thesis for the degree of Master of Science.
Yusuf Ziya ˙Ider(Advisor)
Hacı Hulusi Kafalıg¨on¨ul
Murat Ey¨ubo˘glu
Approved for the Graduate School of Engineering and Science:
ABSTRACT
EXPERIMENTAL AND MODEL BASED
INVESTIGATION OF THE EFFECTS OF HIGH
STIMULUS PRESENTATION RATE ON
CODE-MODULATED VISUAL EVOKED POTENTIAL
BASED BRAIN-COMPUTER INTERFACES
Toygun Ba¸saklar
M.S. in Electrical and Electronics Engineering Advisor: Yusuf Ziya ˙Ider
September 2018
Objective. Previous studies on code-modulated visual evoked potentials (c-VEP) have yielded important results regarding the performance of c-VEP based brain-computer interfaces (BCIs) in recent years. Since, speed is the key factor in BCI applications and since the monitor refresh rate limits the stimulation time and thus limits the performance of the system, this study aims at investigating the effects of high stimulus presentation rates (refresh rate of the monitor) on a c-VEP based speller BCI. Furthermore, Robinson’s corticothalamic model, which has not yet been studied for c-VEP responses, is used to simulate the salient behaviors that are observed in our experiments. Approach. Six subjects par-ticipated in three different experiments with refresh rates of 60 Hz (E1), 120 Hz (E2) and 240 Hz (E3), where a 127-bit m-sequence is used. Canonical Correlation Analysis (CCA) was used in the training stage to obtain 36 target templates from 100 averages of 8 EEG channels. Information transfer rate (ITR) and accuracy values were calculated for each experiment and subject. Subjects also answered a questionnaire asking at which refresh rate they felt more comfortable. Robin-son’s corticothalamic model was used to simulate the c-VEP experiments. Power spectral density (PSD) estimates of c-VEP responses and results of principal component analysis (PCA) were evaluated both for the simulation data and the experimental data. Main Results. Average ITR and accuracy values for E1 are 86.17 bits/min and 93%, for E2 are 90.68 bits/min and 95% and for E3 are 70.89 bits/min and 81% respectively. Also 5 out of 6 subjects stated that E3, and 1
iv
especially for E3. This periodicity leads to target misclassification. PCA shows that only 73, 52, and 26 well distinguishable responses can be obtained with a 127-bit length m-sequence for E1, E2, and E3 respectively. The results from sim-ulations shows great similarity with the results from experiments. Considering all results and observations, we suggest that 120 Hz refresh rate is best to use in BCIs with high number of targets whereas 240 Hz refresh rate is reasonable for low number of targets. Results from modeling study suggest that the response of the visual system to the high frequency components in the input at higher refresh rates tends to diminish. Significance. Important results are obtained regarding characteristics of c-VEP responses and the effects of high refresh rates on c-VEP based BCIs. Robinson’s corticothalamic model is found to be capable of explaining some of the salient behaviors in the experiments and this could be a basis for practical studies on improving the performance of c-VEP paradigm.
Keywords: EEG, Code-Modulated Visual Evoked Potential, c-VEP, Principle Component Analysis, PCA, Monitor Refresh Rate, Brain-Computer Interface, BCI, Corticothalamic Model, Mathematical Cortex Model.
¨
OZET
KOD-MOD ¨
ULASYONLU G ¨
ORSEL UYARILMIS
¸
POTANS˙IYEL TABANLI BEY˙IN-B˙ILG˙ISAYAR
ARAY ¨
UZLER˙INDE Y ¨
UKSEK UYARAN G ¨
OSTER˙IM˙I
HIZLARININ ETK˙ILER˙IN˙IN DENEYSEL VE MODEL
TABANL˙I ˙INCELEMES˙I
Toygun Ba¸saklar
Elektrik ve Elektronik M¨uhendisli˘gi M¨uhendisli˘gi, Y¨uksek Lisans Tez Danı¸smanı: Yusuf Ziya ˙Ider
Eyl¨ul 2018
Ama¸c. Ozellikle son yıllarda, kod-mod¨¨ ulasyonlu g¨orsel uyarılmı¸s potan-siyeller (KMGUP) ile ilgili yapılan ara¸stırmalar, KMGUP tabanlı beyin-bilgisayar aray¨uzlerinin (BBA) performansına ili¸skin ¸cok olumlu sonu¸clar vermi¸stir. BBA uygulamalarında hız olduk¸ca ¨onemli bir fakt¨ord¨ur. Monit¨or yineleme hızı stim¨ulasyon s¨uresini sınırlamaktadır ve dolayısıyla sistemin per-formansını sınırlamaktadır. Bu ¸calı¸sma y¨uksek uyaran g¨osterimi hızlarının (monit¨or¨un yineleme hızı) KMGUP tabanlı heceleyici bir BBA ¨uzerine olan etk-ilerini ara¸stırmayı ama¸clamaktadır. Buna ek olarak, daha ¨once KMGUP tep-keleri kullanılarak ¸calı¸sılmamı¸s olan Robinson’un kortikotalamik modeli de bu ¸calı¸smadaki deneylerde g¨ozlemledi˘gimiz bazı ¨one ¸cıkan davranı¸sları sim¨ule et-mek i¸cin kullanılmı¸stır. Yakla¸sım. 6 denek, 127-bit m-sekansı kullanılarak ger¸cekle¸stirdi˘gimiz 60 Hz (E1), 120 Hz (E2) ve 240 Hz (E3) yineleme hızlarını i¸ceren toplamda 3’er deneye katılmı¸stır. Deneylerin e˘gitim a¸samasında 36 hedef ¸sablonu elde etmek i¸cin 8 kanallı EEG sinyalinin 100’l¨uk ortalaması ve Kanonik Korelasyon Analizi (KKA) kullanılmı¸stır. T¨um deney ve denekler i¸cin bilgi ak-tarım hızı (BAH) ve do˘gruluk oranları hesaplanmı¸stır. Ayrıca deneylerin so-nunda deneklerden hangi yineleme hızına ait deneyde daha rahat ettiklerini ¨
o˘grenmek amacıyla bir anket yapılmı¸stır. KMGUP deneylerini sim¨ule etmek i¸cin Robinson’un kortikotalamik modeli kullanılmı¸stır. Hem deneysel veriler hem de sim¨ulasyon verileri i¸cin KMGUP tepkelerinin g¨u¸c spektral yo˘gunluk (GSY) tahminleri ve temel bile¸sen analizi (TBA) sonu¸cları de˘gerlendirilmi¸stir. Ana
vi
ve %93, E2 i¸cin 90.68 bit/dk ve %95 ve E3 i¸cin ise 70.89 bit/dk ve %81 olarak hesa-planmı¸stır. Ayrıca, 6 denekten 5’i E3’¨un en rahat, sadece 1 denek ise E2’nin en rahat deney oldu˘gunu belirtmi¸stir. Giri¸s sinyali geni¸s-bantlı bir sinyal olmasına ra˘gmen KMGUP tepkeleri bant-limitlidir. KMGUP ¸sablonlarının g¨u¸c spektral yo˘gunlukları, ¨ozellikle E3’ten elde edilen ¸sablon i¸cin ¸ce¸sitli frekans aralıklarında yo˘gunla¸smı¸stır. Bu periyodisite yanlı¸s sınıflandırmaya yol a¸cmaktadır. TBA, 127-bit uzunlu˘gunda bir m-sekansı ile E1, E2 ve E3 i¸cin sırasıyla sadece 73, 52 ve 26 ayırt edilebilir KMGUP tepkelerinin elde edilebilece˘gini g¨ostermektedir. Sim¨ulasyondan elde etti˘gimiz sonu¸clar ve deneylerden elde etti˘gimiz sonu¸clar b¨uy¨uk bir benzerlik g¨osermektedir. T¨um g¨ozlemler ve sonu¸clar ele alındı˘gında, 120 Hz yineleme hızının, y¨uksek sayıda hedefe sahip BBA’larda kullanılmasının en iyisi oldu˘gunu, 240 Hz yineleme hızının ise d¨u¸s¨uk sayıda hedefe sahip BBA’lar i¸cin makul oldu˘gunu ¨onermekteyiz. Modelleme ¸calı¸smasından elde edilen sonu¸clar, g¨orsel sistemin y¨uksek yineleme hızlarında girdideki y¨uksek frekanslı bile¸senlere verdi˘gi yanıtın azalmaya e˘gilimli oldu˘gunu g¨ostermektedir. ¨Onemi. KMGUP yanıtlarının karakteristiklerine ve y¨uksek yineleme hızlarının KMGUP tabanlı BBA’lara olan etkilerine ili¸skin ¨onemli sonu¸clar elde edilmi¸stir. Robinson’un kor-tikotalamik modelinin, deneylerdeki bazı g¨oze ¸carpan davranı¸sları a¸cıklayabildi˘gi bulunmu¸stur ve bu, KMGUP paradigmasının performansını geli¸stirmek i¸cin yapılacak pratik ¸calı¸smalara bir temel olabilir.
Anahtar s¨ozc¨ukler : EEG, Kod-Mod¨ulasyonlu G¨orsel Uyarılmı¸s Potansiyel, KMGUP, Temel Bile¸sen Analizi, TBA, Monit¨or Yineleme Hızı, Beyin-Bilgisayar Aray¨uz¨u, BBA, Kortikotalamik Model, Matematiksel Korteks Modeli.
Acknowledgement
I would like to express my sincere gratitude to my family who raised me the per-son I am today and for their invaluable support and patience since the first day I began to study as an electrical and electronics engineer.
I am so grateful to have Prof. Yusuf Ziya Ider as my advisor. My decision to stay in the same department as an MSc student was mostly affected by his perfectionism in conducting research, his determination and his practicality in solving problems. It has been a great pleasure to know him and work with him.
I would also like to thank to Assistant Professor Hacı Hulusi Kafalıg¨on¨ul and Dr. Utku Kaya for their support throughout my MSc study during the very first EEG experiments at Aysel Sabuncu Brain Research Center.
I want to thank M¨ur¨uvet Parlakay for her help on the administrative works.
I also want to thank Ufuk Tufan, Onur Bostancı, and especially Erg¨un Hırlako˘glu for helping me with their technical knowledge at any time and on any subject.
Finally, I would like to thank to my best friend and colleague Yi˘git Tuncel for all the fun we had, for his clever ideas and comments, and for his friendship. I also want to thank to very valuable graduated and present the members of EMTP and BCI Group for being great friends to me.
I want to acknowledge The Scientific and Technological Research Council of Turkey (TUBITAK) for providing financial support under Grant 116E153 during my MSc studies.
Contents
1 Introduction 1
1.1 Motivation and Objective . . . 1
1.2 Scope of the Study . . . 3
1.3 Organization of the Thesis . . . 3
2 Background 5 2.1 Brain-Computer Interfaces (BCIs) . . . 5
2.2 Electroencephalography (EEG) as Neuroimaging Approach . . . . 7
2.3 Visual Evoked Potentials (VEPs) . . . 10
2.4 Code-Modulated Visual Evoked Potentials (c-VEPs) . . . 11
2.5 Quantitative Models of Cortex . . . 14
2.5.1 The Neural Ensemble Approach . . . 16
2.5.2 Neural Mass Models . . . 17
CONTENTS ix
2.5.4 Neural Field Models . . . 18
3 Experimental Investigation of the Effects of High Stimulus Pre-sentation Rate on Code-Modulated Visual Evoked Potential Based Brain-Computer Interfaces 19 3.1 Earlier c-VEP Studies . . . 19
3.2 Materials and Methods . . . 21
3.2.1 Experimental Design . . . 21
3.2.2 Data Acquisition . . . 25
3.2.3 Data Pre-processing and Classification . . . 26
3.2.4 Performance Evaluation and Data Analysis . . . 27
3.3 Experimental Results . . . 28
3.4 Discussion on Experimental Results . . . 34
4 A Model Based Investigation of the Effects of High Stimulus Presentation Rate on Code-Modulated Visual Evoked Potential Based Brain-Computer Interfaces 36 4.1 Methodology . . . 37
4.1.1 Model Implementation . . . 37
4.1.2 Analysis of Simulated EEG . . . 41
CONTENTS x
List of Figures
2.1 Electrode placement over scalp according to International 10-20 system . . . 9
2.2 Autocorrelation function of a m-sequence . . . 11
2.3 A screenshot during one of our experiments. Letter A was assigned with the original 127-bit m-sequence. The consecutive targets are assigned with the circularly 3 bits time lagged versions of the pre-vious target’s sequence starting with letter A. Only the first four coding sequences are shown in this figure. . . 13
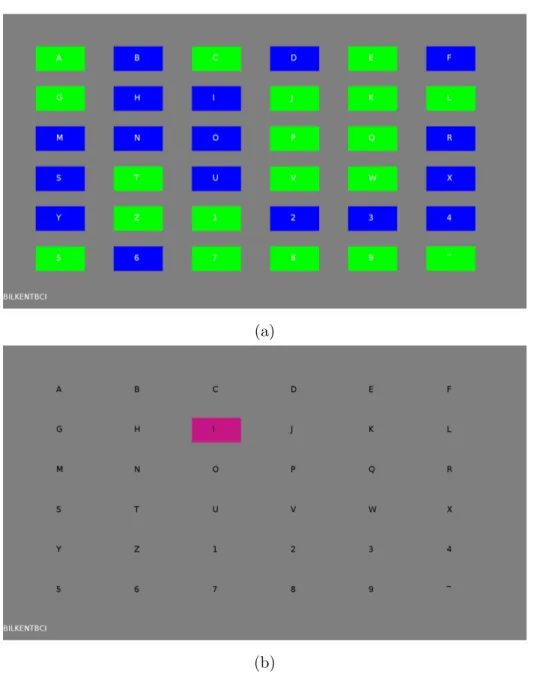
3.1 Two frames which were captured during the experiment for better understanding of our speller BCI. (a) A single frame was captured while each cell was flickering according to its own sequence. Each cell is either green if bit value of its sequence at that time is ‘1’ or blue if it is ‘0’. (b) Letter I was highlighted during an online session (test stage) in order to give feedback to the user. Also, letter I and the previously identified letters were displayed at the bottom left corner. At the training stage, reference target was also highlighted in the same way at the beginning. . . 24
LIST OF FIGURES xii
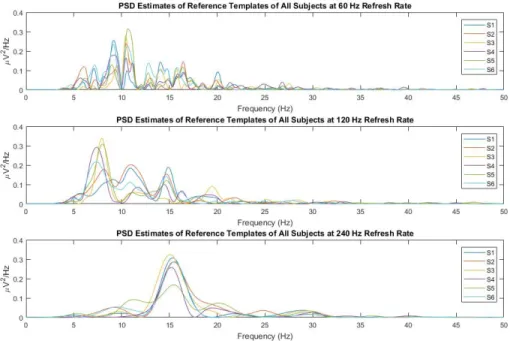
3.2 PSD estimates of reference templates of all subjects for E1, E2 and E3 from top to bottom. Results of each subject has its own colour and is given in legend of all graphs. Note that the c-VEP responses are band-limited nearly below 30 Hz. Also for this reason, the spectrums are drawn up to 50 Hz. . . 30
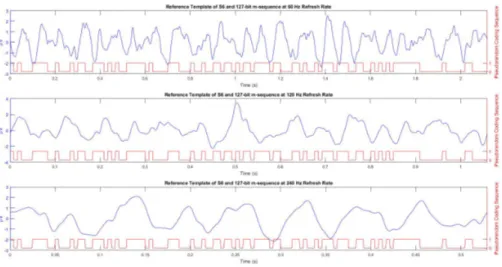
3.3 The pseudorandom coding sequences (red) and reference template of S6 (blue) obtained from E1, E2 and E3 from top to bottom. Left y-axis shows the microvolts values of templates and the right y-axis shows the binary values of the pseudorandom coding sequences. Note that time scales are different due to the difference between the duration of one code sequence at different refresh rates. . . 31
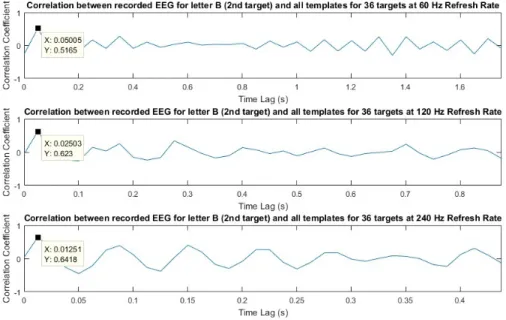
3.4 Correlation coefficients between the recorded EEG, when S3 fix-ated his/her gaze on to the letter B on the screen at online exper-iment (test stage), and 36 templates for E1, E2 and E3 from top to bottom. . . 32
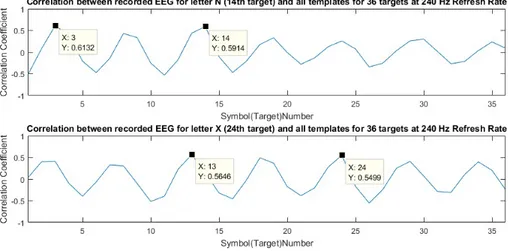
3.5 Correlation coefficients between the recorded EEG during test stage when S1 fixated his/her gaze on to the letter N and let-ter X on the screen and 36 templates for E3. Above graph shows the misclassification of letter N (14th target) occurs at one of the peaks of the periodicity which corresponds to letter C (3rdtarget).
Below graph shows the misclassification of letter X (24th target)
occurs at one of the peaks of the periodicity which corresponds to letter M (13th target). Note that x-axis shows the target indices. 33
3.6 Detailed view of the percent variances of each principal component to observe how many distinguishable responses could be evoked with a 127-bit length m-sequence for 60 Hz, 120 Hz and 240 Hz re-fresh rates. Percent variances of each principal component, where the data matrix, Dn×127 was constructed using the reference
tem-plate obtained from the experimental data of S1. The graphs be-long to E1, E2, and E3 from left to right. . . 34
LIST OF FIGURES xiii
4.1 Block diagram of Robinson’s corticothalamic model. The model consists of four main neuronal populations, excitatory (e) and in-hibitory (i) cortical neurons, thalamic reticular (r) neurons and thalamic relay (s) neurons. The blue blocks (H blocks) are the transfer functions (Hei, Hes, Hee, Hrs, Hre, Hse, Hsn, Hsr, andHγ) in
the form given by equation 4.4. The grey blocks (S blocks) rep-resent the nonlinear shifted sigmoid function in the form given by equation 4.1. The red blocks (v blocks) are the gain blocks which represent the synaptic connection strength between populations. There are also absolute time delay blocks between thalamus (relay nuclei and reticular nucleus) and visual cortex. The L is a sum-mation operator gathering the postsynaptic potentials. The φa is
the mean firing rate of the neuronal population a and Vab is the
mean membrane potential of neuronal population of a due to the mean afferent firing rate φb coming from the presynaptic
popula-tion b. The system takes input from φn(t) and the output of the
model (simulated EEG) is taken from Ve(t) as it represents the
mean membrane potential of the pyramidal cell population which is thought to be the main source of the recorded scalp EEG. . . . 39
4.2 PSD estimates of reference templates obtained from the model for 60 Hz, 120 Hz and 240 Hz from top to bottom. Note that the c-VEP responses are band-limited similar to the experimental results. Also for this reason, the spectrums are drawn up to 50 Hz. Note also that the scale of the y-axis for the graph of 240 Hz refresh rate is 0.1 times of the scales of other graphs. . . 43
LIST OF FIGURES xiv
4.3 Detailed investigation of correlation coefficients both in experi-ments and in simulations. (a) Correlation coefficients between the recorded EEG, when S3 fixated his/her gaze on to the letter B on the screen at online experiment (test stage), and 36 templates for E1, E2 and E3 from top to bottom. (b) Correlation coefficients between the simulated EEG for 2nd target at the test stage of simulation and 36 simulated templates for 60 Hz, 120 Hz and 240 Hz refresh rates from top to bottom. Note that the x-axis is time lag, and each consecutive template has a time lag of 0.05 seconds, 0.025 seconds and 0.0125 seconds for 60 Hz, 120 Hz and 240 Hz refresh rate. . . 44
4.4 Detailed view of the percent variances of each principal component to observe how many distinguishable responses could be evoked with a 127-bit length m-sequence for 60 Hz, 120 Hz and 240 Hz refresh rates. (a) Percent variances of each principal component, where the data matrix Dn×127 was constructed using the reference
template obtained from the experimental data of S1. The graphs belong to E1, E2, and E3 from left to right. (b) Percent variances of each principal component, where the data matrix D(n∗5)×127 was
constructed using the reference template obtained from simulated EEG data. The graphs belong to 60 Hz, 120 Hz and 240 Hz refresh rates from left to right. . . 46
4.5 Model responses to 1-bit Pulse (blue) and the pulse itself (red) are given for 60 Hz, 120 Hz and 240 Hz refresh rates. The left y-axis shows the amplitude of simulated EEG while the right y-y-axis shows the amplitude of the input to the model. The 1-bit pulse was applied at the fifth second of the simulation time. The duration of this pulse is 16.7 ms, 8.3 ms, and 4.17 ms, which are the periods of 60 Hz, 120 Hz, and 240 Hz refresh rates respectively. The system oscillates at alpha frequency when only a DC input and a noise is applied. The model response to a 1-bit pulse tends to diminish at higher refresh rates. . . 49
List of Tables
2.1 Several neuroimaging approaches and their properties . . . 7
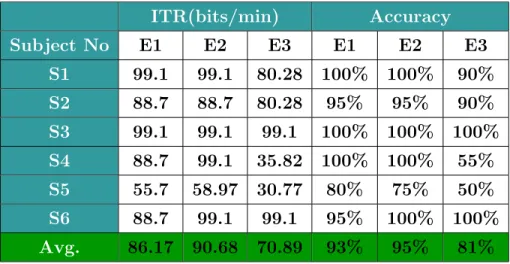
3.1 ITR values and accuracies for each subject and for each experi-ment. The bottommost row highlighted with green gives the aver-age ITR and accuracy values for each experiment. Recall that E1 is the experiment with 60 Hz monitor refresh rate, E2 is the exper-iment with 120 Hz monitor refresh rate and E3 is the experexper-iment with 240 Hz refresh rate. . . 29
4.1 The parameter set that we have used to run the model. These values are taken from Roberts and Robinson’s study in 2012 where the authors drove this model with a square wave input. . . 41
Chapter 1
Introduction
1.1
Motivation and Objective
A brain-computer interface (BCI) is a communication channel between exter-nal environment and the human brain through which brain activities are inter-preted and/or directly translated into commands to control external devices [1]. Electroencephalography (EEG) based BCIs have been widely used in the field of neural engineering and clinical rehabilitation due to their non-invasiveness, porta-bility, and temporal resolution [1]. Among various BCI paradigms [2, 3], visual evoked potential (VEP) based BCIs have received increased interest in recent years [1, 4, 5].
The code-modulated visual evoked potential (c-VEP) paradigm is proven to be superior compared to other commonly used VEP based BCI paradigms with the advantages of less training time, high information transfer rate (ITR), high target number, high accuracy rates and ease of use [6, 7]. In a c-VEP based BCI, a binary pseudorandom code sequence and its time lagged versions are used to modulate visual stimuli which are assigned to different selectable targets [6, 7, 8, 9, 10]. If a person focuses his/her gaze to one of the targets, c-VEPs
are observed in the recorded EEG over the occipital lobe. As a binary pseu-dorandom coding sequence, m-sequence is generally chosen because of its good autocorrelation properties [11].
There are several studies on c-VEP based BCIs in recent years that yield im-portant results regarding the performance (information transfer rate (ITR) and accuracy) of the system [6, 7, 8, 9, 10, 12, 13, 14, 15, 16]. The study of Bin et al. [7] had attracted great interest in BCI community back then since they had reached the highest ITR among EEG-based BCIs at that moment. In order to further increase the performance of the c-VEP paradigm some studies suggest new classification algorithms (e.g., support vector machines (SVM), canonical correlation analysis with SVM, spatio-temporal beamforing, cross-frequency cou-pling estimator) and some studies have investigated the stimulus properties (e.g., length of the modulation sequence, proximity of the stimulus, stimulus color, coding sequence itself).
Speed is a key factor in BCI applications to become more practical and more widely accepted. Since the display time of a single bit in the pseudorandom coding sequence is limited by the refresh rate of the monitor, the overall speed of a c-VEP based BCI somewhat depends on this rate. To the best of our knowledge, there are only two very recent studies of c-VEP based BCIs with fast stimulus presentation rates above the traditional 60 Hz [9, 13]. Our goal is to investigate and report the effects of high stimulus presentation rates on a c-VEP based speller BCI.
c-VEP responses have never been studied before with a cortical model although such models can explain many EEG phenomena [17, 18]. We have used Robinson’s corticothalamic model [17] to bring a rational explanation to the salient properties of c-VEP responses observed in our experiments. Also, this model will then be verified for explaining c-VEP responses for the first time.
1.2
Scope of the Study
This study reports the experimental investigation of the effects of high stimulus presentation rate on c-VEP based speller BCI. To this end, three different ex-periments with refresh rates of 60 Hz (E1), 120 Hz (E2) and 240 Hz (E3) have been conducted. From the gathered experimental data, we have identified the salient behaviours observed in the experiments and how they are affected by high stimulus presentation rates. Considering the observed behaviors and character-istics of c-VEP responses, we have also suggested which stimulus presentation rate is better for BCI applications under certain conditions (number of target). In the second part of the study, Robinson’s Corticothalamic Model, which is a cortical model consisting of four neuronal populations, is utilized to model and simulate the c-VEP experiments in order to again bring rational explanations for the observed properties in our experiments. For this purpose, the model was implemented in Simulink environment and simulations were done following the same experimental procedure of ours.
1.3
Organization of the Thesis
This thesis consists of five chapters:
In chapter 2, background information regarding Brain-Computer Interfaces (BCIs), Code-Modulated Visual Evoked Potential (c-VEP), and models of the brain is provided. First, a simple explanation of BCI is given. Then, Electroen-cephalography (EEG) and why it is preferred for BCI applications are explained. Next, the concept of Visual Evoked Potential (VEP) is explained and is further narrowed down to Code-Modulated Visual Evoked Potentials. Lastly, the general approach of modelling of the brain is explained.
In chapter 3, the experimental approach to investigate the effects of high stim-ulus presentation rate on c-VEP based BCI is explained in detail. First, earlier
studies of c-VEP based BCIs, in which different approaches to increase the per-formance of the system are provided. Then, our experimental procedure and data analysis are explained and the results of our experiments are presented. Finally, this chapter concludes with discussion relevant to the results presented.
In chapter 4, the model based approach to investigate the effects of high stim-ulus presentation rate on c-VEP based BCI is explained in detail. The chapter starts with the explanation of the implementation of the Robinson’s corticotha-lamic model and the procedure of simulation of c-VEP experiments. Then, the results obtained from simulations are presented to the reader and finally the ob-tained results are further discussed.
In chapter 5, results obtained in chapters 3 and 4 are summarized and re-evaluated. In this chapter, it is also discussed to what extent Robinson’s cor-ticothalamic model is sufficient in explaining the observed properties of c-VEP responses in the experiments.
Chapter 2
Background
2.1
Brain-Computer Interfaces (BCIs)
BCI is a hardware and software communication system which transforms the user intentions to control signals in order to communicate with the external world/devices by analysing the brain activity [1, 2, 3, 6]. The main aim of BCI research is to help individuals with severe motor disabilities to create a new way of communication channel.
A BCI application consists of four stages: signal acquisition, preprocessing of the acquired signal, feature extraction, and classification and control interface [19].
• In the signal acquisition stage, the brain activities, which can be either elec-trophysiological or hemodynamic, have been recorded. Elecelec-trophysiological activity is generated by the current flows inside the neurons and between the neurons and neuronal assemblies [20]. The hemodynamic activity is the result of the process in which the blood releases glucose to active neurons at higher rate than to inactive neurons which causes a distinct change in the ratio of oxyhemoglobin to deoxyhemoglobin [21].
• In the preprocessing stage, the recorded signals are processed (filtered, structured etc.) to a suitable form for further analysis.
• In the feature extraction stage, the desired information from the recorded signals are discriminated according to the type of the BCI application. Spectral analyses, correlation relations, voltage amplitude measurements are some of the feature extractions methods. This is not an easy task to do since other brain and muscle activities (electromyohraphy (EMG) or elec-trooculography (EOG)) interfere with the signals recorded from the brain. • In the classification and control interface stage, from the extracted features, user intentions are decoded into commands to communicate individual’s sur-roundings. These commands then sent to the external devices via control interface. Mostly, the external device is a computer screen and the com-mand (output of the system) is the selection of targets, letters/numbers displayed on it [22, 23]. One such BCI application is speller BCI which is one of the most commonly studied applications [24] and is also adopted in this thesis and will further be explained in following sections.
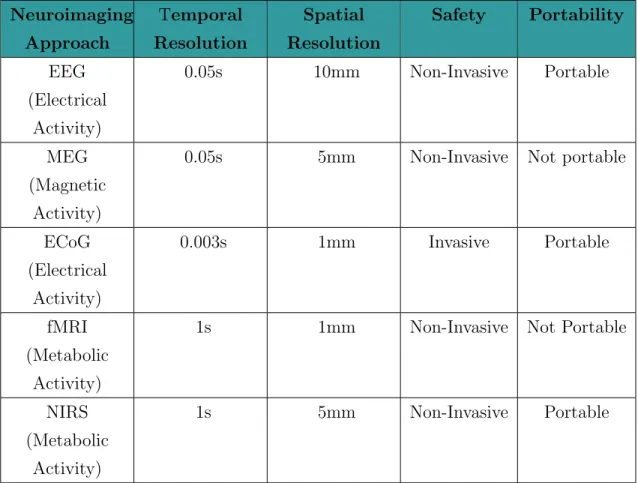
Table 2.1 [3] gives several neuroimaging techniques and their properties in de-tail. As it can be seen from this table, electroencephalography (EEG) is most widely used neuroimaging approach in BCIs to record stimulus driven brain ac-tivity thanks to its high temporal resolution, low cost, portability and safety [3].
Table 2.1: Several neuroimaging approaches and their properties Neuroimaging Approach Temporal Resolution Spatial Resolution Safety Portability EEG (Electrical Activity) 0.05s 10mm Non-Invasive Portable MEG (Magnetic Activity)
0.05s 5mm Non-Invasive Not portable
ECoG (Electrical Activity) 0.003s 1mm Invasive Portable fMRI (Metabolic Activity)
1s 1mm Non-Invasive Not Portable
NIRS (Metabolic
Activity)
1s 5mm Non-Invasive Portable
2.2
Electroencephalography
(EEG)
as
Neu-roimaging Approach
EEG is the recorded electrical brain activity through electrodes on scalp caused by the current flows during synaptic excitations between neurons. An EEG record-ing system consists of electrodes (either passive or active dry/wet electrodes), amplifier, analog-to-digital converters and a recording device (PC). The record-ing device, PC, stores the acquired data. A very simple configuration for EEG measurement consists of one active, one reference and one ground electrode in which the potential difference between active electrode and the reference elec-trode is referred as EEG signal while the ground elecelec-trode is used to measure
the differential voltage between the active and reference electrode sites. Gener-ally, multi-channel configuration is used. There are two types of recordings: (i) Potential difference between each electrode site and a specific reference electrode site is measured. This is called unipolar recording. (ii) Potential difference be-tween any pair of electrode sites is measured. This is called bipolar recording. The electrodes that are used for recording EEG are usually made of Ag/Cl [25]. As previously mentioned, its spatial resolution is not good which results in a background noise either from other brain activities or muscle activities. In order to minimize this background noise, the potential between scalp and electrodes should be kept low. Hence, the electrode impedances should be kept below 10kΩ in order to record healthy EEG signals [26]. A conductive gel is generally applied between electrodes and skin to reduce this impedance. There are also active elec-trodes which have preamplification circuit on the recording site. There are also dry electrodes with a special design of needle like tips at the recording site which gives also an adequate performance without applying conductive gel to the skin [27]. Still, the subjects/users should stay stationary during the EEG recording necessary precautions should be taken into consideration such as distance from power line source, cable shielding and length etc. The electrical brain activity is in microvolts therefore a typical EEG amplifier has a gain of x100000 range.
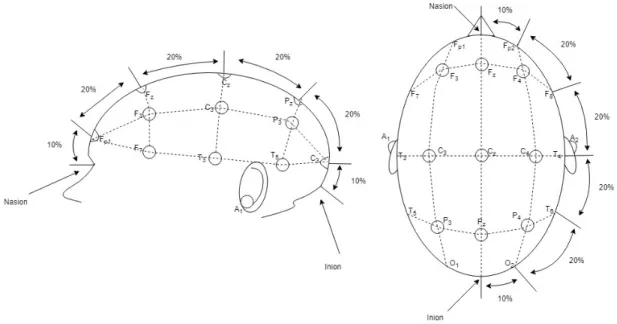
The electrodes are placed over scalp commonly according to the International 10-20 system [28]. This system uses two reference points in the head to define the electrode positions. On of these reference points is nasion which is located on the top of the nose where the forehead and nose intersects. The other one is inion which is located at the lower rear part of the human skull. The electrode locations are chosen by marking the certain intervals (10% and 20%) on transverse and median planes which divide the skull from these two reference points [28] and are given in Figure 2.1. Each brain region is represented with a letter: letter A represents the ear lobe, letter C represents the central region, letter P represents the parietal, letter T represents the temporal, letter F represents frontal and letter O represents the occipital region in human cortex.
Figure 2.1: Electrode placement over scalp according to International 10-20 sys-tem
EEG consists of 5 frequency bands which are all related to a different state of mind or action: delta (δ), theta (θ), alpha (α), beta (β) and gamma (γ). The 0-4 Hz frequency band is referred as delta band. These components are observed in deep sleep states in adults [29]. They are generally mixed with the artifacts from muscles of neck and jaw and generally filtered out during an experiment. The 4-7 Hz frequency band is referred as theta band. This band is related with meditative concentration and cognitive tasks (e.g., mental calculation, maze solving) [30, 31, 32, 33]. The 8-12 Hz frequency band is referred as alpha band and the alpha waves are observed in occipital lobe of the brain (back of the head) [34]. The amplitude of alpha waves strongly increases when the eyes are closed and in a relaxed state. However, their amplitude decreases with increasing mental effort [35]. Therefore, the alpha waves are useful in order to measure the state of mind especially in measuring attention. The 12-30 Hz frequency band is referred as beta band and it is associated with the motor activities in the frontal and central regions of the cortex. They are suppressed by motor imagery tasks or movement itself [36]. The 30-100 Hz frequency band is referred as gamma band and thought to be related with certain motor functions and perception of visual and auditory
stimuli [37, 38, 39, 40].
As previously mentioned EEG is the most widely used neuroimaging approach in BCI applications. Since the brain rhythms are well distinguished according to state of mind or actions, one can turn them into control signals (paradigms) or event-related potentials (ERP) [3] by applying stimulations in order to enable a BCI system to interpret user intentions. Among EEG-based BCI paradigms, visually evoked potential (VEP) based BCIs have received increased attention in recent years [1, 4, 5] and also is adopted in the scope of this thesis.
2.3
Visual Evoked Potentials (VEPs)
VEPs are elicited in the visual cortex as a result of a visual stimulus [41]. Stimu-lation of the central visual field or even the full visual field evokes larger responses at EEG [3, 6] recorded from the back of the head where primary visual cortex reside. In a VEP based BCI, each target is stimulated according to its own stim-ulus sequence which can elicit VEPs. Targets can be either letter/numbers on a screen, arrows to control an external device (wheelchair, quadcopter etc.), or dif-ferent commands in a game. A fixation of gaze to any of the target elicits a unique VEP and thus the user’s intentions can be identified. Depending on the specific stimulus modulation approach VEPs can be separated mainly into two categories [6]: (i) frequency-modulated VEPs (f-VEPs) are elicited by a visual stimuli with a specific frequency above 6 Hz. In the frequency domain of the recorded EEG, one can observe high power at the frequency of the stimulus and its harmonics [42] (ii) code-modulated VEPs (c-VEPs) are elicited by a light source where the duration of ON and OFF states is determined by a pseudorandom sequence.
2.4
Code-Modulated Visual Evoked Potentials
(c-VEPs)
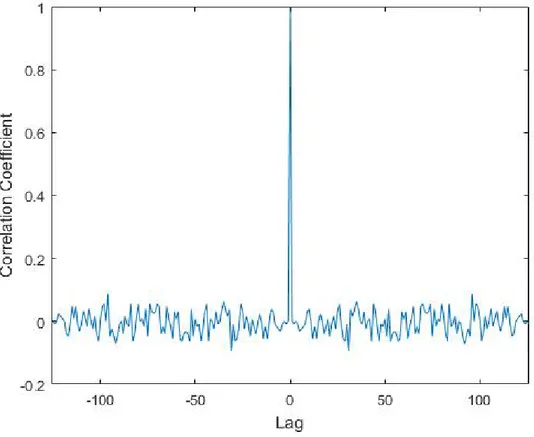
Code-modulated visual evoked potential (c-VEP) is the evoked response as a result of a visual stimulus which is modulated by a pseudorandom coding se-quence. This sequence is generally a binary sequence consists of ’1’s and ’0’s which determines the duration of ON and OFF states of the light source. As a binary pseudorandom coding sequence, m-sequence is generally chosen because it is nearly orthogonal to its time lag versions and it has an autocorrelation func-tion which is very close to a unit impulse funcfunc-tion [11] (See Figure 2.2). This sequences are in a length of 2m − 1, where m is the size of the maximal linear
feedback shift registers used in generating such sequences [11].
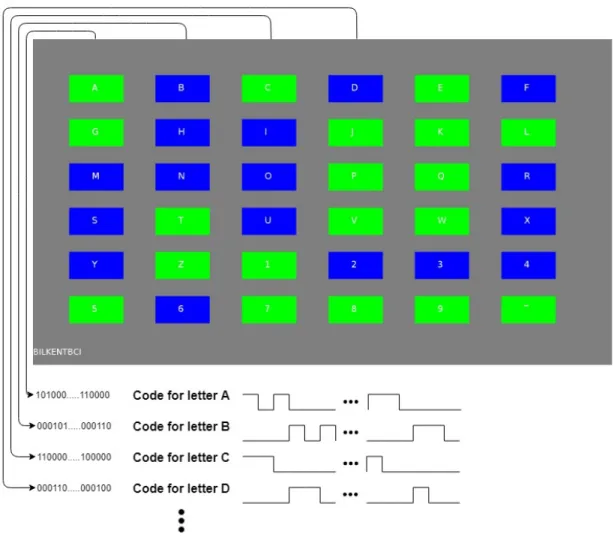
In a c-VEP based BCI, this m-sequence and its time lagged versions are used to modulate visual stimuli which are assigned to different selectable targets [6, 7, 8, 9, 10]. Figure 2.3 shows the screenshot during one of our experiments. Each target is flickering (green if the bit value is ’1’, blue if it is ’0’) according to their own 127-bit m-sequence. The sequence which belongs to the letter A is the original m-sequence we have used and each target was assigned a 127-bit sequence which is circularly 3 bits time lagged version of the previous target’s sequence starting with letter A. There are some studies which have investigated the optimum code length and time lag between targets [10]. We have used blue/green flickering but the most traditional one is black/white flickering (white if the bit value is ’1’, black if it is ’0’). Due to the m-sequence’s good autocorrelation properties, the evoked EEG over the occipital lobe by fixating the gaze to one of the targets is assumed to be also orthogonal with the evoked EEGs when the subject/participant fixate his/her gaze to any other target. Hence, c-VEP responses are investigated in time-domain.
Figure 2.3: A screenshot during one of our experiments. Letter A was assigned with the original 127-bit m-sequence. The consecutive targets are assigned with the circularly 3 bits time lagged versions of the previous target’s sequence starting with letter A. Only the first four coding sequences are shown in this figure.
c-VEP paradigm requires a training stage. Basically at the training stage, the subject has been asked to fixate his/her gaze to a reference target and the sequence is repeated N times. The recorded EEG during this time is then averaged over N cycles to obtain a reference template. The number N should be large (typically > 100). The templates for other targets are generated by circularly shifting each consecutive template by a time lag of j bits starting with the reference template thanks to the m-sequence’s properties where the number j depends on the application itself. At the test stage, the subject has been asked to write a
sequence of letters/numbers. Again the subject fixates his/her gaze to the desired target and the sequence is repeated N times. This time, N can be small (typically < 4) depending on the application. To determine which target the subject had fixated his/her gaze to, the correlations between the recorded EEG during test stage and the templates obtained in the training stage are calculated.
2.5
Quantitative Models of Cortex
The cortex has a structured design which is horizontally organized in layers of different types of cells. There are six layers of neurons and about 40 types of neu-rons have been identified in the cortex [43]. Neuneu-rons are the principal components of the nervous system in that they receive, process and transfer the information throughout the nervous system. This information transfer is explained by chem-ical and electrchem-ical signals. Neurons have resting membrane potential which is the potential difference between extracellular space and the neuron’s membrane potential itself. Neurons have voltage-gated ion channels in their membrane and are closed when the membrane potential is near the resting membrane potential. Neurons make synapses with other neurons which causes temporary changes in resting membrane potentials and this temporary changes in the membrane po-tentials are called post-synaptic popo-tentials (PSP). As a result of these PSPs, the ion channels begin to open which in turn cause an increased difference in ion concentrations between the extracellular space and inside the membrane. This increase in difference then causes the membrane potential to further increase which results in a spike-like voltage waveform. These spikes are termed as action potentials (APs). The information between neurons and within nervous system is encoded by the frequency and the timing of APs.
The generation of APs in single neuron was modeled as a circuit where the differences in concentrations are modeled as voltage sources, cell membrane is modeled as a capacitor and the ion channels are modeled as resistors by Nobel
wining scientists Alan Hodgkin and Andrew Huxley, also known as Hodgkin-Huxley model (H-H Model) [44]. They have translated this circuit into mathe-matical equations to explain the ionic mechanisms underlying the generation and propagation of APs in the longfin inshore giant squid axon. Such neuronal models contribute to understanding the underlying mechanism of neuronal computations at the microscopic level [45, 46].
Neurons in the cortex can be divided into two groups: (i) Projection neurons which are excitatory cells and mostly they have body of a pyramidal cell and reside in layers III, V and VI of the cortex (ii) Local inter-neurons which are found to be in all layers and generally are inhibitory.
The cortical column is the basic functional unit of the cerebral cortex which consists of six distinct layers of neurons oriented perpendicular to the cortex and respond similarly to a certain stimulation. Many studies relate these cortical columns with sensory functions. There are approximately 100 million cortical columns in the neo-cortex (the largest part of the cortex) with up to 110 neu-rons each [47]. Higher level processes such as movement and cognition cannot be explained by single neuron studies [48, 49]. Such processes arise from inter-actions of crowded neuronal populations. At the microscopic level, anatomically, the structured information flow between layers and between cortical columns are really complex and this interaction cannot be modeled by modeling millions of individual neurons.
Modeling millions of individual neurons and identifying/calculating all the connections between them is not feasible. Also, single-cell spikes are highly non-linear and should be transformed to suitable dynamics in the macroscopic level [50]. This transformation is done by mean-field approximation which is mainly used in statistical physics [51] to study the behavior of large and stochastic model, which has large number of small individual components that interacts with each other, by studying a simpler model. It approximates the effect of all the other individuals on any given individual by a single averaged effect. This is the exact problem what neuroscientists have in hand to model the brain. Mean-field neu-ral models explain the collective behavior of a crowded neuron population rather
than explaining the behavior of individual neurons [52]. Since EEG represents the collective activity of neuronal populations consisting of thousands of neurons [53], these models are more likely to be appropriate for explaining the experimental data obtained with non-invasive and low spatial resolution imaging techniques.
2.5.1
The Neural Ensemble Approach
The simplest approach of such modeling studies is the ensemble approach which assumes the states of individual neurons are irrelevant and the states of neurons across ensembles are uncorrelated. Central limit theorem suggested that the sum of uncorrelated random processes (individual neuron’s firing rate or membrane potential) converges to a Gaussian probability distribution (activity of ensemble of neurons) [51]. Hence, the activity of a neuronal population can be expressed as the mean and the variance of the firing rate [54]. The mean firing rate repre-sents the response of the population to its total synaptic inputs and the variance represents how robust the response of the ensemble of neurons to the stochastic influences at microscopic level.
Fokker-Planck equation (FPE) is used to represent the dynamics of such linear and Gaussian distributed neural ensemble. An FPE can be derived from simple single-neuron models such as integrate-and-fire model under the assumption of diffusion approximation [55, 56]. Briefly, FPE calculates the mean firing rate of a neuronal population and if the input to the neural ensemble changes, FPE also calculates the change in variance and the mean firing rate of that population. As this approach provides a dimensionality reduction by finding an aggregated re-sponse of a population rather than finding each rere-sponse of thousands of neurons, it seems to be a promising origin of the modeling studies of the brain. However, as previously mentioned, there are some strong coherence within some neuronal populations [50] which leads us to Neural Mass Models (NMMs).
2.5.2
Neural Mass Models
If there is a strong coherence within a neural population, it is possible to state that the activity of the population becomes closer to its mean and thus variance can be discarded. Ensemble approach reduces the dimensions of thousand to only two and now this approach further reduces the dimensionality from two to only one. This, enables of modeling multiple interacting local neuronal populations (e.g., excitatory and inhibitory neurons) in different layers of the cortex with a small amount of equations [57, 58]. Each neural ensemble is now assumed as a point-mass [59] and the name neural mass models (NMMs) comes from this assumption.
In NMMs, the effect of the variance is ignored in the membrane potentials within a neural ensemble and the mean membrane potential is modeled as it is modeled in single-neuron models by replacing the all-or-nothing approach with a sigmoid function which relates the average membrane potential to the mean firing rate as in the form of equation 2.1. To describe the average membrane potential of the population, NMMs mostly consist of second-order nonlinear differential equations as in the form of equation 2.2.
φ = S[V ] = Q 1 + e−rV (2.1) V ( 1 α2 d2 dt2 + 2 α d dt + 1) = φ (2.2)
In equation 2.1, V represents the mean membrane potential of the population, φ represents the mean firing rate of the population, Q represents the coupling constant and r represents the variance in the firing rate of neurons. In equation 2.2, α represents the the rise time of membrane potential in response to the firing rate φ.
2.5.3
Networks of Neural Masses
Still, a NMM models a local population of neurons, but for larger scale modeling of the brain, we need the interaction of every such population in mesoscopic [52, 60] and macroscopic scales [61]. Each neural population reflects the activity within the same neural population and also some stochastic influences from other regions. In order to enhance this stochastic influence, an anatomical discrete connectivity must be introduced which is also called connectome. The resulting whole brain dynamic models are called Brain Network Models (BNMs) and they integrates very valuable works throughout the decades [62, 63, 64, 65].
2.5.4
Neural Field Models
Different from BNMs, the neural field modeling approach treats the connectivity as continuous, which decays exponentially with increased distance, rather than having discrete values [66]. Such continuous field models use relative distance between nodes and the speed of the AP propagation for the calculation of mem-brane potential and firing rate of neuronal populations different from equations 2.1 and 2.2 which is in the form of a wave equation [67, 68]:
φ = S[V ] = Q 1 + e−rV (2.3) V ( 1 α2 d2 dt2 + 2 α d dt + 1 − r 2 O2) = (1 + 1 α d dt)φ (2.4)
Here now alpha = cr where c is the AP propagation speed, r is the relative distance between nodes and O2 is the Laplacian. The mean membrane potential and mean firing rate are now functions of space and time. This approach is more reasonable than the BNM approach since it is proven that coupling between
Chapter 3
Experimental Investigation of the
Effects of High Stimulus
Presentation Rate on
Code-Modulated Visual Evoked
Potential Based Brain-Computer
Interfaces
3.1
Earlier c-VEP Studies
There are several studies regarding c-VEP based BCIs which have documented in recent years. The study of Bin et al. [6] was then a groundbreaking one in BCI community since it has reached the highest ITR (108 ± 12 bits/min) among EEG-based BCIs at that moment. They have used the traditional template matching algorithm with canonical correlation analysis (CCA) for multichannel processing to decode c-VEPs. In their paper, they suggested two new areas of investigation which are (i) effect of the screen refresh rate of the screen where the stimulus is
presented and (ii) finding a new coding sequence which gives sharp autocorrelation function of c-VEP [6].
In order to further increase the performance of the c-VEP paradigm some studies suggest new decoding algorithms. Sp¨uler et al. used one-class support vector machines (OCSVM) to obtain templates with an adaptation based on error-related potentials for target identification. They achieved an average ITR of 144 bits/min with their 32-target system [8]. Aminaka et al. also stated that SVM with a linear kernel provides more accurate results than the traditional algorithms [12]. As Bin et al. suggested in 2011 [7], Wittevrongel et al. investi-gated 120 Hz stimulus presentation rate for the coding sequence in addition to 60 Hz stimulus presentation rate with a novel decoding algorithm based on spatio-temporal beamforming and reported maximal median ITR of 100.46 bits/min and 172.82 bits/min for 60 Hz and 120 Hz monitor refresh rate respectively with their 32-target system [9]. Also, Gembler et al. compared the performance of a c-VEP based BCI and its user friendliness with three different refresh rates (60 Hz, 120 Hz and 200 Hz) and reported an average ITR of 37.94 bits/min, 38.16 bits/min and 37.22 bits/min for 60 Hz, 120 Hz and 200 Hz stimulus presentation rates respectively with their 16-target. They also stated that 200 Hz stimulus presentation rate was the most user friendly one [13]. In a more recent study, Dimitriadis and Marimpis presented a new approach for a BCI system where they implemented cross-frequency coupling (CFC) estimator, namely phase-to-amplitude coupling (PAC) [14]. They have used three different publicly available BCI data sets where one of them belongs to the study of Wittevrongel et al. [9]. With this dataset, they outperformed the previous performance of Wittevron-gel et al. with an average ITR of 124.40 ± 11.68 bits/min and 233.99 ± 15.75 bits/min for 60 Hz and 120 Hz stimulus presentation rates respectively [14].
Additionally, some studies investigated the stimulus properties. Aminaka et al. investigated effect of the color of the stimuli in a c-VEP based BCI [15] while Isaksen et al. studied the optimal pseudorandom sequence selection [16] in
stimulus color, proximity of the stimulus, length of modulation sequence, and time lag between the codes of two adjacent stimuli are important parameters which affect the performance of the system and stated that individually, stimulus size of visual angle 3.8◦, white, spatial proximity of visual angle 4.8◦ center to center apart, modulation length of 63 bits and time lag of 4 bits yield superior performance.
In this part of the study, our goal was to investigate and report the effects of high stimulus presentation rates on a c-VEP based speller BCI with an exper-imental approach. To this end, we conducted three different experiments with refresh rates of 60 Hz (E1), 120 Hz (E2) and 240 Hz (E3) and identified the salient properties of c-VEP responses in these experiments.
3.2
Materials and Methods
3.2.1
Experimental Design
6 healthy (no neurological or psychiatric disorders) subjects with a mean age of 23 (5 males, 1 female) participated in the experiments. All subjects have normal or corrected-to-normal vision. Prior to the experiments, all subjects signed an informed consent form approved by the ethical committee of Bilkent University which explains the objectives of the study and that flicker stimulation may cause epileptic seizures.
A speller BCI was designed as a visual stimulus in MATLAB (The Math-Works, Inc., Natick, MA, USA), using Psychtoolbox [70, 71, 72]. Ubuntu 16.04 with a low-latency kernel was preferred as the operating system on the computer where the stimulus was presented in order to provide accurate timing. Spe-cific attention was paid on Psychtoolbox’s missed flip counter in order to make sure that the number of dropped frames is zero during all stages of an experi-ment. This computer is called stimulus computer in the rest of this document for easy referral. The visual stimuli were presented on 25-inch LED monitor
with a refresh rate up to 240 Hz and a resolution of 1920 × 1080 pixels (Dell Alienware AW2518HF). There were 36 symbols (letters/numbers) which were placed as a 6 × 6 matrix on the screen (see Figure 3.1). Generally, 32-target system is preferred and a 63-bit length m-sequence and its 2 bits time lagged versions are used to stimulate 32 symbols but with 32 symbols, one cannot cover all letters and numbers. Therefore, as a pseudorandom coding sequence, since neither of the studies that investigates the stimulus properties states an opti-mum length and type of pseudorandom sequence for speller BCIs and since we have 36 symbols, a m-sequence with a length of 63 with a time lag of 2 bits is not sufficient to cover 36 symbols. In order to obtain maximum speed and accuracy, a m-sequence with a length of 127 and a time lag of 3 bits were selected: 10100011110010001011001110101001111101000011100010010011011010 11011110110001101001011101110011001010101111111000000100000110000
This code was assigned to letter A which is in the first row and first column of the symbol matrix. By introducing successive cyclic 3 bits (three frame) time lags to this code, a total 36 codes were obtained and these were assigned to the symbols in alphanumeric order show in Figure 3.1. Each cell on this matrix is a rectangle with a size of 90 × 180 pixels with a letter/number positioned at the center of this rectangle. These cells flicker (green if bit value is ‘1’, blue if bit value is ‘0’) according to their own 127-bit m-sequence (see Figure 3.1a). We have chosen green/blue flickering because Parra et al. stated that green/blue flickering is the safest combination for avoiding photosensitive epilepsy [73]. At the beginning of every bit (at each new frame), a marker pulse was also transmitted from the stimulus computer to the EEG amplifier.
There were two stages for each experiment, namely, (i) training stage and (ii) test stage. In the training stage, subjects were asked to fixate their gaze on the reference target. At the start of the experiment, the cell that contains the reference target was highlighted in pink for 2 seconds (see Figure 3.1b) to indicate to the subject which symbol to focus on. After two seconds, each cell
monitor, the training time for E1 was 3.53 minutes. Similarly, for E2 and E3, training times were 1.76 min and 53 seconds, respectively.
(a)
(b)
Figure 3.1: Two frames which were captured during the experiment for better understanding of our speller BCI. (a) A single frame was captured while each cell was flickering according to its own sequence. Each cell is either green if bit value of its sequence at that time is ‘1’ or blue if it is ‘0’. (b) Letter I was highlighted during an online session (test stage) in order to give feedback to the user. Also, letter I and the previously identified letters were displayed at the bottom left corner. At the training stage, reference target was also highlighted in the same
In the test stage, subjects were required to write a sequence of 20 symbols. At this stage, there was no highlight to indicate to the subject which symbol to focus on. At the start of the experiment, the matrix was displayed for 2 seconds to give time to the subject to fixate his/her gaze on the first symbol of the symbol sequence. After 2 seconds, each cell on the matrix flickered according to its own sequence. The sequence was repeated 1 time, 2 times and 4 times for E1, E2 and E3 respectively. After the number of repetitions were complete, the stimulus computer raised a flag over TCP to indicate that the data is ready for target identification. Our system then decides which symbol the subject had focused on. Then, to give feedback to the subject and also to give him/her time to switch his/her gaze onto the next symbol, the cell that contains the decided symbol was highlighted in pink for 1 second and also was displayed at the bottom left corner of the screen (see Figure 3.1b). The time required for the feedback and gaze-shifting could have been made shorter but our aim was not to develop the fastest c-VEP based BCI. This procedure continued for 20 symbols. The time required for the system to decide which symbol the subject looked at is 3.13 seconds (including stimulation length of a sequence, classification and time needed to switch the gaze) and was the same for all three refresh rates. A questionnaire was also given to the subjects after the experiments asking at which frequency they felt more comfortable.
3.2.2
Data Acquisition
The EEG was recorded with Brain Products V-Amp 16 channel EEG amplifier along with actiCAP, a standard 10-20 EEG cap with 32 electrode sites (Brain Products, Gilching, Germany). EEG was recorded from electrodes “O1, Oz, O2, Pz, P3, P4, P7, P8” and they were referenced to FCz electrode. The ground electrode was placed over nasion, on the forehead. The electrodes are active and ImpBox (Brain Products, Gilching, Germany) was used to measure the impedance values of electrodes. Wet electrodes were used and electrode impedances were kept below 10 kΩ. The sampling rate was 2 KHz.
BCI2000 [74] and FieldTrip [75] were used together to record the EEG and marker pulses simultaneously and to transmit these signals to a MATLAB ses-sion on another computer (recorder computer) in real time. Pre-processing and classification (target identification) were done in MATLAB on this computer.
3.2.3
Data Pre-processing and Classification
At the training stage, subjects were asked to fixate their gaze on the reference target, letter A, and the sequence was repeated 100 times. A raw signal X(k×s)
where k = 8 is the number of channels and s = 100 × n where n=sampling rate × duration of one sequence. For E1, E2, and E3 n is equal to 4234, 2117, and 1058 respectively. Another channel is also simultaneously recorded which contains the marker pulses and its size is 1 × s. A 4-121 Hz band-pass filter (since the highest refresh rate was 240 Hz) and a 50 Hz notch filter were applied to each row of X(k×s) to eliminate 50 Hz interference, DC offset and slow components
due to head movements. By using the information of marker pulses, each EEG channel was averaged over 100 cycles and a multichannel averaged EEG signal A(8×n) was obtained. A(8×n)was then replicated column-wise 100 times to obtain
the replicated averaged c-VEP response Y(8×s). X and Y were then subjected
to canonical correlation analysis (CCA) which is a maximization procedure as defined below: maxwx,wy E[WT x XYTWy] E[WT xXXTWx]E[WyTY YTWy] ) (3.1)
where Wxand Wy are 8 × 1 vectors which are the spatial weighting coefficients
applied to X and Y respectively [76]. The goal of CCA is to find the Wx and
Wy which maximize the correlation between the 1 × s signals WxTX and WyTY .
MATLAB’s canoncorr function was used. The output of this function are two weight matrices and only the first columns of these matrices were used as Wx
At the test stage, subjects were required to write a sequence of 20 symbols. As previously mentioned in experimental design section, each cell on the matrix was flickering according to its own sequence and the sequence was repeated 1 time, 2 times and 4 times for E1, E2 and E3, respectively. After the number of repetitions were complete, a 4-121 Hz band-pass filter and a 50 Hz notch filter were applied to the recorded EEG to eliminate 50 Hz interference, DC offset and slow components due to head movements. By using the information of marker pulses, each EEG channel was averaged over 1 (i.e., no averaging), 2, or 4 cycles for E1, E2 and E3 respectively and a multichannel averaged EEG signal S8×nwas
obtained. This signal was multiplied with the WT
x and the Pearson’s correlation
coefficients were calculated between the templates found in the training stage and the signal WxTS. The symbol of the template with the highest correlation was decided as the target symbol which the subject had fixated his/her gaze to. This information was transmitted over TCP to the stimulus computer in order to give feedback to the subject.
3.2.4
Performance Evaluation and Data Analysis
For each experiment ITR and accuracies were calculated. We used the commonly used ITR calculation [1] to evaluate the performance of our system and is given as follows:
IT R = 60
T × (log2N + P log2P + (1 − P )log2 1 − P
N − 1) (3.2) where N is the number of possible target choice which is 36, P is the accuracy of target identification and is calculated by correctly classified symbols divided by 20 (length of the symbol sequence), and T is the time required for our system to make a selection (in seconds) which is 3.13 seconds.
Power spectral density (PSD) estimates of reference templates of all subjects for E1, E2 and E3 were calculated using periodogram function of MATLAB to observe the change in frequency content of c-VEP responses for different refresh rates.
We have used principal component analysis (PCA) to observe how many dis-tinguishable responses could be evoked with a 127-bit length m-sequence for three different refresh rates. PCA converts a set of possibly correlated signals into a set of linearly uncorrelated signals called principal components by using orthog-onal transformation [3]. These principal components are aligned as columns of a matrix in such a way that the first principal component has the highest vari-ance, and each succeeding principal component has the next highest variance with a condition of being orthogonal to previous ones. The variance of a prin-ciple component represents the amount of variability in the data explained by that principal component. For each subject, we have constructed a data matrix, Dn×127 by circularly shifting the reference template by a time lag of j bits where
j = 0, 1, 2, ..., 126. By applying PCA to this data matrix, we have obtained the principal components. MATLAB’s pca function was used for this purpose.
3.3
Experimental Results
Table 3.1 gives the ITR values and accuracies for each subject and for each experiment. Average ITR and accuracy values for E1 are 86.17 bits/min and 93%, for E2 are 90.68 bits/min, and 95% and for E3 70.89 bits/min and 81% respectively. 5 out of 6 subjects stated that E3 is more comfortable and only one subject stated that E2 is more comfortable than other experiments. In fact, ITR and accuracy are interrelated since N and T values in equation 2 are the same for different experiments. One-way repeated measures ANOVA test [77], which is an extension of the paired t-test, was conducted for the accuracy rates in Table 3.1. The independent variable was the refresh rate (different experiments) and the dependent variable was accuracy rate. If a significance level of p = 0.05 is assumed then the ANOVA test yields that the accuracy values in different experiments are not statistically different with p = 0.9010 between E1 and E2, p = 0.1528 between E1 and E3, and p=0.0767 between E2 and E3. Still, accuracy value of E3 can
Table 3.1: ITR values and accuracies for each subject and for each experiment. The bottommost row highlighted with green gives the average ITR and accuracy values for each experiment. Recall that E1 is the experiment with 60 Hz monitor refresh rate, E2 is the experiment with 120 Hz monitor refresh rate and E3 is the experiment with 240 Hz refresh rate.
ITR(bits/min) Accuracy Subject No E1 E2 E3 E1 E2 E3 S1 99.1 99.1 80.28 100% 100% 90% S2 88.7 88.7 80.28 95% 95% 90% S3 99.1 99.1 99.1 100% 100% 100% S4 88.7 99.1 35.82 100% 100% 55% S5 55.7 58.97 30.77 80% 75% 50% S6 88.7 99.1 99.1 95% 100% 100% Avg. 86.17 90.68 70.89 93% 95% 81%
The input to the system (127-bit m-sequence) is a wide-band signal and the PSD estimate of this input is flat. PSD estimates of the reference templates on the other hand are not wide-band for all of E1, E2, and E3, as shown in Figure 3.2. It is observed from this figure that the wide-band input signal was transformed into band-limited c-VEP responses, limited to below nearly 30 Hz. Additionally, the spectral densities concentrate within several frequency intervals. Especially for E3, a broad and single peak at 15 Hz appears in the spectrum. This behavior is also consistent with what is observed from Figure 3.3 where the reference templates themselves and the pseudorandom coding sequence are given for S6. It can be seen from both figures (Figure 3.2 and Figure 3.3) that for refresh rate of 240 Hz the reference template approximates a single sinusoidal wave with a certain frequency. Similar observations are also made for all the other subjects.
Figure 3.2: PSD estimates of reference templates of all subjects for E1, E2 and E3 from top to bottom. Results of each subject has its own colour and is given in legend of all graphs. Note that the c-VEP responses are band-limited nearly below 30 Hz. Also for this reason, the spectrums are drawn up to 50 Hz.
Figure 3.3: The pseudorandom coding sequences (red) and reference template of S6 (blue) obtained from E1, E2 and E3 from top to bottom. Left y-axis shows the microvolts values of templates and the right y-axis shows the binary values of the pseudorandom coding sequences. Note that time scales are different due to the difference between the duration of one code sequence at different refresh rates.
Since the target identification depends on the correlation coefficients, we have decided to further investigate the correlation relationship between recorded EEG at test stage for a single symbol and the 36 templates. Figure 3.4 shows for all three experiments, the correlation coefficients between the recorded EEG during test stage when S3 fixated his/her gaze on letter B and the 36 templates. For all refresh rates, the highest correlation coefficient corresponds to the 2nd template
(letter B). It is observed that the variation of the correlation coefficients is periodic with respect to the time lag especially in E3. This is not surprising because the reference template for 240 Hz refresh rate approximates a single sinusoid with a certain frequency, the autocorrelation function of the reference template is also periodic with the same frequency. However, the reference templates for 60 Hz and 120 Hz refresh rates seem to approximate a sum of sinusoids which means the autocorrelation function of these templates are periodic with the greatest common divisor of the frequencies of these sinusoids. Similar behavior for the
correlation coefficients were observed for all subjects and all symbols.
Figure 3.4: Correlation coefficients between the recorded EEG, when S3 fixated his/her gaze on to the letter B on the screen at online experiment (test stage), and 36 templates for E1, E2 and E3 from top to bottom.
There are high peaks at certain time lags as seen in Figure 3.4 due to the fact that the reference template for 240 Hz refresh rate approximates a single sinusoid with a distinct period. These high valued peaks may result in a misclassifica-tion. In fact, we checked the misclassified symbols for E3 and found that they correspond to the symbols that correspond to those peaks. For example, S1 was asked to write “BILKENTBCIEXPERIMENT” onto the screen during test stage of E3 but was able to write “BILKECTBCIEMPERIMENT” which shows that the letters N and X were misclassified. Figure 3.5 shows the correlation coeffi-cients between the recorded EEG during test stage when S1 fixated his/her gaze on to the letter N (above graph) and letter X (below graph) on the screen and 36 templates for E3. It can be observed that the misclassification occurs at the symbols on the peaks where letter C (3rd target) was selected instead of letter
Figure 3.5: Correlation coefficients between the recorded EEG during test stage when S1 fixated his/her gaze on to the letter N and letter X on the screen and 36 templates for E3. Above graph shows the misclassification of letter N (14th target) occurs at one of the peaks of the periodicity which corresponds to letter C (3rd target). Below graph shows the misclassification of letter X (24th target)
occurs at one of the peaks of the periodicity which corresponds to letter M (13th
target). Note that x-axis shows the target indices.
The results of PCA of the 127 templates obtained from the experimental data of S1, are given in Figure 3.6 where percent variances of each principal component are plotted in descending order. For E1, E2, and E3, the number of principal components which constitute 95% of the cumulative variance of the data are 70, 44, and 25 respectively. This means that at monitor refresh rates of 60 Hz, 120 Hz and 240 Hz, only 70, 44, and 25 of the 127 obtained templates are worthy of consideration in explaining the variance of the data, respectively. When all subjects were considered, the average number of principal components which constitute 95% of the cumulative variance of the data were found to be 73, 52, and 26 for E1, E2 and E3 respectively. From another point of view, it may be conjectured that 73, 52, and 26 distinguishable responses can be evoked with a 127-bit m-sequence in E1, E2, and E3 respectively.
Figure 3.6: Detailed view of the percent variances of each principal component to observe how many distinguishable responses could be evoked with a 127-bit length m-sequence for 60 Hz, 120 Hz and 240 Hz refresh rates. Percent variances of each principal component, where the data matrix, Dn×127 was constructed
using the reference template obtained from the experimental data of S1. The graphs belong to E1, E2, and E3 from left to right.
3.4
Discussion on Experimental Results
To our knowledge, this study is the first study which utilizes a monitor with a refresh rate up to 240 Hz to investigate the effects of high stimulus presentation rates in c-VEP based BCIs. Our experimental results indicate that the average ITR values and accuracy rates for 60 Hz and 120 Hz refresh rate are very close to each other while for 240 Hz refresh rate somewhat lower ITR values and the accuracy rates are observed (see Table 3.1). However, increasing refresh rate drastically shortens the time required for training from 3.53 minutes to 53 seconds. Also 5 out of 6 subjects stated that E3 is more comfortable and only one of them stated that E2 is more comfortable in a manner of visual fatigue and practicality.
It is observed from Figure 3.2 that although the input (127-bit m-sequence) is a wide-band signal, the c-VEP responses are band-limited below nearly 30 Hz. We have used a 4-121 Hz band-pass filter but since the c-VEP responses are limited below nearly 30 Hz, a narrower band-pass filter could have been used in pre-processing of EEG data. Moreover, the spectral densities are concentrated
15 Hz. The autocorrelation function of the reference template is also periodic with the same frequency. As a result of this periodicity, the variation of the correlation coefficients becomes periodic (see Figure 3.4) with respect to the time lag. Due to this behavior, there are high peaks at certain time lags which results in misclassification as shown in Figure 3.5.
PCA was applied to observe how many distinguishable responses could be evoked with a 127-bit length m-sequence and with our experimental procedure for three different refresh rates. This analysis yields that on the average, only 73, 52, and 26 well distinguishable responses can be obtained for refresh rates of 60 Hz, 120 Hz and 240 Hz respectively. It can be deduced that it is fairly possible to misclassify some of the symbols using a 127-bit length m-sequence with a 36-target system at 240 Hz refresh rate. Therefore, it can be stated that higher refresh rates may degrade the performance of the BCIs with high number of targets while they can advance the performance of the BCIs with lower number of targets if target codes are chosen correctly.
Considering together the abovementioned results from the analyses, the per-formance of the system, training time, and the subjects’ comfort during the ex-periments, it can be claimed that the 120 Hz refresh rate is the best choice for the BCIs with high number of targets while 240 Hz refresh rate is a suitable choice for the BCIs with low number of targets. Still, for 240 Hz refresh rate, time lag between the consecutive targets should be selected so that the targets are as-signed codes with low correlation coefficients (i.e. codes that have high correlation coefficients due to the periodicity of the templates should be avoided).
Chapter 4
A Model Based Investigation of
the Effects of High Stimulus
Presentation Rate on
Code-Modulated Visual Evoked
Potential Based Brain-Computer
Interfaces
c-VEP responses have never been studied before with a mathematical model of the brain. In an attempt to bring rational explanations for the properties that we have observed in our experiments, we have used Robinson’s corticothalamic model [17], which is a neural mass model consisting of four neuronal populations, to model and simulate the c-VEP experiments. This model is able to reproduce many EEG phenomena [17, 18] and is used for the first time to study c-VEP responses.