Article information:
To cite this document:
Kürsat Aydogan G. Geoffrey Booth, (1996),"Performance Characteristics of Private and State-Owned Banks: The Turkish Case", Managerial Finance, Vol. 22 Iss 10 pp. 18 - 39
Permanent link to this document: http://dx.doi.org/10.1108/eb018584
Downloaded on: 24 June 2016, At: 12:57 (PT)
References: this document contains references to 0 other documents. To copy this document: [email protected]
The fulltext of this document has been downloaded 144 times since 2006*
Access to this document was granted through an Emerald subscription provided by emerald-srm:187202 []
For Authors
If you would like to write for this, or any other Emerald publication, then please use our Emerald for Authors service information about how to choose which publication to write for and submission guidelines are available for all. Please visit www.emeraldinsight.com/authors for more information.
About Emerald www.emeraldinsight.com
Emerald is a global publisher linking research and practice to the benefit of society. The company manages a portfolio of more than 290 journals and over 2,350 books and book series volumes, as well as providing an extensive range of online products and additional customer resources and services. Emerald is both COUNTER 4 and TRANSFER compliant. The organization is a partner of the Committee on Publication Ethics (COPE) and also works with Portico and the LOCKSS initiative for digital archive preservation.
*Related content and download information correct at time of download.
Performance Characteristics of Private and
State-Owned Banks: The Turkish Case
by Kürsat Aydoğan, Associate Professor of Finance, Bilkent University, Faculty of Business Administration; and G. Geoffrey Booth, Professor of Finance and Union National Life Insurance Co., Endowed Professor of Insurance, Louisiana State University, Department of Finance
Abstract
This paper investigates the performance characteristics of Turkish private and state-owned commercial banks for the 1986- 1990 period. The link between interest margins and maturity structures of bank asset and liabilities is specified. Empirical evidence indicates that banks with longer positions experienced lower interest margins, a finding consistent with the presence of a downward sloping yield curve during most of this period. The results document that bank margins suffered after the financial reforms of 1988. Further, compared to private banks, state-owned banks exhibited lower interest margins and longer maturities, which is a direct consequence of portfolio constraints and management style of banks.
1. Introduction
During the last decade, deregulation, accompanied by high interest-rate volatility and increased level of competition, brought the issue of interest-rate risk to the attention of financial institutions and regulators throughout the world. This coupled with their in creased reliance on off-balance sheet activities forced banks to seek effective ways to measure and manage their interest-rate risk. At the same time, regulators attempted to develop effective measures of this risk. The US and European Union came up with proposals of their own [Gualandri, 1991], and academic work evaluating these proposals or laying down new ones predictably followed [eg. Houpt and Embersit, 1991, Dermine, 1991, and Landskroner and Ruthenburg, 1991]. A central concern in developing regula tory schemes is to balance computability and scope. When the proposed measure is larger in scope, its computational requirements increase. Conversely, computational ease means reduced scope.
Turkish banks and regulators were no exception in dealing with interest risk exposure. Moreover, having gone through a series of reforms under an ambitious financial liberali zation program in the 1980's, they had to cope with other risks and regulatory issues as well. Reforms towards financial liberalization, however, did not result in the privatization of state-owned banks, which constitute almost half of the banking industry. Hence, these banks have coexisted with their privately owned counterparts throughout the financial reform process.
The reaction of private and state-owned banks to different aspects of financial liberalization is an important ingredient in addressing the question of whether financial reform can be carried out without privatizing state run institutions. One line of argument claims that government owned institutions can co-exist with private firms in a competitive setting. In this situation, state-owned banks are autonomous, profit maximizers like their private counterparts. The proponents of this argument suggest that it is not the ownership status but levels of competition and managerial accountability that enhance efficiency [eg. Yarrow, 1986]. Privatization, therefore, is not a necessary step in the financial reform process. In contrast, proponents of privatization argue that without this step financial reform is never complete and its desired outcomes will never be achieved [eg. Moore,
1992]. Providing empirical evidence to assist in resolving this controversy is, therefore, important. Among many alternative empirical designs, one approach is to examine the reaction of state-owned and private commercial banks to certain aspects of financial reform. The purpose of this study is to analyze the reaction of state-owned and private banks to the interest-rate risk that resulted from financial reform.
To control their exposure to interest-rate risk, banks need to measure effectively this risk. Similarly, regulators need to assess the vulnerability of financial institutions to unanticipated changes in interest rates. However, even the simpler measures mentioned in the literature have considerable information requirements. For example, the maturity ladder approach advocated by the Bank for International Settlements requires a classifi-cation of assets and liabilities based on time to maturity or repricing. Yet, very few banks in Turkey are readily able to provide this information. Therefore, it is natural to ask if sensible measures of interest-rate risk can be developed from traditional financial state-ments. One way to address this question is to test whether such measures cross- sectionally explain differences in interest margins, the main target for gap management.
The impact of changing interest rates on bank profits has long been an area of interest for scholars as well as bankers. For instance, Flannery (1981, 1984) uses accounting revenues and costs to proxy interest-rate risk and relates these to changes in market interest rates. Hanweck and Kilcollin (1984) investigate the response of bank interest margins to changes in market interest rates. They find small numerical differences in bank profitabil-ity between large and small banks, and they question the usefulness of maturprofitabil-ity compo-sition of assets and liabilities as a predictor of interest rate risk. Their model, however, does not include a measure to account for interest-rate risk. Another line of research examines the changes in bank portfolio behavior as a result of changing interest rates. Mitchell (1989), for example, employs a two-period two-portfolio model to estimate the interest exposure of US banks. The main emphasis of Mitchell (1989) is how banks changed their portfolios in response to changes in interest rates and financial deregulation.' Attempts towards financial liberalization in Turkey brought this issue to the attention of Turkish scholars and practitioners. Akyüz (1987) uses Flannery's (1981) model to test the impact of rising interest rates on the profitability of Turkish banks. He does not find substantial evidence for higher profits in times of rising interest rates, nor does he find evidence of structural changes or consider differences rising from ownership status.
The objective of this paper is to investigate the interest-rate exposure of Turkish banks using measures derived from financial statements and to examine their impact on bank interest margins for private and state-owned banks. To this end, an empirical model of
bank interest margins and interest-rate risk derived from bank financial statements is developed and applied to 1986-90 data. The model is consistent with the inference that the traditional banking practice of borrowing short and lending long is the superior strategy only when banks are faced with an upward sloping yield curve. Otherwise, if the yield curve is downward sloping, a short position leads to higher profitability. This study takes into account cross-sectional differences in maturity structures of bank asset and liabilities and relates them to bank interest margins, taking into account factors such as capital adequacy, market power and ownership status.
The organization of the paper is as follows: Section 2 provides a brief introduction to institutional nature of the Turkish banking system. Section 3 contains the empirical model and the framework for the analysis of interest-rate risk. Empirical findings are presented in Section 4, with the summary and conclusions are stated in Section 5.
2. Turkish Banking System
The Turkish financial system has been dominated by banks. In addition to traditional commercial banking activities, banks can hold equity in non-financial corporations, underwrite securities and engage in secondary market trading of securities.2 The share of
banking system in total financing savings was 67% as of the end of 1990, with the rest accounted for by capital markets [Capital Markets Board, 1990]. The banking system includes the Central Bank, commercial banks, investment and development banks, and special finance houses, with commercial banks being the dominant institution. Investment banks are established with the purpose of underwriting securities. However, they are also engaged in commercial banking, relying on interbank borrowing and equity instead of deposits as a source of funds. Development banks are primarily assigned with the task of extending medium and long term loans to selected industries. They are funded by the Turkish government, international organizations such as the World Bank, or other finan-cial institutions. The total market share of investment and development banks is limited. Special finance houses are banks operating under the principals of Islamic banking.3 They
are engaged primarily in commercial banking and account for only a small share of the market.
As in most other countries, banking is a heavily regulated industry. The government regulates banking through three agencies: the Treasury, the Central Bank and the Capital Markets Board.4 Restrictions on entry and exit, capital adequacy, reserve and liquidity
requirements, asset portfolio restrictions, number of branches, deposit insurance, and interest rates on deposits and loans are the areas that are or have been subject to government regulation. Financial liberalization in the 1980's eased the restrictions in several areas. Most notably, ceilings on interest rates on loans were lifted in 1981, followed by the removal of deposit interest ceilings in 1988. Entry barriers to the industry were partially removed, enabling foreign banks as well as banks owned by Turkish residents to operate side by side. Restrictions on foreign exchange operations were significantly relaxed during the same period.
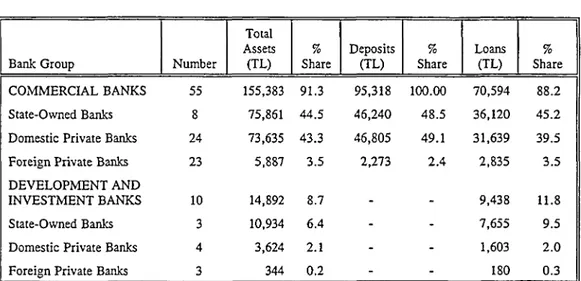
With regard to ownership, banks in Turkey can be grouped as state-owned and private banks. Private banks are those owned by either Turkish residents or foreigners. Through-out the paper the former are referred to as (domestic) private banks and the latter as foreign (private) banks. Table 1 presents the distribution of total assets, deposits and loans among banks owned by the State, Turkish residents and foreigners as of December 31,1990. The figures indicate that the role of the State is not limited to its regulatory authority. As of the end of 1990, the State was the owner-manager of 11 of a total of 66 banks in the country. Of these 11 banks, eight are engaged in commercial banking, whereas the other three are development banks. In terms of size, state-owned banks control 44.5% of the banking system's total assets. Through bank ownership, the government can loan funds to selected firms and industries at less than competitive rates, and it can influence the level of interest rates both in deposit and loan markets.
There are 25 private domestic banks that account for 43.3% of total assets and 49.1% of deposits. With respect to size and other attributes such as profitability, capital adequacy and basic business strategy, Turkish private banks are quite heterogeneous. The largest ranks second among all banks with a large branch network and commands 10% of total assets in the system. However, nine of the private domestic banks have less than 10 branches each. Similar to some state-owned banks, several large domestic private banks have significant equity shares in non-financial companies. Such investment is usually the result of government policy aimed at promoting investment in a particular industry; however, some banks acquired interest in non-financial corporations in exchange for their non-performing loans.
Foreign banks are either banks established in Turkey by non-residents or branches of banks headquartered abroad. With one exception, these banks have less than five branches each. Their total share in consolidated assets is a mere 3.5%, despite their numbers. Foreign banks are quite similar to small domestic private banks in terms of management philosophy, target market and financing methods. They prefer to do business with blue chip firms, rather than dealing with small firms in local markets. These small banks rely relatively less on deposits for funding their assets and instead borrow in the interbank money market and and eurocurrency market and issue bonds. Fee income is an important source of revenues for both small foreign and domestic private banks.
3. The Empirical Model
Models of interest margins usually regard banks as dealers of funds that accept deposits and extend loans [eg. Ho and Saunders, 1981, McShane and Sharpe, 1985, Zarruck, 1989, Zarruck and Madura, 1992]. Some sort of uncertainty in transactions or interest rates is assumed, together with risk aversion. The determination of bank spreads are analyzed in the context of an expected utility maximization problem with some regulatory and balance sheet constraints. The results point out variables like market power, average transactions size [Ho and Saunders, 1981, McShane and Sharpe, 1985], equity capital [Zarruck, 1989, Zarruck and Madura, 1992], uncertainty [Ho and Saunders, 1981, McShane and Sharpe,
1985, Zarruck, 1989] determine bank interest margins.
By their nature, none of the models mentioned above include interest-rate risk as an explanatory variable. To show the impact of interest-rate risk on interest margins, a simple framework is adopted below. In this framework, net interest margin is defined as the difference between interest income from bank assets and expenses associated with liabilities. Two maturity classes of assets and liabilities are assumed to exist: short-term and long-term. Mathematically, interest margins, M, can be expressed as:
M = rLXL + rsXs-kLYL-ksYs, (1)
where
rL (rs) : interest rate for long- (short-) term assets
KL (hs) : interest rate for long- (short-) term liabilities
XL (Xs) : book values of long- (short-) term assets
YL (Ys) : book values of long- (short-) term liabilities
The effect of a change in the general level of interest rates on bank margins comes from a mismatched maturity position (XL ≠ YL and Xs ≠ Ys) and is known as income risk.5
Income risk, however, is more complex than the above statement suggests. For example, one complicating factor is that interest rates on long and short term assets and liabilities may not change by the same amount, ie. the term structure of interest rates is altered. In this case, a reversal of the shape of the yield curve may strengthen or reduce the overall effect. Furthermore, even when the shift in the yield curve is parallel, ie. both long and short rates change by the same amount, there exists other mechanisms to neutralize or strengthen the interest effect. This occurs if the adjustment of interest rates on bank assets differ from rates on bank liabilities. For Turkish banks with large branch networks, Aydoğan (1990a) empirically demonstrates that banks, having market power in deposit markets, can control deposit interest rates, whereas they face a higher level of competition in loan markets. The asymmetry of competition in loan and deposit markets influences the magnitude of interest-rate risk. This competitive structure effect is stronger during times of rising interest rates, since market power enables banks to hold back deposit rates. It is possible to see the effects of changing interest rates on bank margins by taking partial derivative of equation (1) with respect to the general level of interest rates, p:
(2)
Since book value of assets and liabilities are not affected by interest rate changes, δXL/δp = δXs/δp = δYL/δp = δYs/δp = 0.6 As a result equation (2) becomes:
(3)
If there is a parallel shift in the term structure, ie. δr/δp = δrL/δp = δr/δp and
δk/δp = δkL/δp = δk/δp, the interest margin is not affected as long as there is no
difference between the adjustment speeds of asset and liability rates. However, as mentioned above, banks with large branch networks may hold back deposit interest rates when there is an upward movement in market rates. In that case, since 8r/8p > 8k/8p, the
interest margin will increase, regardless of maturity structure:
(4)
When the shift in the yield curve is not parallel, ie. δrs /δp ≠ δrL/δp and
δks/δp ≠ δkL/δp, interest rate changes impact interest margins. For simplicity, assume that
δr/δp = δk/δp, in other words; both asset and liability rates adjust with the same speed. Thus δrs/δp = δks/δp = δis/δp and δkL/δp = δrL/δp = δiL/δp, which results in:
(5)
An increase in the slope of the yield curve causes an increase (decrease) in interest margin if the bank has a net long (short) position. The opposite occurs if there is a decline in the slope of the yield curve.
As is seen from equations (l)-(5), in the presence of an upward sloping yield curve, the traditional banking practice of borrowing short and lending long causes banks to increase margins. Thus, banks with longer position are expected to command higher interest margins. Market power in deposit collection improves margins whenever interest rates go up in general, which mitigates the unfavorable impact of a declining yield curve.
In the empirical model, in addition to the maturity structure variable, a set of control variables mentioned in the literature, and two sets of intercept dummy variables are included. Control variables are market power, capital adequacy and loan quality.8 The first
dummy set is used to represent the type of bank ownership. It is expected to capture the impact of differences in management style and other factors such as limitations in asset portfolio decisions and number of branches inherent in ownership structure. The second set of dummy variables denotes years and its presence accounts for the significant structural and regulatory changes during the period under examination.
The empirical model is specified as follows:
MARit = β0 + βi,MATit + β2C/TAit + β3EP/TAit + β4DEPit
+ β5DSBi + β6DPTB, + β7D86t + β8D87,
+ β9D88t + β10D89t + εit, (6)
where
MAR: interest margin MAT: maturity structure C/TA: total equity to total assets
EP/TA: equity participation to total assets
DEP: total deposits to banking system total deposits DSB: 1 if bank is a state-owned bank, 0 otherwise DPTB: 1 if bank is a domestic private bank, 0 otherwise D86: 1 if year = 1986, 0 otherwise
D87: 1 if year = 1987, 0 otherwise D88: 1 if year = 1988, 0 otherwise D89: 1 if year = 1989, 0 otherwise
βo,...,β10 are parameters and εi is the error term. The impacts of foreign ownership and
1990 are captured in the model's constant term.
Two alternative definitions of interest margin (MAR) are provided. The first defini tion, MAR1, includes interest on items that are interest sensitive. MAR2, the second definition, contains fees and commissions on loans, as well as gains and losses from foreign exchange assets and liabilities, in addition to MAR1. Foreign exchange gains and losses include interest margin from these sources as well as capital gains and losses.
In accordance with equations (4) and (5), maturity structures of banks are computed from the balance sheet values of long-term and short-term assets and liabilities. Two sets of ratios are calculated to proxy maturity structures, MAT. These are (i) the ratio of short-term assets (SA) to short-term liabilities (SL) and (ii) the ratio of long-term assets (LA) to short-term assets (SA).9 Two alternative definitions are given for SA. The first
definition includes all items classified as short-term assets. The second includes only the interest sensitive items and this SA is denoted by an asterisk. Detailed computations for these variables as well as for C/TA, EP/TA and DEP are given in Table 2.
The coefficient for LA/SA (LA/SA*) should be negative because of the presence of a flat term structure for most of the period and is a direct consequence of equation (5). Similarly, equation (5) implies positive coefficient for SA/SL (SA*/SL). Because the hypothesized coefficient signs are influenced by the term structure, it is worthwhile to
describe the behavior of interest rates during the sample period. Interest rates declined from an average of 55% to mid 40%'s by the end of the second quarter of 1987. They started to climb in the second half of 1987, reaching their peak levels during the fourth quarter of 1988. Interest rates on 1-year time deposits were at their all- time high level of 85% in October of the same year as a result of government measures to combat speculative movements in the foreign exchange markets. However, deposit rates did not stay at those levels for long. Starting with the first quarter of 1989, they steadily declined throughout 1989 and most of 1990. An upward reversal in trend became evident during late 1990, when both deposit and government bond rates picked up. In the short- term, money market rates were highly volatile. Monthly averages of interbank rates for overnight deposits usually fluctuated around deposit and government bond rates, with large swings from month to month.10
Although interest rates oscillated during 1986-1990 period with occasional sharp movements, the term structure moved in one direction, as the slope yield curve declined after 1987. After a brief increase in the slope of the yield curve in 1987, the economy experienced an almost flat curve for the rest of the period. Instruments with maturities longer than a year were almost non-existent, despite the efforts by the Treasury to issue government bonds with longer maturities. Because of the uncertain economic environ-ment that was eminent after early 1989, maturities of all financial instruenviron-ments progres-sively became shorter.
The ratio of equity capital to total assets, C/TA, is an indicator of capital adequacy. Use of equity as a source for bank earning assets generally reduces economic profits of a bank, since cost of equity is higher than cost of alternative funding sources like deposits and borrowed funds. However, cost of equity is an opportunity cost, and therefore is not accompanied by an explicit payment. In addition to this accounting based reasoning, presence of risk-based capital requirements may induce some banks to increase the risk profile of their asset portfolios. Hence, banks with high equity positions report higher margins both as a result of non-existence of explicit interest payments on equity and of having a high-risk/high-return loan portfolio.
EP/TA, on the other hand, is a proxy for asset quality. Some commercial banks have accumulated significant equity interest in non-financial corporations, either deliberately as a result of corporate strategy or in exchange for non-performing loans in their asset portfolio. No matter how equity participations are acquired, income from them - either dividend income or capital gains - is not reflected in interest margins. However, presence of equity participation may indicate loans with preferential terms to these corporations, and these terms lead to lower interest margins, thus a negative sign is expected for the coefficient of this variable.
DEP is a proxy for market power, therefore it should be positively related with the net interest margin. This expectation follows directly from Aydogan (1990a).
4. Data and Findings
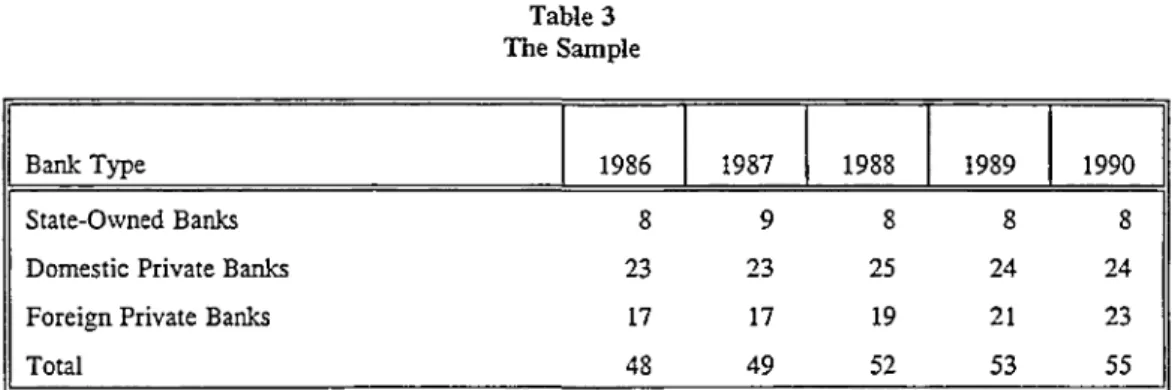
The data used in this study cover the five year period beginning with 1986. Data on bank financial variables are obtained from the publications of the Banking Association of Turkey; other figures are drawn from Central Bank annual and quarterly reports as well as Monthly Reports of the Undersecretariat of Treasury and Foreign Affairs. The compo-sition of data is given in Table 3. There are 257 pooled observations, which include state owned banks, private Turkish banks and foreign banks engaged primarily in commercial banking. Investment and development banks are deliberately excluded from the study.
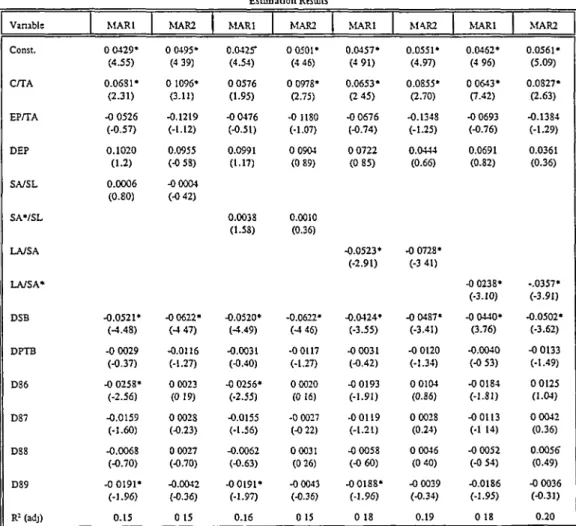
The empirical model in equation (6) is estimated several times, using alternative definitions of interest rate margins and maturity structure. The results are summarized in Table 4. The explanatory power of the model is low as indicated by low adjusted R2 values,
which range from 0.15 to 0.20. All explanatory variables carry expected signs most of the time. However, only two variables, C/TA and LA/SA (LA/SA*), are statistically signifi-cant in all the models. Models with LA/SA (LA/SA*) as the maturity structure variable are better in terms of adjusted R2 values. SA/SL (SA*/SL), on the other hand, are never
significant although they carry the correct sign in three of the four models estimated. Among the control variables, EP/TA has negative coefficient in all eight models, whereas DEP has the correct sign in six of them. None of these coefficients, however, are statistically different from zero.
Among the coefficients for the dummies for bank groups, DSB, which takes a value of one for state-owned banks, has a negative sign, indicating that they have lower interest margins. Both maturity structures and interest margins exhibit differences among bank groups. State-owned banks, which are larger on the average, depend on deposit funding, and they have been traditionally assigned particular roles in economic development, despite a move out of their traditional roles in 1990. According to Table 5, they have longer positions compared to other banks, as evidenced by a higher average LA/SA (LA/SA*) and lower SA/SL (SA*/SL). State-owned banks command the lowest margins among the three groups. In fact, MAR1 has been negative throughout the period being examined. The second group consists of domestic private banks. Foreign banks constitute the third group. On the average, private banks carry a shorter position than foreign banks: LA/SA for the latter is higher. However, due to lower liabilities, foreign banks have higher SA/SL than private banks. Interest margins, measured by both MAR1 and MAR2, show that foreign banks are ahead by 1% to 2%.
The difference in interest margins and maturity structures between state-owned and private banks are further depicted in Figures 1 and 2. In Figure 1, interest margin, as measured by MAR1, for the two groups are presented. The margin for state-owned banks is consistently below that of private banks. Maturity structures, proxied by the ratio of long term assets to short term assets (LA/SA), are shown in Figure 2. They suggest significant differences between the two bank groups. Although maturities are becoming shorter as a response to the changing economic environment for all banks, state-owned banks are slower to adjust. This is one reason why their margins are lower.
Among the annual dummy variables, D86 and D89 are significant, with t-values around 2.0. To understand the coefficient estimates for the dummies, a closer look at the behavior of bank maturity structures and interest margins during the 1986-90 period is necessary. Table 5 examines the behavior of maturity structures and interest margins during that period. The ratios pertaining to the maturity structure point out that maturities of assets progressively became shorter, especially after 1988. Both LA/SA and LA/SA* decline significantly over this period. As of the end of 1990, interest sensitive long term assets are only 7% of interest sensitive short-term assets and 4% of total short term assets, on average. The increase of short- term assets to short-term liabilities, SA/SL, confirms this portfolio adjustment. The change in maturity structure is evident especially after 1988. Paired t-tests show that values for SA/SL*, LA/SA, and LA/SA* are significantly different in 1989, compared to the year before. As mentioned above, 1988 was marked by important shocks to financial markets, the results of which were interest rates reaching their peak levels by the last quarter of that year. Banks responded to interest rate changes by adjusting their portfolios. As portfolio adjustments could not be made instantaneously, their interest margins declined considerably in 1989. Additional paired t-tests reveal significant differ-ence in MAR1, but the decline in MAR2 is not statistically significant. Banks recovered their margins in 1990. Both MAR1 and MAR2 display an increase above previous year, with the exception of foreign banks that experienced lower MAR2. The difference between MAR1 and MAR2 is smaller in that year. This is a result of the change in the behavior of foreign exchange rates and bank portfolio adjustments discussed above.
A closer look at MAR1 and MAR2 shows that MAR2 is always greater than MAR1 for all years and for all banks, and the difference is in the neighborhood of 1.5 to 2.0%. This is too large to be explained by commissions and fees alone. The inclusion of foreign exchange gains and losses in the definition of MAR2 may possibly explain the difference. Hence, it can be inferred that banks were able to profit from their foreign exchange positions during the five-year period."
It is clear that the extent of equity funding and maturity structure of assets have explanatory power for variation in bank interest margins. When values of C/TA for individual banks are analyzed, it is seen that equity funding is an important source of funds for smaller and foreign banks. For example, the highest figure for C/TA is 0.73, followed by 0.45 and 0.44. The 75th percentile is around 0.20. These figures are far in excess of capital adequacy requirements. They show that those banks do not depend on the traditional source, ie. deposits, for funding their assets. As equity does not require explicit interest payments, margins turn out to be higher. There is no evidence that banks with higher equity positions have riskier loan portfolios. Hence, it is plausible that the sign of C/TA is more because of the accounting explanation than the explanation of high-risk/high-retum asset portfolio being financed by equity. Presence of medium- and long-term loans seem to reduce margins as well. In a time when interest rates fluctuated a great deal, unstable economic conditions imposed on banks the necessity to be more flexible in allocating their funds; but long-term loans did not provide that flexibility. Banks found this out by experiencing lower margins and adjusting their portfolios accordingly. Even state-owned banks, which were traditionally assigned with the task of extending long term credit to selected industries, started to shy away from long-term commitment
of funds. Hence, lowering of average maturities of financial instruments became an economy-wide phenomenon.
5. Conclusions
This paper investigates the interest-rate risk exposure of Turkish commercial banks during 1986-1990, paying special attention to the difference between state-owned and private banks. The link between interest margins and maturity structures of bank asset and liabilities is specified. It is hypothesized that during the period under investigation, banks with net long positions should experience lower margins. To test this hypothesis empiri-cally, alternative measures for asset-liability maturity structures are constructed and used along with other control variables to explain short sectional variation in net interest margins. The ratio of long-term assets to short-term assets is found to be significantly and negatively related with interest margins. One control variable, equity to total assets, is also significant with a positive sign. This is possibly due to reliance on equity as a source of funds by some banks.
Significant differences in interest margins between state-owned and private banks are disclosed. State-owned banks with their longer positions have much smaller interest margins than private banks. This suggests that they cannot compete as autonomous firms with other banks. It is quite possible that their autonomy is impaired by the government preventing them to take necessary but potentially unpopular measures to adjust their portfolios.
The period covered in this study is not long enough for market interest rates to reveal their long term movement. As mentioned in the previous section, interest rates fluctuated during the five-year period with occasional jumps. This uncertain environment caused the banks to reduce the maturity structure of their assets. This change is observed across all groups of banks. Years during which interest rates increased, ie. 1988, did not result in higher margins. On the contrary, higher cost of funds, together with the impact of deregulation, caused profits to decline.
The implications for the measurement of interest-rate risk are interesting to note. To a certain extent, bank financial statements can be useful in developing simpler measures to evaluate the overall interest-rate risk. Minimal data requirements of these measures make them easily computable, and despite their limited scope, they may provide valuable information especially for third parties who have access to only publicly available data. Regulators can also make use of financial statement based measures until they develop measures with a wider scope, the informational requirements of which are able to be met by financial institutions.
Endnotes
1. Interest-rate risk is also examined within the framework of normative models. The objective in these models is to find out what the bank should do in order to control interest-rate risk by manipulating both on- and off-balance sheet items. In duration- gap models, management of interest-rate risk is achieved through the control of the difference between durations of assets and liabilities, ie. the gap, [eg. Kaufman (1984)]. Mathemati-cal programming models, on the other hand, require the specification of some objective(s) for the bank, and search for the optimum values of some decision variables, usually on-and off-balance sheet items, under some regulatory on-and managerial constraints. Examples of such normative models include Booth et al. (1989), Brodt (1988) and Meyer zu Selhausen(1987).
2. A comprehensive discussion of Turkish Banking system and its evolution during the last decade can be found in Akkurt et al. (1992).
3. Islamic banking refers to the practice of denying explicit interest payments on funds, based on the prohibition of interest in Islam. Financial institutions operating under the principals of Islamic banking have developed schemes by which they borrow and lend money without explicit payments of interest. For example, short term financing of a trade company could take the form of the bank's purchasing the inventory and reselling it to the trader with a markup to be paid later. The markup, however, depends on factors like the maturity of the payment and credit risk of the trade company.
4. The Treasury is responsible for controlling entry and exit to the banking industry. The Central Bank is the supervisory authority. Foreign exchange and interbank money markets are operated under the supervision of the Central Bank, which may intervene to stabilize exchange rates and interest rates. Because of their activities in primary and secondary markets for securities, banks are also subject to capital market regulation, which is administered by the Capital Markets Board.
5. Another important source of the interest rate effect on bank profits, ie. interest margins plus capital gains, is the change in the market value of asset and liabilities resulting from interest rate changes. This type of uncertainty is known as the investment risk. In general, market values of financial assets vary inversely with market interest rates. However, interest rate sensitivity of those assets depends on the maturity, or duration to be precise, of the assets. The longer the duration the higher the interest sensitivity of the financial asset. Investment risk works in the opposite direction of income risk. For example, during times of rising interest rates, banks with net long position generally enjoy higher interest margins but suffer from declining net worth. The investment risk effect is not tested in this model for two reasons. First, as it is discussed elsewhere, asset and liability maturities in Turkey are rather short. This reduces the price response of financial assets to interest rate changes. Second, capital gains and losses are not recorded until realized, so that reported income or loss for the period is not the same as actual. The standard income statement does not report capital gains and losses separately. Instead, they are contained in the extraordinary gains and losses item on the income statement.
6. Loan quality is used as an explanatory variable for the pure spread due to transactions uncertainty by Ho and Saunders (1981). The other variable in the literature, namely interest-rate risk, is left out since it is the same for all the banks in a given year. Its impact across time is seen in the year dummy.
7. Banks may respond to interest rate changes over time by adjusting the composition of their portfolios of assets and liabilities. The assumption may hold in the short run when banks do not have the flexibility to make portfolio adjustments instantaneously. Unlike Mitchell (1989), whose main concern is the reaction of banks to interest rate changes over time, the focus of this study is the cross-sectional variation in maturity structures of bank asset and liabilities and their impact on interest margins. Time dimension is included in the empirical model with the purpose of testing the impact of changing regulation on margins.
8. It is assumed that XL + Xs ≥ YL + Ys. This assumption is justified for the traditional
commercial bank that is subject to some minimum capital requirement and, therefore, finances some of its earning assets with equity.
9. LA contains medium- and long-term loans and non-performing loans. Long-term assets like fixed assets and equity participation are not included, since they do not constitute the asset portfolio decision of a commercial bank. No maturity breakdown is available for assets like marketable securities; however, most are short-term government securities, which are classified as short-term assets.
10. The movements in bank lending rates are not explicitly considered here, since banks do not quote publicly their lending rates that would serve like the prime rate. However, it is very likely that lending rates followed the trend in deposit and treasury bill during this period. For some details in computing bank lending rates, see Aydoğan (1990a).
11. The sample period can be divided into two sub-periods with respect to the movement of the exchange rates between the Turkish lira and major currencies. During the first sub-period that lasted until the end of 1988, Turkish lira depreciated against foreign currencies in real terms. Hence, banks held foreign exchange in excess of their need to finance foreign trade. They simply regarded foreign exchange as a profitable portfolio investment. The real depreciation of the Turkish lira during that period made this investment more attractive than lending, which, of course, carries default risk. The measures taken in 1988 aimed at reversing this currency substitution by commercial banks. The following sub-period witnessed a reversal of the behavior of foreign exchange rates. The Turkish lira appreciated against foreign currencies in real terms. Banks adopted their portfolio behavior to the new situation. They preferred to issue foreign exchange liabilities to finance loans denominated in Turkish liras.
References
Akkurt, A., D. Hakioğlu, A. Karayalcn, N. K09, C. Özcet, A. Serel, N. Usta, and Ö. Varol (1991), "Developments in the Banking Sector," CBRT Banking Supervision Department, Discussion Paper.
Akyüz, A. (1987), "The Impact of Rising Interest Rates on Bank Profits: A Study on the Turkish Banking System," Yapi Kredi Economic Review, October, 37-51.
Aydoğan, K. (1990a), "The Competitive Structure of Turkish Banking Industry," CBRT Research Department, Discussion Paper.
Aydoğan, K. (1990b), "Operational Efficiency of the Turkish Banking System," CBRT Research Department, Discussion Paper.
Banking Association of Turkey (1990), Banks of Turkey, Ankara.
Booth, G.G., W. Bessler, and W. Foote (1989), "Managing Interest Rate Risk in Banking Institutions," European Journal of Operational Research, 41,302-313.
Brodt, A.J. (1988), "Optimal Bank Asset and Liability Management with Financial Futures," Journal of Futures Markets, 8,454-482.
Capital Markets Board (1990), Annual Report.
Central Bank of Republic of Turkey (1990), Annual Report. Central Bank of Republic of Turkey (1990), Quarterly Report III.
Dermine, J. (1991), "The BIS Proposal for the Measurement of Interest Rate Risk: Some Pitfalls," INSEAD, Working Paper.
Flannery, M. (1981), "Market Interest Rates and Commercial Bank Profitability: An Empirical Investigation," Journal of Finance, 36,1085-1101.
Flannery, M. (1983), "Interest Rates and Bank Profitability: Additional Evidence," Journal of Money Credit and Banking, 15,335-362.
Gualandri, E. (1991), "The approaches to Interest Rate Risk of Supervisory Authorities and Financial Institutions," Bank- Archiv, 39,182-196.
Hanweck, G.A., and T. Kilcollin (1984), "Bank Profitability and Interest Rate Risk," Journal of Economics and Business, 36, 77-84.
Ho,T.S.Y., and A. Saunders (1981), "The Determinants of Bank Interest Margins: Theory and Empirical Evidence," Journal of Financial and Quantitative Analysis, 16, 581-600. Houpt, J.V., and J.A. Embersit (1991), "A Method for Evaluating Interest Rate Risk in US Commercial Banks," Federal Reserve Bulletin, August, 625-637.
Kaufman, G.G. (1984), "Measuring and Managing Interest Rate Risk: A Primer," Eco-nomic Perspectives, Federal Reserve Bank of Chicago, Jan-Feb, 16-28.
Landskroner, Y., and D. Ruthenberg (1991), "Incorporating Foreign Exchange and Interest Rate Risks in Capital Adequacy Requirements," Bank of Israel, Banking Super-vision Department, Research Unit, Discussion Paper.
McShane, R.W., and I.G. Sharpe (1985), "A Time Series/Cross Section Analysis of the Determinants of Australian Trading Bank Loan/Deposit Interest Margins: 1962-1981," Journal of Banking and Finance, 9,115-136.
Mitchell, K. (1989), "Interest Rate Risk at Commercial Banks: An Empirical Investiga-tion," Financial Review, 18,3,431-456.
Meyer zu Selhausen, H. (1987), "Exploring and Controlling a Bank's Interest Risk: Sensitivity Analysis of an Asset and Liability Co-ordination Model," European Journal of Operational Research, 28,261-278.
Moore, J. (1992), "British Privatization - Taking Capitalism to the People," Harvard Business Review, (January/February), 115-124.
Samuelson, P.A. (1945), "The Effects of Interest Rate Increases on the Banking System," American Economic Review, 35,16- 27.
Undersecretariat of Treasury and Foreign Trade (1991), Treasury Monthly Indicators, August.
Yarrow, G. (1986), "Privatization in Theory and Practice," Economic Policy, 2,324-364. Zarruck, E.R. (1989), "Bank Spread with Uncertain Deposit Level and Risk Aversion," Journal of Banking and Finance, 13, 797-810.
Zarruck, E.R., and J. Madura (1992), "Optimal Bank Interest Margin under Capital Regulation and Deposit Insurance," Journal of Financial and Quantitative Analysis, 27,
143- 149.
Table 1 Turkish Banking System
Bank Group
COMMERCIAL BANKS State-Owned Banks Domestic Private Banks Foreign Private Banks DEVELOPMENT AND INVESTMENT BANKS State-Owned Banks Domestic Private Banks Foreign Private Banks
Number 55 8 24 23 10 3 4 3 Total Assets (TL) 155,383 75,861 73,635 5,887 14,892 10,934 3,624 344 % Share 91.3 44.5 43.3 3.5 8.7 6.4 2.1 0.2 Deposits (TL) 95,318 46,240 46,805 2,273 -% Share 100.00 48.5 49.1 2.4 -Loans (TL) 70,594 36,120 31,639 2,835 9,438 7,655 1,603 180 % Share 88.2 45.2 39.5 3.5 11.8 9.5 2.0 0.3
Note: Turkish lira (TL) figures are in billions. Source: Banking Association of Turkey (1990).
Table 2
Definitions of the Variables
Variable MAR1 MAR2 SA/SL SA*/SL LA/SA LA/SA* C/TA EP/TA DEP Numerator
Interest From Loans + Interest From Securities + Interest From Interbank Funds
- Interest Paid to Deposits - Interest Paid to Loans - Interest Paid to Interbank Funds
MAR1
+ Fees and Commissions on Loans + FX Gains - FX Losses Cash + Banks + Interbank + Securities
+ Reserves + Short-Term Loans
Interbank + Securities + Short-Term Loans
Medium and Long-Term Loans + Nonperforming Loans
Medium and Long-Term Loans + Nonperforming Loans Paid Capital - Losses + Profits + Retained Earnings + Revaluation Fund
Equity Participations Total Deposits
Denominator Total Assets
Total Assets
Total Loans Received + Deposits + Interbank
+ Other Liabilities Total Loans Received + Deposits + Interbank + Other Liabilities Cash + Banks + Interbank + Securities + Reserves + Short-Term Loans Interbank + Securities + Short-Term Loans Total Assets Total Assets Total Deposits in the
Banking System
Table 3 The Sample
Bank Type State-Owned Banks Domestic Private Banks Foreign Private Banks Total 1986 8 23 17 48 1987 9 23 17 49 1988 8 25 19 52 1989 8 24 21 53 1990 8 24 23 55
Table 4 Estimation Results Variable Const. C/TA EP/TA DEP SA/SL SA*/SL LA/SA LA/SA* DSB DPTB D86 D87 DS8 D89 R2 (adj) MAR1 0 0429* (4.55) 0.0681* (2.31) -0 0526 (-0.57) 0.1020 (1.2) 0.0006 (0.80) -0.0521* (-4.48) -0 0029 (-0.37) -0 0258* (-2.56) -0.0159 (-1.60) -0.0068 (-0.70) -0 0191* (-1.96) 0.15 MAR2 0 0495* (4 39) 0 1096* (3.11) -0.1219 (-1.12) 0.0955 (-0 58) -0 0004 (-0 42) -0 0622* (-4.47) -0.0116 (-1.27) 0 0023 (0 19) 0 0028 (-0.23) 0 0027 (-0.70) -0.0042 (-0.36) 0 15 MAR1 0.0425* (4.54) 0 0576 (1.95) -0 0476 (-0.51) 0.0991 (1.17) 0.0038 (1-58) -0.0520* (-4.49) -0.0031 (-0.40) -0 0256* (-2.55) -0.0155 (-1.56) -0.0062 (-0.63) -0 0191* (-1.97) 0.16 MAR2 0 0501* (4.46) 0 0978* (2.75) -0 1180 (-1.07) 0 0904 (0 89) 0.0010 (0.36) -0.0622* (-4.46) -0 0117 (-1.27) 0 0020 (0 16) -0 0027 (-0 22) 0 0031 (0 26) -0 0043 (-0.36) 0 15 MAR1 0.0457* (4 91) 0.0653* (2 45) -0 0676 (-0.74) 0 0722 (0 85) -0.0523* (-2.91) -0.0424* (-3.55) -0 0031 (-0.42) -0 0193 (-1.91) -0 0119 (-1.21) -0 0058 (-0 60) -0 0188* (-1.96) 0 18 MAR2 0.0551* (4.97) 0.0855* (2.70) -0.1348 (-1.25) 0.0444 (0.66) -0 0728* (-3 41) -0 0487* (-3.41) -0 0120 (-1.34) 0 0104 (0.86) 0 0028 (0.24) 0 0046 (0 40) -0 0039 (-0.34) 0.19 MAR1 0.0462* (4 96) 0 0643* (7.42) -0 0693 (-0.76) 0.0691 (0.82) -0 0238* (-3.10) -0 0440* (3.76) -0.0040 (-0.53) -0 0184 (-1.81) -00113 (-1 14) -0 0052 (-0.54) -0.0186 (-1.95) 0 18 MAR2 0.0561* (5.09) 0.0827* (2.63) -0.1384 (-1.29) 0.0361 (0.36) -.0357* (-3.91) -0.0502* (-3.62) -0 0133 (-1.49) 0 0125 (1.04) 0 0042 (0.36) 0.0056 (0.49) -0 0036 (-0.31) 0.20 Note The empirical model is estimated 8 times, using alternative detinitions of the interest margin and maturity structure. Each column represents a model. The first column contains the explanatory variables. The variable on the first row is the dependent variable of the model. The numbers in paranthesis are the t statistics. An asterisk indicates significance at a = 0.05. The variables are defined below:
MAR1 and MAR2: measures of interest margin.
LA/SA, LA/SA*. SA/SL, SA*/SL: proxies for maturity structure where LA stands for long term assets, SA for short term assets, SL short term liabilities and SA* indicates interest sensitive short term assets.
C/TA: Total equity to total assets. EP/TA- Equity participations to total assets DEP: Total deposits to total banking system deposits. DSB. 1 if bank is a state-owned bank, 0 otherwise. DPTB: 1 if bank is a domestic private bank, 0 otherwise. D86...D89. 1 if year= 1986 ..89,0 otherwise.
Table 5
Interest Margins and Maturity Structures
1986 1987 1988 1989 1990 A S T F A S T F A S T F A S T F A S T F MAR1 2.28% -0.97% 2.24% 3.85% 2.81% -0.45% 3.13% 4.11% 3.97% -0.65% 4.41% 5.35% 2.62% -2.36% 2.37% 4.79% 4.58% -1.60% 6.61% 4.62% MAR2 5.04% 0.91% 5.34% 7.97% 4.57% 0.14% 4.25% 7.36% 5.45% 0.10% 5.42% 7.75% 4.55% -1.46% 4.05% 7.42% 5.07% -0.83% 6.66% 5.46% SA/SL 2.59 0.61 1.02 5.64 1.09 0.62 1.06 1.36 1.12 0.69 1.08 1.36 1.13 0.77 1.03 1.39 1.15 0.69 1.01 1.46 SA*/SL 1.00 0.33 0.52 1.97 0.59 0.37 0.61 0.68 0.58 0.38 0.58 0.66 0.70 0.48 0.67 0.82 0.71 0.45 0.71 0.80 LA/SA 0.15 0.42 0.10 0.09 0.12 0.41 0.06 0.07 0.06 0.12 0.05 0.05 0.05 0.08 0.03 0.05 0.04 0.09 0.03 0.04 LA/SA* 0.34 0.88 0.24 0.23 0.28 0.81 0.11 0.22 0.14 0.25 0.12 0.13 0.09 0.14 0.05 0.13 0.07 0.14 0.04 0.08
A: All Banks T: Domestic Private Banks S: State-Owned Banks F: Foreign Private Banks
Note: The average values are simple, unweighted arithmetic averages-. The reason for giving equal weight to banks of substantially different sizes is that the focus of this study is individual bank behavior, rather than aggregate behavior of the banking system.
MAR1 and MAR2: measures of interest margin.
LA/SA, LA/SA*, SA/SL, SA*/SL: proxies for maturity structure where LA stands for long term assets, SA for short term assets, SL short term liabilities and SA* indicates interest sensitive short term assets.
and mode of ownership on the financial performance of the Turkish banking sector: results of a DEA-based analysis. Socio-Economic Planning Sciences 37:3, 185-202. [CrossRef]