CLINICAL STUDY
Could hematologic parameters be useful biomarkers for the
diagnosis of endometriosis?
Turgut A
1,2, Hocaoglu M
2, Ozdamar O
1,2, Usta A
3, Gunay T
2, Akdeniz E
4Department of Obstetrics and Gynecology, Faculty of Medicine, Istanbul Medeniyet University, Istanbul, Turkey.
ABSTRACT
OBJECTIVES: The objective of this study was to evaluate the diagnostic value of the neutrophil-to-lymphocyte ratio (NLR), neutrophil-to-lymphocyte-to-monocyte ratio (LMR), and mean platelet volume (MPV) in patients with endometriosis as compared with healthy controls.
BACKGROUND: Currently, no non-invasive diagnostic test of endometriosis has been implemented in clinical practice.
METHODS: A total of 121 women with endometriosis and 136 controls participated in this retrospective study. The extent of the disease in the patients with endometriosis was determined using the American Society of Reproductive Medicine revised classifi cation. Sensitivities and specifi cities of NLR, LMR and MPV were evaluated by receiver-operating characteristic (ROC) analysis.
RESULTS: Patients with endometriosis had higher neutrophil counts, white blood cell (WBC) levels, NLR, MPV, and lower lymphocyte count and LMR than the control group. The cut-off values were found to be 1.6 for NLR at 87.6 % sensitivity and 44.8 % specifi city and 8 for MPV at 75.2 % sensitivity and 68.4 % specfi city. For LMR, the cut-off value was 5.6 with 66.1 % sensitivity, 50 % specifi city. Patients with stages III or IV had signifi cantly lower MPV (p = 0.039) and LMR levels (p = 0.016) than patients with stages I or II. CONCLUSION: NLR, LMR, and MPV may be used to distinguish patients with endometriosis from controls (Tab. 4, Fig. 4, Ref. 37). Text in PDF www.elis.sk.
KEY WORDS: CA-125, endometriosis, lymphocyte-to-monocyte ratio, mean platelet volume, neutrophil-to-lymphocyte ratio.
1Department of Obstetrics and Gynecology, Faculty of Medicine, Istanbul Medeniyet University, Istanbul, Turkey, 2Department of Obstetrics and Gynecology, Goztepe Training and Research Hospital, Istanbul Medeniyet University, Istanbul, Turkey, 3Department of Obstetrics and Gynecology, Faculty of Medicine, Balikesir University, Balikesir, Turkey, and 4Division of Biostatistics, Faculty of Medicine, Marmara University, Istanbul Turkey
Address for correspondence: M. Hocaoglu, MD, Dr, Erkin cad. Goztepe
Training and Research Hospital, Kadikoy, Istanbul, Turkey. Phone: +90 5063718935, Fax: +216 566 66 14
Introduction
Endometriosis is characterized by the presence of implants of abnormally placed tissue similar to endometrium, including glands and stroma, outside the uterine cavity (1, 2). It causes pelvic infl am-mation, which leads to pelvic pain, including dysmenorrhea, and infertility (3). The defi nitive diagnosis of endometriosis is made from histological evaluation of a lesion biopsied during surgery such as laparoscopy or laparotomy, which is an expensive and in-vasive procedure (4, 5). The diagnosis of endometriosis by means of a non-invasive diagnostic biomarker is a challenging problem (6). Although a variety of tests utilizing blood markers have been suggested as diagnostic measures for endometriosis, none have been implemented routinely in clinical practice (7).
Neutrophil-to-lymphocyte ratio (NLR) is affected by both innate immune response (mediated by neutrophils) and adaptive
immune response (mediated by lymphocytes) (8). NLR has been shown to be a reliable marker of systemic infl ammation, which has been demonstrated in various studies (9, 10). The levels of circulating lymphocytes and monocytes are refl ective of the im-munological function in the peripheral blood (11). Lymphocyte to-monocyte ratio has been proposed as a surrogate marker for endothelial dysfunction and infl ammation in distinct populations and it also has a prognostic and predictive value (12). The plate-let activation has long been noticed in the pathophysiology of infection and infl ammation. The mean platelet volume (MPV) is a reliable indicator of platelet size, which refl ects platelet func-tion and activafunc-tion (13). It has been suggested that MPV has an important role as a marker of infl ammation, disease activity, and effi cacy of anti-infl ammatory treatment in several chronic in-fl ammatory disorders (14). However, the research in the area of NLR and MPV in the diagnosis of endometriosis is very limited and none of it investigates LMR in women with endometriosis (15, 16, 17).
Due to the presence of a chronic infl ammatory state in pa-tients with endometriosis, it was decided to conduct the current study while using NLR, LMR and MPV to investigate their roles in the diagnosis of endometriosis. The aim of this study was to evaluate the diagnostic value of NLR, LMR and MPV in Turkish patients with endometriosis as compared with a healthy control group.
Materials and methods
This retrospective, comparative, cohort study was carried out at the Department of Obstetrics and Gynecology of Istanbul Medeni-yet University, Goztepe Training and Research Hospital, and was approved by the Institutional Review Board and Ethics Commit-tee. The initial evaluation was made in 268 premenopausal women who underwent either laparoscopic or laparotomic surgery and had their diagnosis of endometriosis confi rmed pathologically between January 2012 and February 2017 following surgery. A total of 121 women were recruited into the study according to the exclusion criteria. Patients were excluded if they had a confi rmed pathol-ogy or clinical suspicion of endometrial patholpathol-ogy, leiomyoma or adenomyosis. The control group, consisted of 136 healthy women who presented at the gynecology clinic for a routine checkup and had no complaints or history of gynecological disease or cancer. Sample selection fl ow chart is given in Figure 1. Transvaginal ultrasonography (TVS) was performed on both groups during the gynecological examination. The exclusion criteria for the two groups included pregnancy, menopause, chronic diseases such as hematological, cardiac, kidney or liver diseases, prediabetes, dia-betes mellitus, hypertension, hyperlipidemia asthma, connective tissue disorders, previous thrombosis, neoplastic disease, acute-chronic infl ammatory disorders, use of glucocorticoids, antineo-plastic agents, anticoagulants, non-steroidal anti-infl ammatory drugs, or oral contraceptives, hormonal treatment and smoking.
The clinical, demographic, laboratory, and surgical data were collected from hospital records and patient fi les. The preoperative complete blood count parameters (white blood cell, neutrophil, lymphocyte, monocyte and platelet counts, MPV, hemoglobin and hematocrit) and levels of CA-125 were recorded. All patients were operated on during the follicular phase of the menstrual cycle, and all blood analyses were performed during the early follicu-lar phase. The extent of the disease in patients with
endometrio-sis was determined using the American Society of Reproductive Medicine (ASRM) revised classifi cation while the severity of the disease was classifi ed as minimal-to-mild disease (stages I‒II) or moderate-to severe disease (stages III‒IV) (1).
The blood samples were collected in EDTA tubes and pro-cessed using a hematology analyzer (Abbott CELL DYN 3700, Boston, USA) for complete blood count analysis. CA-125 levels were measured using ARCHITECT i2000 (Abbott Diagnostics, Abbott Park, IL). The neutrophil-to-lymphocyte ratio (NLR) was calculated for both the patient and control groups by dividing the absolute neutrophil count by the absolute lymphocyte count. Lymphocyte-to-monocyte ratio (LMR) was calculated for both the patient and control groups by dividing the absolute lymphocyte count by the absolute monocyte count.
Statistical analyses
Statistical analyses were performed using R Statistical Soft-ware (www.r-project.org), a free softSoft-ware environment for statisti-cal computing and graphics (18). The Shapiro‒Wilk test, QQ and PP plots were used to analyze the data distribution. The continuous baseline characteristics of the groups were presented as median, interquartile range (IQR), minimum and maximum values depend-ing on the data distribution while categorical values were defi ned as number (n) and percentage (%). Parity, virginity, complaints and endometrioma variables were compared between stage I and II and stages III and IV in patient groups using Fisher’s exact test. The Shapiro‒Wilk test was used to analyze the data distribution. The Mann–Whitney U test was used for comparisons and the as-sociated p values were given. The effect sizes of the tests were also given (19). The effect sizes for 2 by 2 chi-square test was given as the phi coeffi cient and Cramer’s V for larger tables us-ing “assocstats” function of the power analysis package in R (20, 21). The effect size for Mann‒Whitney U test was calculated by dividing the z test statistic by the square root of the number of
Fig. 1. STARD diagram for the fl ow of participants (Turkish patients with endometriosis and controls) throughout the study. (A) All 121 pa-tients with endometriosis from 2012 to 2017, who fulfi lled the clinical diagnostic criteria were enrolled in this study. (B) Healthy controls (136 Turkish women) were also recruited.
Hanley and McNeil paper (26). The p-value produced for AUC was related to the Mann-Whitney U statistics. The AUCs of ROC curves were compared using the pROC program of R based on the method of Delong et al (28). For all analyses, a value of p < 0.05 was considered statistically signifi cant.
Results
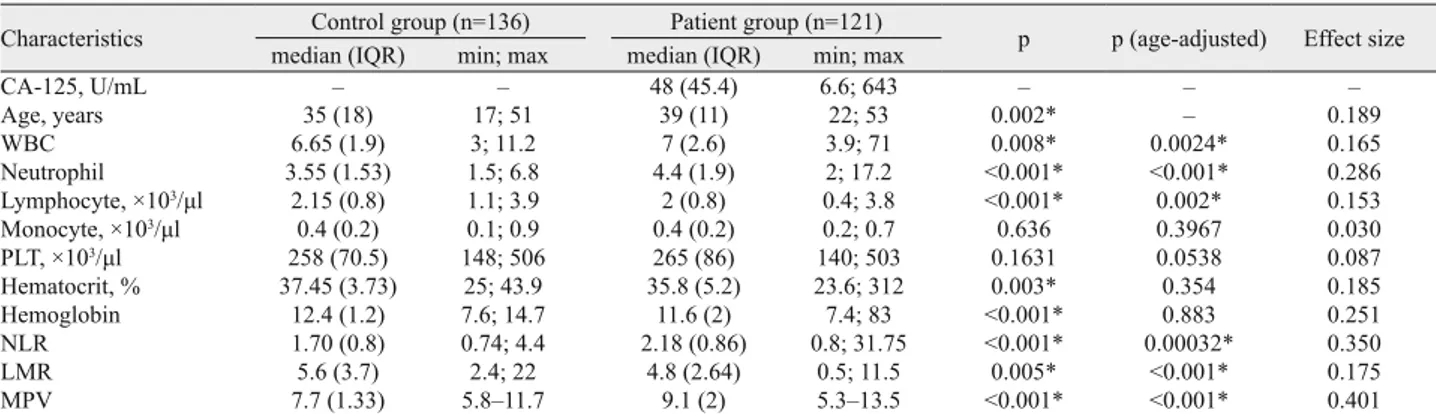
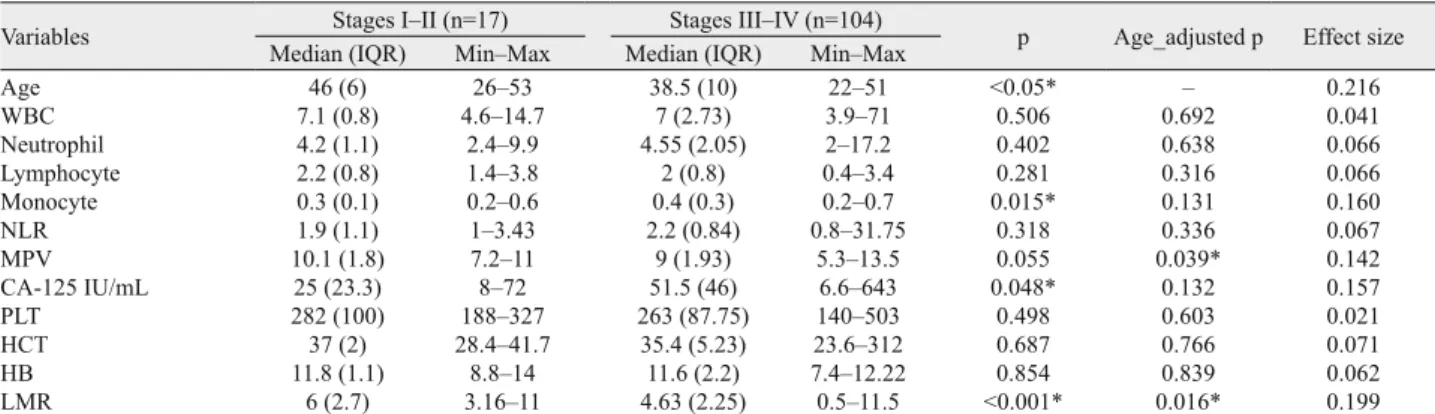
Overall, 121 patients with endometriosis were included in the study, of whom 17 had stage I or II and 104 had stage III or IV of endometriosis. The control group consisted of 136 healthy women who had presented at gynecology outpatient clinics for a routine check-up. The baseline characteristics of the endome-triosis group are shown in Table 1. The median age of patients in the endometriosis group and healthy control group were 39 (interquartile range (IQR) = 11) years, and 38 (IQR = 18) years, respectively. The patients with endometriosis were signifi cantly older than the subjects in the control group (39 vs 35 years; p < 0.05). Thus, age was included as a covariate in the logistic re-gression model with the given variable to classify the control and endometriosis groups. After adjustment for age, the patients with endometriosis had signifi cantly higher neutrophil counts, WBC levels, NLR, MPV, and lower lymphocyte count and LMR than the control group (p < 0.05). Mean platelet volume seemed to have the highest effect size among other variables (effect size d = 0.401). The comparisons of characteristics between the control group and patient group with endometriosis and age-adjusted p values are given in Table 2. There were no statistically signifi cant differences in respect of parity, virginity and complaints between patients with minimal-to-moderate disease (stages I and II) and moderate-to-severe disease (stages III and IV) (p > 0.05). The percentage of endometrioma was determined to be much higher in the late stages of endometriosis (p < 0.001). The endometriosis group was also assessed according to the severity of the disease (Tab. 3). After adjustment for age, the patients with stage III or IV had signifi cantly lower MPV counts (p = 0.039; effect size d = 0.142) and LMR (p = 0.016; effect size d = 0.199) than patients with stage III or IV.
No. of women (n=121
Percentage (%) Age (years) Median (IQR)
Min; max 39 (11) 22‒53 Nulliparous 43 36 Multiparous 78 64 Virginity 15 12
Chronic pelvic pain 39 32
Primary infertility 12 10
Secondary infertility 2 1
Dysmenorrhea 10 8
Abnormal uterine bleeding 20 16
Dyspareunia 6 5 Pelvic pain 7 6 Endometrioma I II III IV 93 10 7 33 71 77 8 6 27 59
Stages I‒II (minimal‒mild) 17 14
Stages III‒IV (moderate‒severe) 104 86
Diameter of mass Median (IQR) Min; max
6 (3) 2‒16 IQR, interquartile range; Min, minimum; Max, maximum
Tab. 1. Baseline characteristics of study group with endometriosis.
Characteristics Control group (n=136) Patient group (n=121) p p (age- adjusted) Effect size median (IQR) min; max median (IQR) min; max
CA-125, U/mL ‒ ‒ 48 (45.4) 6.6; 643 ‒ ‒ ‒ Age, years 35 (18) 17; 51 39 (11) 22; 53 0.002* ‒ 0.189 WBC 6.65 (1.9) 3; 11.2 7 (2.6) 3.9; 71 0.008* 0.0024* 0.165 Neutrophil 3.55 (1.53) 1.5; 6.8 4.4 (1.9) 2; 17.2 <0.001* <0.001* 0.286 Lymphocyte, ×103/μl 2.15 (0.8) 1.1; 3.9 2 (0.8) 0.4; 3.8 <0.001* 0.002* 0.153 Monocyte, ×103/μl 0.4 (0.2) 0.1; 0.9 0.4 (0.2) 0.2; 0.7 0.636 0.3967 0.030 PLT, ×103/μl 258 (70.5) 148; 506 265 (86) 140; 503 0.1631 0.0538 0.087 Hematocrit, % 37.45 (3.73) 25; 43.9 35.8 (5.2) 23.6; 312 0.003* 0.354 0.185 Hemoglobin 12.4 (1.2) 7.6; 14.7 11.6 (2) 7.4; 83 <0.001* 0.883 0.251 NLR 1.70 (0.8) 0.74; 4.4 2.18 (0.86) 0.8; 31.75 <0.001* 0.00032* 0.350 LMR 5.6 (3.7) 2.4; 22 4.8 (2.64) 0.5; 11.5 0.005* <0.001* 0.175 MPV 7.7 (1.33) 5.8‒11.7 9.1 (2) 5.3‒13.5 <0.001* <0.001* 0.401
IQR, Interquartile range; WBC, white blood cell; NLR, neutrophil-to-lymphocyte ratio; LMR, lymphocyte-to-monocyte ratio; MPV, mean platelet volume. * p < 0.05 was considered statistically signifi cant. IQR: Interquartile range
Tab. 2. Comparison of characteristics between the control group and patient group with endometriosis.
cases (21, 22). Age-adjusted p values were calculated using the logistic regression. The receiver-operating curve (ROC) analyses were constructed to evaluate diagnostic performances and optimal cut-off values for LMR, NLR and MPV in endometriosis patients. Youden’s index (Maximum = Sensitivity + Specifi city – 1) was used as an optimization criterion for cut-off values (23). The area under the ROC curves was used to assess the discriminative the ability of LMR, NLR and MPV in endometriosis (24‒26). Epi and verifi cation programs were used for ROC curve estimations (27). The area under the ROC curve was calculated following the process outlined by Mason and Graham (25). The standard error of the area under the curve (AUC) was calculated based on the
There was a signifi cant difference between the patient group and control group in respect of biomarkers, WBC, neutrophil, LMR, NLR, and MPV. Thus, these biomarkers were further inves-tigated for potential cut-off points and area under curve (AUC). The sensitivity, specifi city, positive predictive value and
nega-tive predicnega-tive value for these biomarkers are shown in Table 4. ROC analysis indicated that the combined marker had a higher AUC (0.766) than other biomarkers. The ROC analyses indicate that the p values associated with the given biomarkers were all < 0.05. Thus, all AUCs were signifi cantly different from 0.5, which
Variables Stages I‒II (n=17) Stages III‒IV (n=104) p Age_adjusted p Effect size
Median (IQR) Min‒Max Median (IQR) Min‒Max
Age 46 (6) 26‒53 38.5 (10) 22‒51 <0.05* ‒ 0.216 WBC 7.1 (0.8) 4.6‒14.7 7 (2.73) 3.9‒71 0.506 0.692 0.041 Neutrophil 4.2 (1.1) 2.4‒9.9 4.55 (2.05) 2‒17.2 0.402 0.638 0.066 Lymphocyte 2.2 (0.8) 1.4‒3.8 2 (0.8) 0.4‒3.4 0.281 0.316 0.066 Monocyte 0.3 (0.1) 0.2‒0.6 0.4 (0.3) 0.2‒0.7 0.015* 0.131 0.160 NLR 1.9 (1.1) 1‒3.43 2.2 (0.84) 0.8‒31.75 0.318 0.336 0.067 MPV 10.1 (1.8) 7.2‒11 9 (1.93) 5.3‒13.5 0.055 0.039* 0.142 CA-125 IU/mL 25 (23.3) 8‒72 51.5 (46) 6.6‒643 0.048* 0.132 0.157 PLT 282 (100) 188‒327 263 (87.75) 140‒503 0.498 0.603 0.021 HCT 37 (2) 28.4‒41.7 35.4 (5.23) 23.6‒312 0.687 0.766 0.071 HB 11.8 (1.1) 8.8‒14 11.6 (2.2) 7.4‒12.22 0.854 0.839 0.062 LMR 6 (2.7) 3.16‒11 4.63 (2.25) 0.5‒11.5 <0.001* 0.016* 0.199
p, p value signifi cant at 0.05 level; IQR, interquartile range; min, minimum; max, maximum; CA-125, serum cancer antigen; WBC, white blood cell; NLR, neutrophil-to-lymphocyte ratio; MPV, mean platelet volume; LMR, neutrophil-to-lymphocyte-to-monocyte ratio; HCT, hematocrit; HB, hemoglobin, * p < 0.05 was considered statistically signifi cant. IQR: Interquartile range, Mann‒Whitney test. Values are expressed as medians.
Tab. 3. Comparison of laboratory characteristics between patients with minimal-to-moderate disease (stages I or II) and moderate-to-severe disease (stages III or IV).
Biomarkers AUC (95 % CI) Sensitivity (%) Specifi city (%) PPV NPV LR‒ LR+ Cut-off value p WBCs/mL (0.526‒0.665)0.596 59.5 55.9 55.5 61.8 1.35 0.72 6.8 0.004 Neutrophils/mL (0.5998‒0.7322)0.666 76 51.4 58.2 70.7 1.57 0.47 3.6 <0.001 NLR 0.702 (0.6398‒0.7662) 87.6 44.8 58.6 80.3 1.59 0.28 1.60 <0.001 MPV (0.666‒0.798)0.732 75.2 68.4 67.9 75.6 2.38 0.36 8 <0.001 LMR (0.532‒0.670)0.601 66.1 50 37.6 45.9 0.68 1.32 5.6 0.002
WBC, white blood cell; NLR, neutrophil-to-lymphocyte ratio; LMR, lymphocyte-to-monocyte ratio; MPV, mean platelet volume; AUC, area under the curve; CI, confi dence interval; PPV, positive predictive value; NPV, negative predictive value; LR: likelihood ratio, * p < 0.05 was considered statistically signifi cant
Tab. 4. Sensitivity, specifi city, positive predictive value and negative predictive value of blood count parameters LMR, NLR and MPV for de-tection of endometriosis.
Fig. 2. Receiver–operating characteristic (ROC) curve of neutrophil-to-lymphocyte ratio (NLR) for differentiating endometriosis from healthy control.
Fig. 3. Receiver–operating characteristic (ROC) curve of mean platelet volume (MPV) for differentiating endometriosis from healthy controls
shows that these biomarkers are all good indicators for anticipat-ing endometriosis. The AUC for NLR was 0.702 with 95% CI from 0.639 to 0.766 (Fig. 2). The best cut-off for NLR was 1.6. At this cut-off point, the sensitivity was 87.6 %, specifi city 44.8 %, positive predictive value 58.6 %, and negative predictive value 80.3 %. For MPV, the AUC was 0.732 (95% CI 0.666‒0.798), and the cutoff value was 8 with 75.2 % sensitivity, 68.4 % specifi c-ity, positive predictive value of 67.9 %, and negative predictive value of 75.6 % (Fig. 3). For LMR, the AUC was 0.601 (95% CI 0.532‒0.670) and the cutoff value was 5.6 with 66.1 % sensitivity, 50% specifi city, positive predictive value of 37.6 %, and negative predictive value of 45.9 % (Fig. 4).
Discussion
Cancer antigen 125 (CA-125) has been widely used for the diagnosis and follow-up of patients with endometriosis. The sen-sitivity and specifi city of CA-125 with a cutoff level of 35 IU/mL in this study were 55.8 % and 92.8 %, respectively, which was similar to the results of meta-analyses conducted in 23 studies in-volving 2,866 patients. It is often elevated in advanced endome-triosis while sensitivity is especially low in early-stage disease. The sensitivity and specifi city of the serum CA-125 measurement in the diagnosis of endometriosis grade III/IV have been reported as 47 % and 89 %, respectively (29). CA-125 is expressed in some derivatives of coelomic epithelium. It has been found to be ele-vated in the serum of patients with epithelial ovarian carcinomas, endometrium and fallopian tube carcinomas, and gastrointestinal and breast malignancies (30). Also, the timing of blood collection for CA125 in relation to the menstrual cycle is known to signifi -cantly affect this test (31)
Endometriosis is an infl ammatory condition. It is known that endometrial cells that refl ux into the peritoneal cavity secrete che-mokines creating a feed-forward loop that stimulates the infi ltra-tion of immune cells (32). Subclinical peritoneal infl ammaltra-tion in patients with endometriosis is demonstrated by increased white blood cells, especially macrophages, and higher cytokine levels
Fig. 4. Receiver–operating characteristic (ROC) curve of lympho-cyte to monolympho-cyte ratio (LMR) for differentiating endometriosis from healthy controls
in the peritoneal fl uid (17). Increased neutrophil and decreased lymphocyte counts resulted in an increase in NLR in patients with endometriosis when compared with the healthy control group. There have been few studies to date assessing the role of NLR as a diagnostic marker in patients with endometriosis as compared with the healthy control group. In a retrospective study using NLR to differentiate between endometriosis cases and control subjects (benign tumor group and healthy control group), Cho et al. reported that NLR with a cut-off value of 2.01 had sensitivity and specifi city of 59.7 % and 60.1 %, respectively, which is con-sistent with the current fi ndings (15). It was also determined that NLR combined with CA-125 had the sensitivity of 69.3 % and specifi city of 83.9 % when 55.7 was set as the cut-off value (15). In a prospective study of patients with endometriosis and patients with benign ovarian cysts performed by Sayan et al, the combined marker (NLR and CA-125) had the highest sensitivity at 80.0 % when compared to NLR, CA-125, and interleukin 8 alone, with specifi city of 86.0 %, which was lower than the specifi city of CA-125, the marker with the highest specifi city (16). In a retrospec-tive compararetrospec-tive study of women with endometriosis and benign ovarian cysts, Tokmak et al suggested that the best NLR cut-off value was 1.9 with 70 % sensitivity and 74 % specifi city (17). In addition, the cut-off value for the combined marker of NLR and CA-125 was determined to be 41.0 with 80 % sensitivity and 82 % specifi city (17). The results reported by Sayan et al and Tokmak et al are inadequate for differentiating the patients with endome-triosis from healthy control subjects (16, 17).
Mean platelet volume (MPV) is the size of platelets, and an increase in this value is an indicator of large more reactive plate-lets resulting from increased platelet turnover. In a study by Guo et al, it was reported that the platelet count, WBC count, MPV and platelet activation rate in the peritoneal fl uid from women with endometriosis were signifi cantly elevated when compared with those of women without endometriosis (33). In the current study, higher MPV levels were determined in patients with en-dometriosis in comparison with healthy women. Mean platelet volume with a cut-off value of 8 has the sensitivity and specifi c-ity of 75.2 % and 68.4 %, respectively. Similarly, Tokmak et al found that MPV levels in patients with endometrioma were higher than those in the control group with benign ovarian cysts (17). However, sensitivity, specifi city, positive predictive value, and negative predictive value of MPV are not analyzed in the study by Tokmak et al (17).
The lymphocyte-to-monocyte ratio (LMR) has been studied as an infl ammatory marker in local or systemic infl ammation, previous history of infection, and infl ammatory diseases (12). In current literature, lower LMR values were assessed in infl amma-tory diseases (34). To the best of our knowledge, this is the fi rst report describing the predictive role of LMR in the diagnosis of endometriosis. The results from this study indicate that lower LMR levels were determined in patients with endometriosis in comparison with healthy women. The lymphocyte-to-monocyte ratio with a cut-off value of 5.6 has the sensitivity and specifi city of 66.1 % and 50%, respectively. It turned out that LMR was less sensitive than NLR and MPV.
The endometriosis group was also evaluated according to the severity of the disease. Our study fi ndings showed no dif-ferences in NLR between patients at stage I or II and those at stage III or IV. Also, the results of the current study were incon-sistent with previous reports that NLR is signifi cantly different between minimal-mild and moderate-severe diseases (15, 17). The discrepancy between the previous and present fi ndings may be attributed to relatively few patients with stage I or II in our study cohort. Likewise, Kim et al (35) and Yavuzcan et al (36) reported that the severity of endometriosis was not related to the NLR value. In our study, MPV and LMR were found to be statistically different in the stages of endometriosis. Conversely, Yavuzcan et al stated that there was no signifi cant relationship between MPV and advanced-stage endometriosis (36). Interest-ingly, a comparison of MPV based on disease severity showed differences, which was signifi cantly decreased in patients with stage III or IV of the disease. These fi ndings may seem to be in-compatible with the pathophysiology of endometriosis. But also, the discrepancy between the change in MPV levels and sever-ity may be attributed to the fact that both low and high levels of MPV indicate infl ammation. It seems that the size of circulating platelets is dependent on the intensity of systemic infl ammation with contrasting features of MPV in high- and low-grade in-fl ammatory diseases and course of anti-inin-fl ammatory treatment. Disease-specifi c and cardiovascular confounding factors affect the direction of MPV changes (14). Therefore, while low-grade infl ammatory conditions are associated with high levels of MPV, the high-grade infl ammatory diseases such as active rheumatoid arthritis or attacks of familial Mediterranean fever are associated with low levels of MPV (37).
The current study has some limitations. The sample size was moderate, thus further research involving a larger population size is needed to confi rm the clinical utility. As it was a retrospective analysis, the data entry errors could be a possible source of bias. Data such as body mass index are missing, which could also con-tribute to the confounding effects. It was not possible to assess CA- 125 levels in the healthy control group.
Conclusion
The results of this study have shown that NLR and MPV in patients with endometriosis are signifi cantly higher and LMR is lower than those in healthy controls without endometriosis. Lym-phocyte-to-monocyte (LMR) ratio and MPV may be considered as useful biomarkers for both the diagnosis of endometriosis and prediction of the disease severity. These biomarkers are practical, easy and inexpensive tests. Nevertheless, they warrant further evaluation in prospective, controlled studies with larger sample sizes and additional markers.
References
1. Hocaoglu M, Turgut A, Ozdamar O, Aslan A, Demirer S, Usta A, Ekdeniz E, Karateke A. Abdominal wall endometriosis in patients
with a history of cesarian section. Ann Ital Chir 2018; 89: 425‒430.
2. Dordevic M, Jovanovic B, Mitrovic S, Dordevic G, Radovanovic D, Sazdanovic P. Abdominal rectus muscle endometriosis after
Cesar-ean section. Extrapelvic localization of endometriosis. Bratisl Lek Listy 2010; 111 (6): 345‒348.
3. Pitonak J, Galova J, Bernasovska J. Association of two selected
poly-morphisms with developed endometriosis in women from Slovakia. Bratisl Lek Listy 2016; 117 (8): 452‒455.
4. American Society for Reproductive Medicine. Revised American
Society for Reproductive Medicine classifi cation of endometriosis Fertil Steril 1996; 67: 817.
5. Duffy JM, Arambage K, Correa FJ et al. Laparoscopic surgery for
endometriosis. Cochrane Database Syst Rev 2014; 3: CD011031.
6. Casper RF. Introduction: A focus on the medical management of
en-dometriosis. Fertil Steril 2017; 107: 521‒522.
7. Nisenblat V, Bossuyt PM, Shaikh R et al. Blood biomarkers for the
non-invasive diagnosis of endometriosis. Cochrane Database Syst Rev 2016; 05: CD012179.
8. Korkmaz M, Korkmaz H, Küçüker F, Ayyildiz SN, Çankaya S.
Evaluation of the association of sleep apnea-related systemic infl amma-tion with CRP, ESR, and neutrophil-to-lymphocyte ratio. Med Sci Monit 2015; 13; 21: 477‒481.
9. Gezer C, Ekin A, Solmaz U, Sahingoz Yildirim AG, Dogan A, Ozeren M. Identifi cation of preterm birth in women with threatened
pre-term labour between 34 and 37 weeks of gestation. J Obstet Gynaecol 2018; 9: 1‒6.
10. Verit FF, Cetin O, Yildirim O, Keskin S, Yucel O, Yalcinkaya S.
Neutrophil to lymphocyte ratio is superior to platelet to lymphocyte ratio as an early predictor of moderate/severe ovarian hyperstimulation syndrome. J Obstet Gynaecol 2014; 34: 639‒643.
11. Ji H, Niu X, Yin L et al. Ratio of Immune Response to Tumor Burden
Predicts Survival Via Regulating Functions of Lymphocytes and Mono-cytes in Diffuse Large B-Cell Lymphoma. Cell Physiol Biochem 2018; 45: 951‒961.
12. Balta S., Demirer Z., Aparci M., Yildirim A.O., Ozturk C. The
lymphocyte-monocyte ratio in clinical practice. J Clin Pathol 2016; 69: 88.
13. Ekin A, Gezer C, Kulhan G, Avci ME, Taner CE. Can platelet count
and mean platelet volume during the fi rst trimester of pregnancy predict preterm premature rupture of membranes? J Obstet Gynaecol Res 2015; 41: 23‒28.
14. Gasparyan AY, Ayvazyan L, Mikhailidis DP, Kitas GD. Mean
plate-let volume: a link between thrombosis and infl ammation? Curr Pharm Des 2011; 17: 47‒58.
15. Cho S, Cho H, Nam A et al. Neutrophil-to-lymphocyte ratio as an
adjunct to CA-125 for the diagnosis of endometriosis. Fertil Steril 2008; 90: 2073‒2709.
16. Sayan CD, Ozaksit MG, Sarikaya E, Eryilmaz OG, Mollamah-mutoglu L, Deveer R. Serum interleukin-8, CA-125 levels,
neutrophil-to-lymphocyte ratios, and combined markers in the diagnosis of endome-triosis. Turk J Med Sci 2013; 43: 417‒423.
17. Tokmak A, Yildirim G, Öztaş E et al. Use of
Neutrophil-to-Lympho-cyte Ratio Combined With CA-125 to Distinguish Endometriomas From Other Benign Ovarian Cysts. Reprod Sci 2016; 23: 795‒802.
18. R Development Core Team. R: A language and environment for
sta-tistical computing. R Foundation for Stasta-tistical Computing, Vienna, Austria 2008. ISBN 3-900051-07-0, URL http://www.R-project.org.
19. Sullivan GM, Feinn R. Using effect size ‒ or why the P value is not
enough. J Grand Med Educ 2012; 4: 279‒282.
20. Gravetter FJ, Wallnau LB. Statistics for the behavioral sciences.
Cengage Learning 2016.
21. Pallant J. SPSS survival manual 2016; 6th Edition. McGraw-Hill
Education (UK).
22. Cohen J. Statistical power analysis for the behavioral sciences. 1988. 23. Youden WJ. Index for rating diagnostic tests. Cancer 1950; 3: 32. 24. Xavier R, Robin X, Turck N et al. pROC: an open-source package
for R and S+ to analyze and compare ROC curves. BMC Bioinformat-ics 2011; 17: 12.
25. Mason SJ, Graham NE. Areas beneath the relative operating
char-acteristics (ROC) and relative operating levels (ROL) curves: Statistical signifi cance and interpretation. Q J R Meteorol Soc 2002; 128: 2145.
26. Hanley JA, McNeil BJ. The meaning and use of the area under a
receiver-operating characteristic (ROC) curve. Radiology 1982; 143: 29.
27. Carstensen B, Plummer M, Laara E, Hills M. Epi: A Package for
Statistical Analysis in Epidemiology 2016; R package version 2.7. URL https://CRAN.R-project.org/package=Epi.
28. DeLong ER, DeLong DM, Clarke-Pearson DL. Comparing the areas
under two or more correlated receiver operating characteristic curves: a nonparametric approach. Biometrics 1988; 44: 837‒845.
29. Mol BW, Bayram N, Lijmer JG et al. The performance of CA-125
measurement in the detection of endometriosis: a meta-analysis. Fertil Steril 1988; 70: 1101.
30. Chen FP, Soong YK, Lee N, Lo SK. The use of serum CA-125 as a
marker for endometriosis in patients with dysmenorrhea for monitoring therapy and for recurrence of endometriosis. Acta Obstet Gynecol Scand 1998; 77: 665‒670.
31. Spaczynski RZ, Duleba AJ. Diagnosis of endometriosis. Semin
Re-prod Med 2003; 193–208.
32. McKinnon BD, Kocbek V, Nirgianakis K, Bersinger NA, Mueller MD. Kinase signaling pathways in endometriosis: potential targets for
non-hormonal therapeutics. Hum Reprod Update 2016; 4: 22.
33. Guo SW, Du Y, Liu X. Platelet-derived TGF-b1 mediates the
down-modulation of NKG2D expression and may be responsible for impaired natural killer (NK) cytotoxicity in women with endometriosis. Hum Re-prod 2016; 31: 1462‒1474.
34. Demirdal T, Sen P. The signifi cance of neutrophil-lymphocyte ratio,
platelet-lymphocyte ratio and lymphocyte-monocyte ratio in predicting peripheral arterial disease, peripheral neuropathy, osteomyelitis and am-putation in diabetic foot infection. Diabetes Res Clin Pract 2018; 144: 118‒1125.
35. Kim SK, Park JY, Jee BC, Suh CS, Kim SH. Association of the
neutrophil-to-lymphocyte ratio and CA 125 with the endometriosis score. Clin Exp Repro Med 2014; 41: 151‒157.
36. Yavuzcan A, Cağlar M, Üstün Y et al. Evaluation of mean platelet
volume, neutrophil/ lymphocyte ratio and platelet/lymphocyte ratio in ad-vanced stage endometriosis with endometrioma. J Turk German Gynecol Ass 2013; 210‒215.
37. Balta I, Balta S, Koryurek OM et al. Mean platelet volume is
associ-ated with aortic arterial stiffness in patients with Behçet’s disease without signifi cant cardiovascular involvement. J Eur Acad Dermatol and Venereol 2014; 28: 1388‒1393.
Received April 9, 2019. Accepted July 2, 2019.