NANOGAP BASED LABEL-FREE
IMPEDIMETRIC BIOSENSORS
A THESIS
SUBMITTED TO THE DEPARTMENT OF ELECTRICAL AND ELECTRONICS ENGINEERING
AND THE GRADUATE SCHOOL OF ENGINEERING AND SCIENCE OF BILKENT UNIVERSITY
IN PARTIAL FULLFILMENT OF THE REQUIREMENTS FOR THE DEGREE OF
MASTER OF SCIENCE
By
Oğuz Hanoğlu
I certify that I have read this thesis and that in my opinion it is fully adequate, in scope and in quality, as a thesis for the degree of Master of Science.
Assist. Prof. Dr. Ali Kemal Okyay (Supervisor)
I certify that I have read this thesis and that in my opinion it is fully adequate, in scope and in quality, as a thesis for the degree of Master of Science.
Prof. Dr. Ergin Atalar
I certify that I have read this thesis and that in my opinion it is fully adequate, in scope and in quality, as a thesis for the degree of Master of Science.
I certify that I have read this thesis and that in my opinion it is fully adequate, in scope and in quality, as a thesis for the degree of Master of Science.
Assoc. Prof. Dr. Mustafa Özgür Güler
I certify that I have read this thesis and that in my opinion it is fully adequate, in scope and in quality, as a thesis for the degree of Master of Science.
Prof. Dr. Gönül Turhan-Sayan
Approved for the Graduate School of Engineering and Science:
Prof. Dr. Levent Onural Director of the Graduate School
ABSTRACT
NANOGAP BASED LABEL-FREE IMPEDIMETRIC
BIOSENSORS
Oğuz Hanoğlu
M.S. in Electrical and Electronics Engineering
Supervisor: Assist. Prof. Dr. Ali Kemal Okyay
July 2012
Despite lots of research going on to find a hope, cancer is still a major cause of death in today‘s world. It has been reported that cancer has some biomarkers in human body and detecting these biomarkers timely can pave the way for early
detection and successful treatments.
Point-of-care biosensors are highly promising for this mission. If these
biosensors can achieve sensitivity and reliability with a low-cost and simple platform, they can address a large mass of people who are at the early stages of cancer without any clear symptoms yet.
For this purpose, various biosensing mechanisms can be used to convert the signal coming from the recognition elements on the biosensor surface to the digital domain for signal processing. One of these mechanisms, impedimetric
(impedance based) sensing is a very appealing electrical biosensing method
since this method can offer label-free, low-cost, low-power requirement, miniaturizable, and chip-integrable detection platforms. However, impedimetric sensing in liquid medium is problematic, since during the electrical measurements, ion-based undesired layers (electrical double layers) are formed over the electrodes in the target liquid. Unfortunately, these layers act like a shield against the applied electric field to the liquid and can prevent the detection of the target biomarkers.
In this thesis, a nanogap based label-free biosensor structure is designed and using this design impedimetric sensing in liquid medium is demonstrated at low
frequencies (1 kHz – 100 kHz). Low frequency platforms are quite amenable to
low-cost applications like point-of-care biosensing.
The designed structure utilizes nanometer scale electrode separation (nanogap). Theoretical calculations show that nanogap reduces the undesired effect of electrical double layer. Moreover, nanogap also helps in minimizing the volume of the required liquid for the measurement.
Design, fabrication, surface functionalization and biotinylation stages of the
biosensor are realized in a cleanroom environment and biomimetic materials laboratory. The fabricated biosensor is tested by introducing the target molecules (streptavidin) in a phosphate-buffered saline solution. A parameter analyzer with a capacitance-voltage unit and a probe station are used for the impedance measurements.
With these biosensors, label-free detection of streptavidin is observed for 100 µg/mL, 10 µg/mL, 1 µg/mL, 100 ng/mL and 10 ng/mL concentrations. This is, to the best of our knowledge, the first demonstration of streptavidin detection in nanogap based label-free impedimetric biosensors. The above-mentioned concentrations show that these biosensors are promising for commercial applications. Sensitivity to the dielectric constant of the target medium is measured to be 132 pF per unit change in the dielectric constant at 10 kHz measurement frequency. Reliability tests are performed: stable and repeatable operation of the sensors are checked and verified.
In conclusion, this proof-of-concept study shows that nanogap based biosensors would be a suitable and appealing choice for sensitive, reliable, simple, low-power and low-cost point-of care biosensing applications. Next step would be utilizing the platform presented in this work in detecting specific cancer biomarkers like PSA or CA125. Thereby, developed further and commercialized, nanogap based label-free impedimetric biosensors can act in the battle of human being against cancer in the future.
Keywords: biosensor, early detection, point-of-care detection, impedimetric,
ÖZET
NANOARALIK TEMELLİ ETİKETSİZ
ÇELİÖLÇER BİYOALGILAYICILAR
Oğuz Hanoğlu
Elektrik ve Elektronik Mühendisliği Bölümü, Yüksek Lisans
Tez Yöneticisi: Yar. Doç. Prof. Dr. Ali Kemal Okyay
Temmuz 2012
Bir çare bulmak adına yapılan onca araştırmaya rağmen, kanser günümüzde halen temel ölüm nedenleri arasında yer almaktadır. Araştırmalar göstermiştir ki kanser vücutta bazı biyoişaretçilere sahiptir ve bu biyoişaretçileri zamanında tespit edebilmek erken tanıya ve başarılı tedavilere olanak sağlayabilir.
Yerinde tanı yapabilen biyoalgılayıcılar bu görev için oldukça ümit
vadedicidirler. Eğer bu biyoalgılayıcılar, duyarlılığı ve güvenilirliği düşük maliyetli ve basit bir yapı ile sağlayabilirlerse, kanserin erken aşamalarında bulunan ve henüz ciddi bir belirtiye sahip olmayan geniş kitlelere hitap edebilirler.
Bu amaçla, biyoalgılayıcı yüzeyindeki algılama elemanından gelen sinyali sinyal işleme amacıyla sayısal alana dönüştürmeye yarayan çeşitli biyoalgılama mekanizmaları kullanılabilir. Bu mekanizmalardan biri olan çeli temelli
algılama çok cazip bir biyoalgılama yöntemidir; çünkü bu yöntem etiketsiz,
düşük maliyetli, düşük güç gerektiren, küçültülebilir ve çiple tümleştirilebilir algılama platformları sunabilir. Ancak, çeli temelli algılama sıvı ortamlarda sorunludur çünkü elektriksel ölçümler esnasında, hedef sıvıdaki elektrotlar üzerinde iyon temelli istenmeyen katmanlar (elektriksel çift katmanlar) oluşmaktadır. Ne yazık ki, bu katmanlar sıvıya uygulanan elektriksel alana karşı bir kalkan gibi davranmakta ve hedef biyoişaretçilerin algılanmasını önleyebilmektedir.
Bu tezde nanoaralık temelli etiketsiz bir biyoalgılayıcı yapısı tasarlanmış ve bu tasarım kullanılarak sıvı ortamda ve düşük frekanslarda (1kHz – 100 kHz)
çeli temelli algılama gösterilmiştir. Düşük frekanslı platformlar yerinde tanı
yapabilen biyoalgılayıcılar gibi düşük maliyetli uygulamalara oldukça yatkındırlar.
Tasarlanan yapı nanometre düzeyinde elektrot ayrımı (nanoaralık) kullanmaktadır. Teorik hesaplamalar nanoaralığın, elektriksel çift katmanın istenmeyen etkisini azalttığını göstermiştir. Buna ek olarak, nanoaralık ölçüm için kullanılan sıvı hacmini asgari düzeye çekmeye de yardımcı olmaktadır.
Biyoalgılayıcının tasarım, üretim, yüzey etkinleştirme ve biyotinleme aşamaları temizoda ortamında ve biyomimetik malzeme laboratuarında gerçekleştirilmiştir. Üretilen biyoalgılayıcılar hedef moleküllerin (streptavidin) fosfat tamponlu bir tuzlu su çözeltisi içinde tanıtılması ile test edilmiştir. Çeli ölçümleri için sığa-gerilim ölçüm birimli bir parametre inceleyici ve bir ölçüm istasyonu kullanılmıştır.
Bu biyoalgılayıcılarla, etiketsiz streptavidin algılaması 100 µg/mL, 10 µg/mL, 1 µg/mL, 100 ng/mL ve 10 ng/mL derişimlerinde gözlemlenmiştir. Bu, bildiğimiz kadarıyla, nanoaralık temelli etiketsiz çeliölçer biyoalgılayıcılarla streptavidin algılanmasının ilk gösterimidir. Yukarıda belirtilen derişimler bu biyoalgılayıcıların ticari uygulamalar için ümit vadettiğini göstermektedir. Hedef
ortamın dielektrik sabitine duyarlılık, 10 kHz ölçüm frekansında dielektrik
sabitindeki birim değişikliğe karşı 132 pF olarak ölçülmüştür. Güvenilirlik
testleri gerçekleştirilmiştir; algılayıcıların kararlı ve tekrarlanabilir çalışırlığı
kontrol edilmiş ve doğrulanmıştır.
Sonuç olarak, bu kavramsal ispatlayıcı çalışma nanoaralık temelli biyoalgılayıcıların duyarlı, güvenilir, basit, düşük güç ve düşük maliyet gerektiren biyoalgılama uygulamaları için uygun ve cazip bir seçenek olabileceğini göstermektedir. Bundan sonraki adım, bu çalışmada tanıtılan platformu PSA ya da CA125 gibi belirli kanser biyoişaretçilerini algılamada kullanmak olabilir. Böylece, daha da geliştirilir ve ticarileştirilirse, nanoaralık
temelli etiketsiz çeliölçer biyoalgılayıcılar gelecekte insanoğlunun kansere karşı
savaşında yer alabilirler.
Anahtar Sözcükler: biyoalgılayıcı, erken tanı, yerinde tanı, çeliölçüm,
If you fail to attain self knowledge, what good is there in your studies? Yunus Emre (13th-14th centuries)
Acknowledgements
I am full of gratitude as you will see in this part. Wherever possible, I list my thanks in alphabetical order of the surnames.
I would like to start by expressing my thanks to those who somehow contributed to this thesis and/or to my career at Bilkent. Although I may not list you by name in the following lines, please forgive me and note that I give you the first place in my acknowledgements.
No words could ever do justice to express my thanks and gratitude to my beloved family. So, I will not even begin expressing how their love, guidance, support, encouragement, warmth, comfort, joy, inspiration, affection, help, advice… played a critical role in this work.
Rudyard Kipling said “I keep six honest serving-men (They taught me all I
knew); their names are What and Why and When and How and Where and Who.” Thanks to my six men whom I had the opportunity to meet a long time
ago. I am grateful to each of you for you have stayed with me up to now. It is my pleasure to share in this thesis what you taught me during my research.
Thanks to my supervisor, Prof. Ali Kemal Okyay. I would like to express my deepest graduate to you for being a wonderful supervisor to me. You were involved in every aspect of my research, helped enormously by sharing your invaluable experience and enlightened my path with your guidance and support. You were not only a supervisor teaching me how to do research but you were also a mentor showing and explaining how to be an academician, how to run a research team and how to collaborate with other researchers. You have given me freedom to explore many areas and have always been open to provide advice and support. I am more than grateful to you for your confidence in my abilities, your gentle and pleasing demeanor, your genuine thoughtfulness, and for the magnificent opportunities you provided me.
I would like to thank Prof. Ergin Atalar, Prof. Necmi Bıyıklı, Prof. Mustafa Özgür Güler and Prof. Gönül Turhan Sayan for being members of my thesis committee, reading my thesis, providing suggestions and helping me making it better.
The work described in this thesis is result of a collaborative effort. I would like to thank our collaborators Prof. Necmi Bıyıklı and Prof. Mustafa Özgür Güler for their productive and rewarding collaboration. Your encouragement, guidance, useful and timely comments, expertise and lab opportunities have all been essential to achieve the research results in this thesis. Thanks to Prof. Sedat Ağan from Kırıkkale University for his contributions and assignment of his students to our nanogap project. I would like to deeply thank Handan Acar, a PhD student of Dr. Güler and the princess of our project. You managed every detail in the surface functionalization and biotinylation parts of our project very well. You have introduced various laboratory equipments (ellipsometer, scanning electron microscope, etc.) to me and have kindly shared your experience. It has been a privilege to work with you and has been a delight to experience your humorous and well-disciplined working style. I would also like to thank Selim Sülek for his friendship and contributions including the XPS measurements.
There are special people who have played a critical role in my career. They are “the wonders of my academic world”. I would like to bestow my special thanks to Prof. Haluk Külah, Prof. Ahmet Rumeli and Prof. Gönül Turhan-Sayan (Gönül Hocam, literally). You have always made me feel comfortable and welcome whenever I visited you and I asked you for advice. I have left your offices pretty much every time with a precious piece of advice and a smile on my face. I hope I will always carry the wisdom you taught me and apply it in my life.
I would like to express my deep appreciation to Prof. Haldun Özaktaş for answering my curious six men on numerous subjects varying from the academic world to the blinking stars. I truly appreciate your time and interest. I would like to thank Prof. Tayfun Akın, Prof. Abdullah Atalar, Prof. Nesim Erkip,
Prof. Özay Oral and Prof. Yusuf Ziya Özcan for generously sharing their experience, ideas and recommendations concerning my career. You have been very instrumental in my career decisions. I would like to thank Prof. Ekmel Özbay for showing how diligence and intelligence can achieve wonderful things with the opportunities in Turkey. You have been a great inspiration to me.
I would like to acknowledge the administrative and technical staff of our department, especially Ergün Hırlakoğlu and Mürüvet Parlakay.
I think there are amazing elements of doing research in a nanotechnology research center; one of them is you see how to be happy with the smallest of things. I had this opportunity and witnessed that research shows the meaning of its prefix countless times up until you reach the end and then, you truly appreciate the whole process. Confucius said “I hear and I forget; I see and I
remember; I do and I understand.” Now, I deeply understand the whole process
and see, with admiration, how with every hardship comes ease.
I owe a great many thanks to the wonderful, talented, smart, and fun people who were with me during this instructive process. Dear Fatih Bilge Atar, Fırat Yılmaz and Mustafa Yüksel, I feel privileged and honored to have worked with you. You have contributed a lot to our project with your diligence and intelligence. The joy you have brought into my everyday life (or the joy you have brought into my everyday life ) has been a powerful driving force. You have been great friends and have made up many of my best times I have had at Bilkent.
I want to extend my thanks to the past and present members of our research team including Sabri Alkış, Levent E. Aygün, Enes Battal, Temmuz Ceyhan, Furkan Çimen, Ş. Burç Eryılmaz, Mohammad Ghaffari, Abdullah Gülle, Yunus Emre Kesim, A. Cahit Köşger, Burak Mert, Efe Onaran, M.Cengiz Onbaşlı, Feyza Bozkurt-Oruç, K. Gürkan Polat, Ferhat Taşdemir, Onur Tidin, , Ahmet Turnalı, Ahmet D. Usta, Habip K. Üsküdar, Alper Yeşilyurt, T. Alper Yoğurt. Thanks to Yunus Emre Kesim for the useful discussions. Thanks to Feyza Bozkurt-Oruç for her help in the ALD and lithography processes. Thanks to
Mohammad Ghaffari for the SEM images. Thanks to all of my teammates for their pleasant friendship.
Special thanks to Alper Yeşilyurt and Aslı Ünlügedik-Yılmaz, who were my first mentors in the cleanroom and Elif Aydoğdu, who was the other. In addition, UNAM (Institute of Materials Science and Nanotechnology) researchers and staff helped me greatly. Thanks to them including Çağla Özgit-Akgün, Engin Çağatay, İnci Dönmez, Deniz Kocaay, Fikret Piri, Mustafa Kemal Ruhi, Adem Saraç and Semih Yaşar. I am grateful to all of you for your assistance and for being my precious friends.
The poem says "Come, let us be friends for once; let us make life easy on
us…” (Yunus Emre). I would like to thank my friends for making life easy on
me: Volkan Açıkel, Mehmet Eren Ahsen, Halil Akçalı, İbrahim Akçalı, Shahab Akhavan, Ahmet Emin Akosman, Deniz Aksoy, Alexandra Zehra Aksu, Sinan Alemdar, Umut Aradağ, Damla Ateş, Gökçe Osman Balkan, Gamze Baykaldı, Bayram Bütün, Seymur Cahangirov, Mustafa Rıdvan Cantaş, O. Orkun Cellek, Ahmet Fatih Cihan, Tuğrul Ç. Cinkara, Cemil C. Coşkun, Atilla Özgür Çakmak, Hümeyra Çağlayan, Neslihan Çiçek, Evrim İ. Çolak, Oğuzcan Dobrucalı, Hüseyin Duman, Burak Dura, Çağlar D. Emiroğlu, Talha Erdem, Gülesin Eren, Yavuz Nuri Ertaş, Hatice Ertuğrul,Ruslan Garifullin, Behnam Ghassemiparvin, Sayım Gökyar, Erdal Gönendik, T. Cihad Gülcü, Aşkın Güler, Mert Gülleroğlu, Kıvanç Güngör, Burak Güzeltürk, Berna Hanoğlu, Ali Nail İnal, Mehmet Kanık, Murat Kayserilioğlu, Yusuf Keleştemur, Ceyhun Kelleci, Tural Khudiyev, Veli Tayfun Kılıç, Evren Mutlugün, Sedat Nizamoğlu, M. Alican Noyan, Selim Olçum, S. Figen Öktem, Burak Özbey, Şule Öztürk, Johanna Sandberg, Emre Sarı, M. Akın Sefünç, Volkan Şirin, Orkun Tunçel, Bilal Turan, Özhan Turgut, Erdem Ulusoy, Can Uran, Kadir F. Uyanık, Okan Ünlü, Mustafa Ürel, Duygu Yalçın, Mahmut Yavuzer, M.Oğuzhan Yayla, Neval A. Cinel-Yılmaz, Murat C. Yüksek, Gülis Zengin, Taner Zorbay and many others whose names I forget to list. I would like to add this list to my ECD (electronic circuit design course) students with whom we “Enjoy ECD”. The poem goes on “… let
for being ―lovers and loved ones‖ and making my graduate experience memorable.
Thanks to Dr. Joshua T. Nevill for kindly sharing his experience at UC Berkeley and for the discussion (and coffee) at the cafe of San Francisco. Your PhD thesis has become an inspiring motivation for me and the discussions with you enlightened my research path.
I would like to acknowledge TÜBİTAK for supporting my masters study. I very much appreciate their generous support, which has been a strong driving force. Also, I would like to acknowledge the IEEE Electron Devices Society for their financial and moral support.
Finally, I would like to acknowledge my hats… There are many roles we are expected to play on the stage of life. At TEGV (Educational Volunteers), this is explained to children by wearing different colored hats on top of each other, each hat corresponds to a different role like ―citizen‖, ―daughter‖ and ―gamer‖. Looking from this perspective, I have worn quite a few hats at Bilkent, including but not limited to: ―the researcher hat‖, ―the graduate student hat‖, ―the teaching assistant hat‖, ―the assistant coordinator hat‖, ―the (recitation) instructor hat‖, ―the (undergraduate) advisor hat‖ as well as ―the goalkeeper hat‖, ―the (novice) gardener hat‖ and in general, ―the Bilkenteer hat‖. Thank you my dear hats for making my time at Bilkent so much more beneficial and enjoyable. You have been priceless opportunities for me to improve myself. I am truly grateful.
This is the end of my acknowledgements, which is, to my experience, one of the most read parts of a thesis. The following parts of this thesis will be expectedly more technical. Albert Einstein said “Everything should be made as
simple as possible, but not simpler” I have tried a lot to keep it simple and
straightforward (the kiss principle). Naturally, there are a lot of details left out since it is quite difficult to fit everything in one thesis. Nevertheless, I hope this thesis will present to you a coherent story of our biosensors and I hope that you will enjoy reading it.
To the Honeybee who knows how to thank a daisy, To the Daisy who knows how to thank a honeybee, and
Table of Contents
ACKNOWLEDGEMENTS ... XI LIST OF FIGURES ... XIX LIST OF TABLES ... XXIII
CHAPTER 1 - INTRODUCTION ... 1
1.1MOTIVATION ... 1
1.2ORGANIZATION OF THIS THESIS ... 5
CHAPTER 2 - BIOSENSORS, RELATED CONCEPTS AND PERFORMANCE METRICS ... 6
2.1INTRODUCTION ... 6
2.2BIOSENSOR RELATED CONCEPTS ... 8
2.2.1PARTS OF A BIOSENSOR ... 8
2.2.2BIOSENSOR TRANSDUCTION MECHANISMS ... 9
2.2.3SELECTIVITY AND ITS CRUCIAL ROLE IN BIOSENSING ... 10
2.3BIOSENSOR PERFORMANCE METRICS ... 11
2.4CONCLUSION ... 14
CHAPTER 3 - IMPEDIMETRIC SENSING FOR BIOSENSOR APPLICATIONS ... 15
3.1INTRODUCTION ... 15
3.2IMPEDIMETRIC SENSING CONCEPTS ... 17
3.2.1DIELECTRIC CONSTANT (RELATIVE PERMITTIVITY, ЄR): ... 18
3.2.2PARALLEL-PLATE CAPACITORS ... 21
3.2.3ELECTRICAL DOUBLE LAYER ... 24
3.3IMPEDIMETRIC SENSING IN A NANOGAP ... 27
CHAPTER 4 - NANOGAP BASED IMPEDIMETRIC BIOSENSORS 35
4.1INTRODUCTION ... 35
4.2NANOGAP FABRICATION TECHNIQUES ... 36
4.3SENSOR DESIGN ... 39
4.4SENSOR FABRICATION ... 44
4.4.1SUBSTRATE AND SURFACE PREPARATION ... 45
4.4.2FORMATION OF THE BOTTOM ELECTRODE ... 46
4.4.3COATING OF DIELECTRIC LAYERS ... 47
4.4.4PATTERNING THE UPPER ELECTRODE ... 49
4.4.5METALLIZATION AND LIFT-OFF OF THE UPPER ELECTRODE ... 50
4.4.6NANOGAP FORMATION ... 52
4.5SENSOR SURFACE FUNCTIONALIZATION AND BIOTINYLATION ... 54
4.6CONCLUSION ... 61
CHAPTER 5 - RESULTS AND DISCUSSION ... 62
5.1INTRODUCTION ... 62
5.2MEASUREMENT SETUP ... 63
5.3SENSITIVITY TESTS... 67
5.3.1SENSITIVITY TO THE TARGET PROTEIN ... 67
5.3.2SENSITIVITY TO THE DIELECTRIC CONSTANT OF THE SOLUTION 74 5.4RELIABILITY TESTS ... 81 5.4.1VERIFICATION OF STABILITY... 81 5.4.2VERIFICATION OF REPEATABILITY ... 83 5.5CONCLUSION ... 84 CHAPTER 6 - CONCLUSIONS ... 85 BIBLIOGRAPHY ... 89
List of Figures
Figure 1.1 Incidence and mortality numbers of the five major cancer diseases with highest mortality/incidence rates in 2008 (after [2]) ... 2 Figure 2.1 Canaries as one of the oldest biosensors from the 19th century [8] .... 6 Figure 2.2 Some of the commercial glucose biosensors ... 7 Figure 2.3 Parts of a biosensor [13] ... 8 Figure 2.4 Label-free and Labelled detection... 9 Figure 2.5 Dynamic ranges associated with some clinically important analytes [After 43]. ... 12 Figure 2.6 Illustration of the response time (TR) and tolerance band. Response time consists of the time period starting from the application of sample solution and ending with the output signal to reach its final value within tolerance band. ... 13 Figure 2.7 Illustration of repeatable and stable responses on a reliable sensor. . 13 Figure 3.1 Representative figure showing voltage and current signals on a sample. V0 and I0 are the magnitudes of voltage and current signals respectively and θ is the difference in phase angles of both signals ... 16 Figure 3.2 Graphical representation of the impedance on the complex plane.
Impedance is related to sample‘s resistance (R) and reactance (X). ... 17 Figure 3.3 Illustration of how dipoles in a sample media orient themselves in parallel to the applied electric field. Permittivity is a term related to this orientation phenomenon. ... 19 Figure 3.4 Parallel plate capacitor ... 21 Figure 3.5 Cross section of a parallel-plate capacitor ... 22 Figure 3.6 A hypothetical closed surface is placed to apply Gauss‘s law on parallel-plate capacitor. ... 22 Figure 3.7 Electrical double layer formed in the vicinity of a negatively charged plate ... 25
Figure 3.8 Solvation of ions in water. ... 25
Figure 3.9 Electric field intensity with respect to the distance from the electrode surface ... 28
Figure 3.10 Electric field intensity between the two electrodes in a solution .... 29
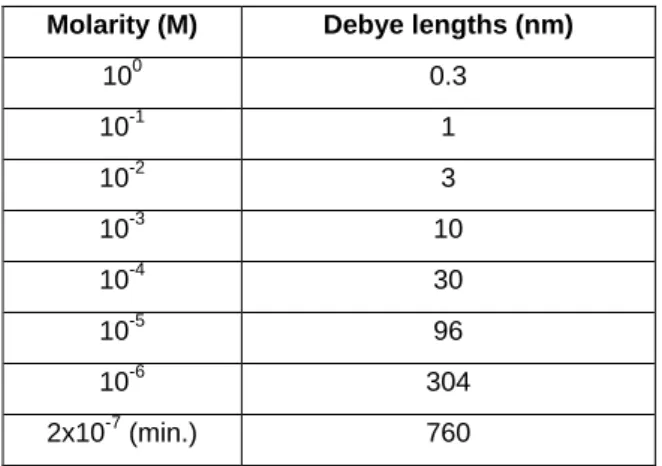
Figure 3.11 Electric field intensity with respect to distance. S denotes the ratio between Debye length and electrode separation distance. ... 30
Figure 3.12 Potential distribution within a macroscale electrode gap and nanogap ... 33
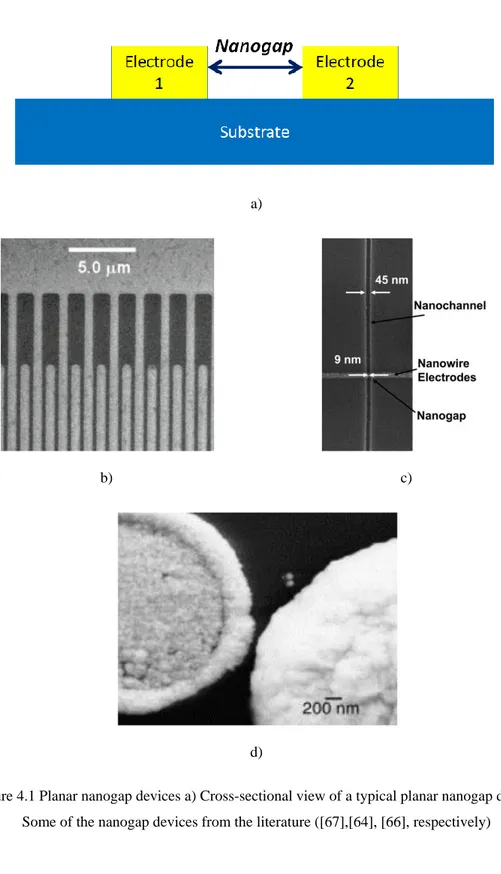
Figure 4.1 Planar nanogap devices a) Cross-sectional view of a typical planar nanogap device. Some of the nanogap devices from the literature ([67],[64], [66], respectively) ... 37
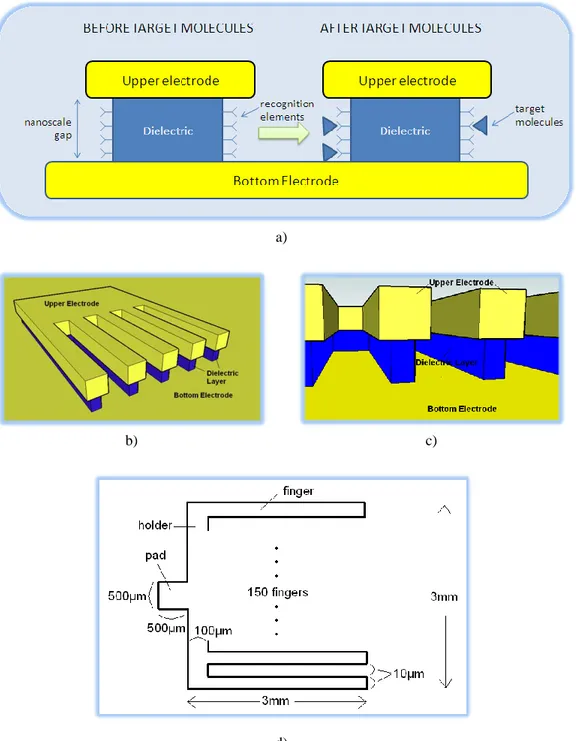
Figure 4.2 Vertical nanogap devices a) Cross-sectional view of a typical vertical nanogap device b,c,d) Some of the nanogap devices from the literature ([50], [68], [69],respectively) ... 38
Figure 4.3 Operation principles and various views of the designed sensors ... 40
Figure 4.4 Alternative sensor geometries ... 42
Figure 4.5 Equivalent circuit model for the nanogap biosensors in this work a) Nanogap is modeled with a capacitor (C1 or C2) and resistor (R1 or R2) in parallel, whereas dielectric layer is modeled with a capacitor (C3). b) A more compact equivalent circuit obtained by combining the capacitors and resistors. ... 43
Figure 4.6 Illustration of the fabrication steps and the biosensor arrays obtained at the end. More than 50 devices can be produced in a single run. ... 45
Figure 4.7 Fabrication of the bottom electrode by thermal evaporation ... 46
Figure 4.8 Fabrication of the dielectric layers. SiO2 is enhanced with a thin Al2O3 film to improve film quality in terms of current leakage. ... 49
Figure 4.9 Photolithography is used to transfer upper electrode layout on two the wafer. ... 49
Figure 4.10 Evaporation of the upper electrode ... 51
Figure 4.11 Illustration of the lift-off process ... 51
Figure 4.13 Scanning electron micrographs of the fabricated biosensors (before surface functionalization) ... 53 Figure 4.14 A scanning electron micrograph of the fabricated biosensors (before surface functionalization) ... 53 Figure 4.15 Scanning electron micrographs of a biosensor with SiO2 as the only dielectric material ... 54 Figure 4.16 Streptavidin and biotin. ... 55 Figure 4.17 APTS molecule ... 56 Figure 4.18 After the surface functionalization procedure, APTS binds to SiO2 surface thanks to its ethoxy groups ... 57 Figure 4.19 XPS results after the surface functionalization of test samples.
Presence of N is attributed to presence of APTS. (a) The sample with SiO2 surface shows peaks related to N atoms. In the figure, N1 corresponds to N-C bonds and N1scanA corresponds to C-N+. (b) No N related peak is observed on the sample with Au surface. ... 58 Figure 4.20 XPS results after the biotinylation of test samples. Presence of S atoms indicates biotin molecules. Results indicate that biotin molecules exist only on the sample with SiO2 surface as expected. ... 60 Figure 4.21 Biotin is anchored to the walls of nanogap by surface functionalization and biotinylation processes. ... 60 Figure 5.1 The picture from the dark room of UNAM cleanroom facility shows the equipments used for impedance measurements... 63 Figure 5.2 Sample on the vacuum chuck with micro-needle tips for electrical connection to the parameter analyzer. ... 64 Figure 5.3 Schematics of the parameter analyzer connections to the probe station. (adapted from [86]) ... 65 Figure 5.4 Simplified measurement circuit of the parameter analyzer (adapted from [87]) ... 65 Figure 5.5 Introduction of DI Water to the sample by a micropipette. ... 68 Figure 5.6 Capacitance (Cp) versus frequency (f) plots for different concentrations of streptavidin solution. For all concentrations, significant
changes in the capacitances are observed after streptavidin proteins are bound to the biotin molecules. ... 70 Figure 5.7 Electrical double layers and the volume displaced after the binding of target protein. ... 73 Figure 5.8 Electron micrograph image taken by focused ion beam (FIB, FEI Nova 600i Nanolab) at UNAM. FIB layers coated are only for cross-sectional (cs) imaging purposes. ... 74 Figure 5.9 Cp vs. time for different solutions at 10 kHz. ... 75 Figure 5.10 Average Cp values of Table 5.4 is plotted with respect to dielectric constant of the related solution (Experimental Data) and fitted by a line (Linear Fit). ... 76 Figure 5.11 Experimental and estimated Cp vs. єr values ... 77 Figure 5.12 Discussion on possible effects of longer undercut length with and without a different surface functionalization technique a) With the current surface functionalization procedure, increasing the undercut length does not change the volume displaced by target protein when bound to the recognition element. b) By changing the surface functionalization procedure so that recognition elements are anchored to the base and ceiling of the nanogap, it is possible to increase the volume displaced and get a more sensitive sensor. ... 79 Figure 5.13 Cp versus dielectric layer wet etching time. Measurements performed in DI water at 10 kHz after successive etch processes. ... 80 Figure 5.14 Cp vs. time is analyzed for more than 20 minutes for stability verification. DI water is used as the medium and excitation frequency is 50 kHz. ... 81 Figure 5.15 A closer view of the duration before and after the application of DI water in Figure 5.14. ... 82 Figure 5.16 Cp vs. time measurements are performed by repeating the dry-wet cycle six times to investigate repeatability performance of the sensors. .... 83 Figure 6.1 Biosensor embedded wristwatch as one of the dream products of the work in this thesis (the man is drawn by Fırat Yılmaz) ... 88
List of Tables
Table 1.1 Biomarkers associated with cancer diseases [6]... 3 Table 1.2 Some cancer biomarkers and their threshold levels in human serum [6]
... 4 Table 3.1 Fundamental equations and definitions related to the impedance ... 17 Table 3.2 Dielectric constants of the solutions, materials and biological entities used in this work. Reported values are roughly stated [47–50]. ... 20 Table 3.3 Ionic concentrations and corresponding Debye lengths for monovalent ions in water. ... 31 Table 4.1 Geometrical dimensions of designed sensor ... 41 Table 5.1 Streptavidin concentrations used in this work with their equivalences in other notations. ... 67 Table 5.2 Label-free biosensors in the literature for detecting streptavidin concentrations. Collecting data, 100 ng/mL streptavidin is taken equivalent to ~1.5 nM (see Table 5.1) ... 72 Table 5.3 Solutions used in this analysis with their dielectric constants (єr) [47]
... 75 Table 5.4 Cp (in nF) values are obtained from three sensors and averaged for sensitivity analysis. ... 76
Chapter 1
1
Introduction
1.1 Motivation
Cancer is still a major leading cause of death in today‘s world. Despite lots of research going on to find a hope, it has been reported that 7.6 million people died worldwide (approximately 13% of all deaths) because of this disease in 2008 and the annual death toll is projected to be 13.1 million in 2030 [1], [2]. Unfortunately, current technology on cancer diagnosis and treatment is far from helping millions of cancer patients [3–5]. Figure 1.1 illustrates the disappointing truth by the cancer incidence and mortality numbers of 2008. Only the five cancer diseases (pancreas, liver, lung, oesophagus and gallbladder) with the highest mortality/incidence rates are shown.
a) Cancer numbers in the world
b) Cancer numbers in Turkey
Figure 1.1 Incidence and mortality numbers of the five major cancer diseases with highest mortality/incidence rates in 2008 (after [2])
The problem lies in the strategy of this smart enemy. Cancer is defined as uncontrolled and abnormal cell growth that leads to the formation of tumor mass [4]. Even after the formation, tumor may progress in stealth mode usually without any symptoms and turning out to a fatal risk over time by spreading to the other parts of the body. This is called metastasis. After metastasis, symptoms
starts appearing, though at this stage it is very difficult to remove the millions of cancer cells from the body [4].
It is for no doubt that early detection is extremely important in the battle of the human against cancer. The determined and industrious warriors of this battle, scientists and doctors have discovered over the years of intense research that some cancer indicators in human blood called cancer biomarkers can be used in the early detection if human body is constantly monitored. Cancer biomarkers are great allies not only for the early detection of cancer; but also monitoring the progress of its treatment [4]. Some cancer biomarkers discovered so far are listed in Table 1.2.
Cancer Biomarker
Prostate PSA,PAP
Breast CA15-3, CA125, CA27.29, CEA, BRCA1, BRCA2,
MUC-1, CEA, NY-BR-1, ING-1
Leukemia Chromosomal abnormalities
Testicular
α-Fetoprotein (AFP), β-humanchorionic gonadatropin, CAGE-1, ESO-1
Ovarian CA125, AFP, hCG, p53, CEA
Bladder BAT, FDP, NMP22, HA-Hase, BLCA-4, CYFRA21-1
Colon and pancreatic CEA, CA19-9, CA24-2, p53
Lung NY-ESO-1, CEA, CA19-9, SCC, CYFRA21-1, NSE
Melanoma Tyrosinase, NY-ESO-1
Liver AFP, CEA
Gastric carcinoma CA72-4, CEA, CA19-9
Esophagus carcinoma SCC
Trophoblastic SCC, hCG
Any solid tumor Circulating tumor cells in biological fluids,
expression of targeted growth factor receptors
Table 1.1 Biomarkers associated with cancer diseases [6]
Clearly the idea of monitoring the cancer biomarker cannot be labeled ‗original‘ considering the well-known operation principles of the immune system. Nevertheless, mimicking the immune system is not as easy as it seems.
There is variety of molecular origins for biomarkers (i.e. proteins, enzymes, DNA, RNA) depending on a specific cancer and more importantly, their presence in human blood may not always be a direct indication of cancer. To illustrate, one of the biomarkers of prostate cancer is prostate specific antigen (PSA). However, its presence in human blood correlates with cancer beyond the threshold level of 4 ng/mL; below this is considered normal [4–6].
Cancer biomarker Threshold
PSA 4 ng/mL CEA 3 ng/mL NSE 12.5 µg/mL ALP ~0 SCCA 1.5 ng/mL Ferritin 250 ng/mL AFP 10 ng/mL
Table 1.2 Some cancer biomarkers and their threshold levels in human serum [6]
In conclusion, there are two headlines in the issue: Although the exact mechanism beyond the cancer and its metastasis is still unknown, early detection (before the metastasis) is promising for successful treatments. Cancer biomarkers play a key role in early cancer detection and, although not easy, it is essential to periodically monitor them in such a way that the alarm bell should not be set ringing unless their levels exceed the threshold.
In the world of electrical engineer, these words evoke the term ―sensor‖; which can be used for both detection and quantification of cancer biomarkers in the body. These sensors, more specifically called biosensors, should not necessarily be as accurate or sensitive as to replace the complex, bulky and costly equipments in the hospitals and medical laboratories; but, instead they can support them by addressing a larger mass of people, who are at the early stages of cancer without any symptoms yet. Obviously, the gold requirements are to be low-cost, fast, and small. They should be easily accessible at the home site and usable without any complex sample handling or any kind of special expertise. The sensors serving these purposes are called point-of-care (POC) biosensors.
Research is still going on developing them for early cancer detection applications. This thesis is a part of this research and hopefully be a good contribution to it. This work investigates an electrical detection platform for which a benign protein pair (streptavidin and biotin) is used as a proof-of-concept demonstration. The presented detection platform, in principle, can be tailored for a specific cancer type using the related cancer biomarker and recognition element pair.
1.2 Organization of this thesis
This thesis will continue by elaborating on biosensors, related concepts and performance metrics in Chapter 2. In Chapter 3, impedimetric sensing will be introduced as an efficient tool for developing electrical based biosensors that can be miniaturized and suited to POC applications. A crucial part of the theme underlying this thesis, utilizing nanogap concept of device fabrication in impedimetric sensing, will also be analyzed in this chapter. The fruits of this idea, nanogap based impedimetric biosensors, will be presented thoroughly in Chapter 4. Their operation principles, sensor layout, fabrication, surface functionalization and biotinylation will be the topics covered in this chapter. Chapter 5 will build upon the previous chapter and offer detailed information about the measurement setup, sensor performance results in terms of sensitivity and reliability, as well as critical discussions on these results. The final chapter will briefly summarize this work with its key achievements and the thesis will be concluded by some discussion on future directions of this work.
Chapter 2
2
Biosensors, Related Concepts and
Performance Metrics
2.1 Introduction
Biosensors are devices designed for detection or quantification of biological
components like specific proteins or DNA sequences [7]. An interesting historical note about the biosensors is that one of the oldest biosensors was a canary used by coal miners (Figure 2.1). In the 19th century, coal miners were taking a canary in a cage with them while going underground. Canaries can quickly metabolize odorless toxic gases like methane and carbon monoxide and thereby, warn the coal miners by stopping singing in the mine [8]. Though, eco-friendliness is a big concern for these sensors.
Since then, biosensor technology has advanced significantly by utilizing the outputs of various sciences like electronics, physics, biology, chemistry and material sciences. Today, they have application areas in many fields:
Environmental applications include harmful organisms‘ detection in air and
water. Food applications include monitoring food-borne pathogens in the food.
Military applications include detecting threats in a biological warfare. Health applications include the early detection of diseases and monitoring the effects of
treatments [4–9]. Among the health applications, glucose measuring sensors are perhaps the most well-known, commercialized examples. These sensors address the large market of diabetic people constituting 1-2% of world‘s population. They generally utilize electrochemical detectors with an enzyme called glucose oxidase and are used by placing a drop of blood on a test strip which has an interface with the sensor (Figure 2.2 a-b). Others can be in the form of a wristwatch and utilize reverse iontophoresis to extract glucose level over the skin tissue (Figure 2.2c). In this case, monitoring of glucose level can be done periodically like in every 10 minutes, stored in the device memory and reported as a function time at the end of the day [9], [10].
a) GlucoSure™ [11] b) OneTouch Ultra® [12] c) GlucoWatch® [10] Figure 2.2 Some of the commercial glucose biosensors
2.2 Biosensor Related Concepts
2.2.1 Parts of a biosensor
Figure 2.3 Parts of a biosensor [13]
A biosensor is composed of several parts (Figure 2.3). Target molecules in the sample can be of various biological origins like nucleic acids, proteins and bacteria. These molecules vary in size from nanometer to micrometers scale. As far as cancer detection is considered, target molecules (cancer biomarkers) are chosen such that they indicate the presence of a specific type of cancer (Table 1.2).
To recognize these target molecules, biosensor‘s sensing areas are modified with recognition elements. A range of recognition elements is used for cancer biomarker detection. Antibody molecules related to specific target molecules are widely investigated in the literature. In addition, synthetic recognition elements are also fabricated and used. These elements include synthetic peptides, aptamers and metal oxide materials[6].
As a result, recognition elements act as an interface between the target
molecules and the transducer. Transducer senses the signal coming from the
recognition elements and transfers this to the digital domain for signal processing. Finally, the processed signal is displayed at the output.
2.2.2 Biosensor transduction mechanisms
Transduction can be realized via numerous mechanisms including light based [6], [14–17], magnetoresistance based [18–22] and electrical based [23–29] detection. Among these mechanisms, electrical based detection outshines as a strong candidate for point-of-care health applications since it offers simplicity, chip-integrability; and, moreover it is quite inclined to low-cost, low-power platforms [7]. In this work, electrical based detection is used for transduction.
Figure 2.4 Label-free and Labelled detection
An important distinction in biosensor transduction is having labelled or label-free detection mechanism (Figure 2.4). Labelled biosensors require target molecules to be labelled. In these sensors, the output of the transducer corresponds to the amount of label and this is assumed to give the number of bound targets. Anything allowing convenient detection like magnetic beads [30], fluorophores [31] or enzymes [32] can be used as a label. Labelled biosensors are frequently used in immunoassay technologies. Enzyme-linked immunosorbent assay (ELISA) sensor is one of the oldest examples [33]. Unfortunately, these sensors generally require an expert for sample handling and an additional time for labelling process. Besides, labelling process may decrease target molecules‘ affinity to immobilized probes and this is problematic especially in low concentration detection [7], [34]. All of these issues as well as the higher cost of labelled sensors make label-free biosensors rather attractive
for cancer monitoring applications. Label-free biosensors are able to detect the target directly in a sample with no or very little sample preparation.
As a result, labelled detection based biosensors are not much suitable for point-of-care health monitoring applications due to sample handling, time and cost issues; whereas label-free biosensors, allowing simpler, faster and low-cost detection, are more prone to this kind of applications [7]. In this work, label-free biosensing is studied.
2.2.3 Selectivity and its crucial role in biosensing
Selectivity, sometimes termed specificity, is the ability of specifically
responding of the sensor to the target analyte. It is one of the biggest challenges in all label-free sensors. If the active surface of the sensor is not developed to ensure higher specific than non-specific binding, the output signal would carry uncertainty and this would result in poor biosensing performance. To illustrate, blood serum typically contains ca. 70 mg/mL total protein content. For the case of prostate cancer, prostate specific antigen (PSA) to be detected in blood serum is several ng/mL, that is ―detecting 1 in 10,000‖ [35], [36]. This contrast is terrifying; but, fortunately, there are a number of strategies developed to find the needle in the haystack. Non-specific binding which results from the adhesion of undesired molecules to the active biosensing area, can be prevented by coating
blocking agents around the active biosensing area. These agents can adsorb the
molecules that would nonspecifically bind to the sensing area [selectivity folder]. Bovine serum antigen (BSA) and salmon serum DNA are well-known examples in the literature. Another strategy is purifying the human blood from interfering proteins. However, for point-of-care applications, this is only meaningful if purification can be completed in a simple setting at patient site.
Micro-total analysis systems (µTAS, or lab-on-a-chip (LoC)) technology is
promising for this purpose [37–39]. They can allow the non-expert to do complex analyses by miniaturizing the laboratory tools on a chip. Finally, non-specificity can be circumvented to a certain extent by a ―rinse‖ step before
taking measurement and such a ―rinse‖ step would remove the nonspecifically bound molecules, leaving specifically bound ones, which are typically so strongly bound that such a rinse does not reverse them [40], [41].
2.3 Biosensor Performance Metrics
Performance metrics that will be analyzed in this work are mainly sensitivity, dynamic range, upper and lower limits of detection, reliability, stability, response time and repeatability. They will be defined in this section and used frequently in Chapter 5 while the results are discussed.
Sensitivity can be defined in two ways: [42]
When target molecule sensing is considered, it is defined as the minimum detectable change in the response of the sensor per the associated change in the analyte concentration. Sensitivity depends on various factors like the affinity and selectivity of binding process, transduction mechanism and amplification and noise of the readout circuitry. Either of these can limit the overall sensitivity. Dynamic range includes the concentrations for which the target molecule can be detected. Dynamic range of a sensor defines the variety of applications that a sensor can be used (Figure 2.5). For example, whereas the range required for metabolites is in µmol/L and mmol/L, for viral or tumor antigens like PSA this is in the order of pmol/L. Dynamic range is bounded by
upper and lower limit of detections. Both of these limits depend on the sensor as
well as the specific target and recognition molecules of interest. For example, a commercial enzyme-linked immunosorbent assay (ELISA) sensor exhibits different dynamic ranges depending on the targets used [33].
Another and more general definition of sensitivity is the change in the output signal with respect to a unit change in the input parameter. Mathematically, this equals to the slope of the output characteristic curve. This definition will be used while analyzing the sensitivity of produced biosensors with respect to dielectric constant of the solution.
Figure 2.5 Dynamic ranges associated with some clinically important analytes [After 43].
Sensitivity in biosensors can be limited by either the binding of the desired target molecule to the surface or the transduction mechanism for detecting this binding [7]. In this work, the focus is on the demonstration of nanogap based impedimetric detection as a transduction mechanism and thus, streptavidin-biotin pair (instead of a specific cancer related pair) is used for the proof-of-concept.
Reliability is defined as the sensor‘s ability to produce consistent results with
respect to time. For commercialization purposes, reliability is at least as important as sensitivity. However, unfortunately, it is generally not reported in the biosensor studies in the literature [7]. Reliability has two aspects: stability and repeatability.
Stability is settling to a constant response after the sample solution is
introduced. Biosensors do not change output state immediately after the sample solution is applied due to delays related to the transduction mechanism.
Response time is the time required for the output response to reach its final value
within the tolerance band. It is simply illustrated in Figure 2.6.
Figure 2.6 Illustration of the response time (TR) and tolerance band. Response time consists of the time period starting from the application of sample solution and ending with the output
signal to reach its final value within tolerance band.
Repeatability is providing same output response when same measurements
are performed repeatedly.
Verification of the reliability can be done by observing the output signal while successive target application and removal steps are conducted. This is illustrated on a figurative output signal versus time plot in Figure 2.7.
2.4 Conclusion
Biosensor technology utilizes many academic disciplines and addresses to a variety of sectors. Health industry is one of them. Label-free and electrical based biosensors are promising for point-of-care health applications. Selectivity is an important concern which should be satisfied by simple methods that can be implemented at patient‘s site rather than complex clinical settings and without any special expertise. Performance metrics define the application areas of a biosensor. For a biosensor to be utilized in early cancer detection, sensitivity metrics associated with the specific biomarker of the targeted cancer should be satisfied. As for all sensors, reliability is an essential performance metric for point-of-care biosensors and it should definitely be demanded from any candidate.
Chapter 3
3
Impedimetric Sensing for Biosensor
Applications
3.1 Introduction
Impedimetric (impedance based) sensing is an electrical based technique for
characterizing systems of interest. It offers advantages like label-free, low cost, low power requirement, miniaturizable, and chip-integrable detection platforms, which are extremely appealing for point-of-care applications. This chapter starts by introduction of this efficient technique and continues with explanation of the concepts related to it. Unfortunately, impedimetric sensing in ionic solutions is hampered by a charge layer called electric double layer. The rest of the chapter handles this problem and offers nanogap based biosensors as an effective solution.
Impedimetric sensing deals with impedimetric response of samples. Response depends on sample‘s permittivity and resistivity and thereby, gives insight about sample. Impedance (Z) is a measure of how a sample responds to an applied sinusoidal (AC) voltage and it is a function of the frequency of the AC voltage.
If an AC voltage is applied to a sample media with linear constituents, a current signal is sustained through it. Impedance can be calculated by using these voltage and current signals.
Figure 3.1 Representative figure showing voltage and current signals on a sample. V0 and I0 are
the magnitudes of voltage and current signals respectively and θ is the difference in phase angles of both signals
Amplitudes V0, I0 of the signals as well as the phase difference θ can be obtained and related to sample‘s impedance by the relation
(3.1) Impedance is a complex quantity defined as the ratio of voltage phasor V to current phasor I of the sample.
It can be better visualized on the complex plane.
Figure 3.2 Graphical representation of the impedance on the complex plane. Impedance is related to sample‘s resistance (R) and reactance (X).
Once impedance is obtained, it can be converted to the other fundamental electrical notions as shown in Table 3.1.
Z, Impedance R, Resistance X, Reactance , Phase Angle Y, Admittance G, Conductance B, Susceptance
Table 3.1 Fundamental equations and definitions related to the impedance
3.2 Impedimetric Sensing Concepts
Three fundamental concepts of impedimetric sensing in this work are dielectric constant, parallel plate capacitor and electrical double layer; these concepts will be introduced in this section.
3.2.1 Dielectric Constant (Relative Permittivity, єr):
Dielectric constant (єr) is used as equivalent to the more general term relative permittivity. Thus, the method preferred in this part is to define permittivity first, and then, state its relation to dielectric constant.
Fundamental law of electrostatics, stated by French scientist Charles-Augustin de Coulomb in 1787, describes the electrostatic interaction between two electrically charged particles [44].
(3.3) In this law (known as Coulomb‘s law) F is the force acting on point charges
q1 and q2, r is the separation distance, and k is the proportionality constant. Force F created by a point charge q on a unit charge of distance r is defined as the electric field (E). Thus, Coulomb‘s law can also be stated as
(3.4)
k, the proportionality constant, depends on the medium. In free space, k is
, which is also known as Coulomb‘s constant and approximately equal to
8.9876 109 N m2 C-2. є0 is called permittivity of free space and in a dielectric, it is multiplied by the relative permittivity of the dielectric (єr).
The origin of permittivity belongs to dipoles in a dielectric. Although a molecule in a dielectric is macroscopically neutral, small displacements in its positive and negative charges results when an external electric field is applied and so, it becomes a dipole. This kind of molecules which behave like a dipole in the presence of an electric field is called nonpolar molecules. On the other hand, some molecules like H2O, can exhibit the polarization effect even without any electric field due to structural formation of their atoms. These are called polar molecules [45].
In a dielectric material, no polarization effect is observed even if the polar molecules exist. This is because these molecules are randomly oriented, and macroscopically, their effects are cancelled on the average. When an electric field is applied, however, dipoles experience a force and randomness in their alignments disappears since all tend to align in parallel to the external field (Figure 3.3).
Figure 3.3 Illustration of how dipoles in a sample media orient themselves in parallel to the applied electric field. Permittivity is a term related to this orientation phenomenon.
This is known as dielectric polarization and its resultant effect can be observed in macroscopic scale as a new electric field opposing the applied
electric field. This explains the inverse proportionality between the permittivity
є and proportionality constant k.
Permittivity is a function of the applied frequency of excitation. This is because as the field intensity and direction change, dipoles will try to follow the electric field by reorienting themselves accordingly. Since the response of matter is not instantaneous, as the frequency increases, dipoles start to be less successful in the pursuit of applied electric field and there will be a frequency beyond which the material cannot respond as quickly as the excitation frequency of the signal and permittivity starts decreasing. Since this is at very high frequencies (such as around 2.5 GHz for water molecules [46]) with respect to the frequency range of 1 kHz – 100 kHz considered in this work, relative permittivity of the materials involved are assumed constant within the low frequency (1 kHz – 100 kHz) range. Relative permittivity of a dielectric is frequently called dielectric constant at low frequencies, so the term dielectric constant will be used throughout this thesis.
Name Dielectric constant (єr) Deionized water 80 Methanol 33 Isopropanol 18 Al2O3 (ALD) 8 SiO2 (PECVD) 5 Biotin 2 Streptavidin 2 Air 1
Table 3.2 Dielectric constants of the solutions, materials and biological entities used in this work. Reported values are roughly stated [47–50].
3.2.2 Parallel-Plate Capacitors
Capacitance is charge-storing ability of a system and capacitor is the name
of the element used for this purpose. Capacitance (C) of a capacitor is defined as the amount of charge stored (Q) per unit voltage applied to it (V).
(3.5)
which is informally called the ice-cream formula ( ).
One of the most commonly used capacitors is parallel-plate capacitor. It is not only useful as a discrete device in electric circuits; but more importantly, it is an essential part of modeling various capacitance-based phenomena. The concept can be utilized in anywhere (semiconductors, photodetectors or biosensors) where two planes of charges in parallel are considered.
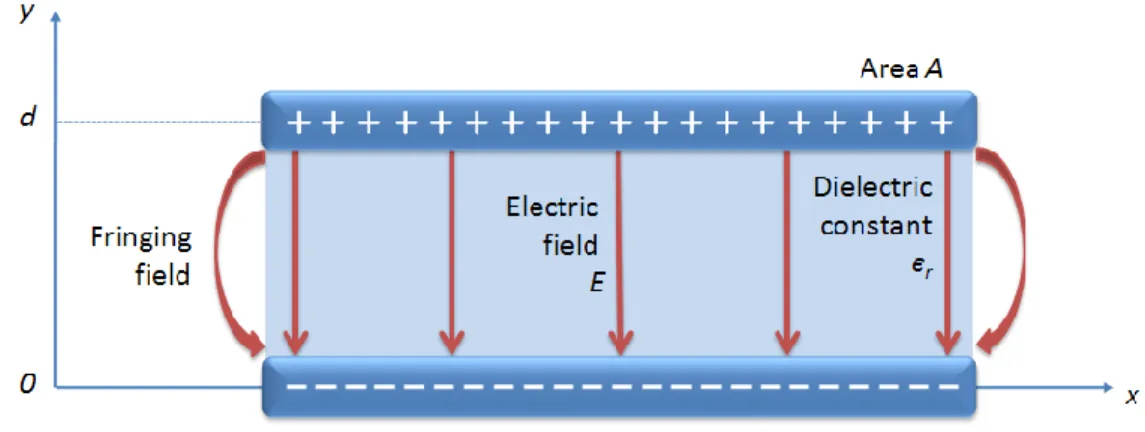
In this capacitor, two conductor parallel plates of area A are separated by a uniform distance d. The space between the plates is filled with a material of dielectric constant єr (Figure 3.4)
Figure 3.5 Cross section of a parallel-plate capacitor
Electric field is created when voltage is applied to the electrodes (Figure 3.5). Fringing fields at the edges of the plates can be neglected if the distance d is sufficiently small when compared to dimensions of the plates [51]. Then, the electric field is confined to the space where dielectric material is filled and it can be found by utilizing Gauss‘s law [52]
(3.6) This is a closed surface integral asserting that total outward flux of the E-field over any closed surface is equal to total charge Q enclosed in that surface divided by the material permittivity є. To get the electric field between the two plates, a hypothetical closed surface is placed as shown in Figure 3.6.
Figure 3.6 A hypothetical closed surface is placed to apply Gauss‘s law on parallel-plate capacitor.
When equation 3.6 is applied on the six faces of the rectangular box, it is seen that the electric field lines are parallel to the side faces of the box (Figure 3.6) and thus, is zero on those surfaces. Similarly, the bottom face has zero contribution since no electric field exists in that region. Consequently, only the top face contributes to the left part of equation 3.6, and since electric field is perpendicular to the top face and uniform over it, left part of equation 3.6 turns out to a multiplication
(3.7) where is the surface area of the top face and is the charge enclosed in the hypothetical box. can be expressed in terms of the total charge on the plate as
(3.8) Combining equation 3.7 and 3.8, electric field magnitude is obtained to be
(3.9) Electric field does not depend on the height of the box as far as the top face is in between the plates. Thus, electric field is constant within the dielectric medium. This is used in calculation of the voltage (V) between the capacitor plates (Figure 3.5) as
(3.10) Combining this with equation 3.9,
Finally, using equation 3.5 and 3.11, capacitance of a parallel-plate capacitor can be obtained as
(3.12) This is a very useful formula, used in capacitance estimation of various phenomena where two conductive layers exist in parallel. However, care must be taken when d gets close to the dimensions of the plates so that fringing fields cannot be neglected.
3.2.3 Electrical Double Layer
Looking at the discussion on parallel plate capacitors in the previous section, it can be expected that when two plates of area A and separation distance d are placed in a dielectric liquid solution with dielectric constant єr, the resultant capacitance will be equal to equation 3.12. However, in general there is more to it than this simplified view.
This is due to two layers of ions accumulated in the close vicinity of the plates: When an electric field is applied, ions in the liquid react to this and move towards oppositely polarized plates. Thereby, a layer of mobile charges is formed in the liquid near each plate and it is called diffuse layer [46].
Figure 3.7 illustrates the neighborhood of a negatively charged plate, where diffuse layer is formed by accumulation of positive ions solvated in water. ‗Solvated ions‘ refer to those surrounded with water (solvent) molecules.
Figure 3.7 Electrical double layer formed in the vicinity of a negatively charged plate
Water, a polar molecule, first orients itself such that its negatively charged portion is closer to a positive ion and then attaches to it forming a complex (opposite for a negative ion). This is the mechanism behind the dissolution of ions (easily) in a polar solvent like water [53].
In addition to solvated ions, there is also a layer of unsolvated ions on the negatively charged plate as shown in Figure 3.7. These are immobile ions directly adsorbed to the surface. Adsorption, similar to surface tension, is a consequence of surface energy. Simply stated, unlike the metal atoms in the bulk of the plate, the metal atoms at the surface are not wholly surrounded by other metal atoms and thus, can attract atoms in the liquid solution. The exact nature of this attraction is beyond the scope of this work; however, the consequence of it is a layer of immobile ions immediately adjacent to the surface. This layer is called Stern layer, after Otto Stern who contributed to its theory.
To summarize the explanations so far, when two metal plates are immersed in a liquid solution and a voltage is applied to them, ions in the solution start to accumulate near the plates. They are solvated, mobile ions forming the diffuse layer. In addition to this, there is a layer of immobile ions on the plates forming the Stern layer. Two layers together are called electrical double layer, which is the secret behind the surplus in the capacitance of a parallel plate capacitor immersed in a solution.
The reason of the surplus can be understood by assuming the electrical double layers as separate plates immersed in the solution and placed very closely to the present plates. They essentially decrease the separation distance d in equation 3.12 and as a result, the capacitance increases. Since the separation distance resulted from electrical double layer is in the order of nanometers, huge capacitance values can be obtained using this idea as in the case of super capacitors (also known as ultracapacitor, or electrical double layer capacitor) [54]. These are commercially available products going up to several 1000 Farads and can be used in various sectors like in uninterruptible power supplies [55] or in electrical cars [56]. However, electrical double layer is not always a desirable thing as will be shown in the next section.
3.3 Impedimetric Sensing in a Nanogap
One of the protagonists in this thesis is nanogap. It refers to the gap formed between the two electrodes with the separation distance of the order of nanometers. At the beginning of this chapter, impedimetric sensing is introduced as a label-free, low-cost, low power requirement, miniaturizable, chip-integrable, electrical based detection technique such that it can be applied to point-of-care biosensor applications. However, in applications working with liquid-based samples (like human blood), the problem of electrical double layer arises. This problem with its possible solution based on nanogap will be discussed in this section.
Electrical double layer is a complex phenomenon; however, thanks to research efforts for more than a century on it, several models are developed explaining its formation and macroscopic effects [57–59]. The model deployed in this work is Gouy-Chapman model. This model assumes the ions behaving as point charges and employs the Poisson-Boltzmann equation to predict potential distribution in the solution. It does not take into account the finite size of the ions; neither does it consider the fact that permittivity of water decreases around the solvated ions since the water molecules surrounding the ions cannot respond freely to the applied electric field anymore. Some more drawbacks leading to imperfections such as neglecting the effect of Stern layer may be considered for this model. Nevertheless, this model provides relatively good predictions for solutions with ionic strengths less than 0.2 M and for applied electrical voltages below 50-80 mV [60]. Thus, it is sufficient for this work where ionic strength is in the order of 10-7 M and applied rms voltage is 10 mV.
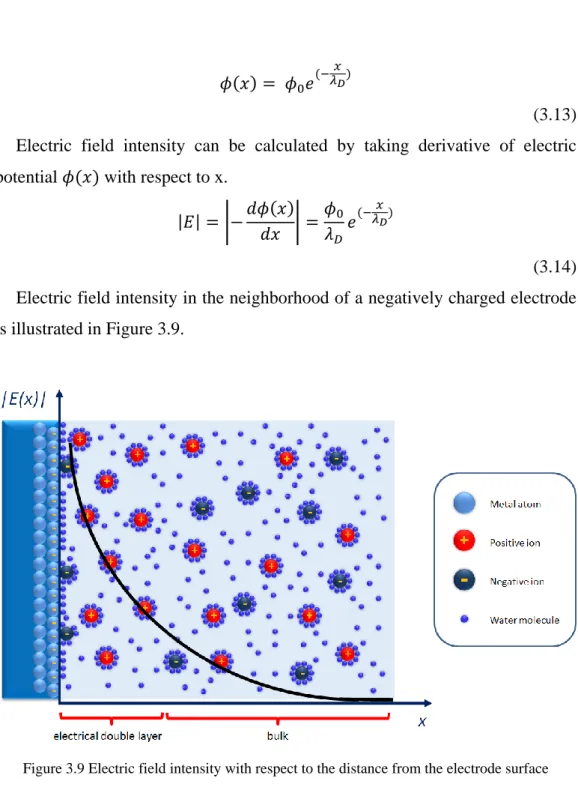
For the simple case of sufficiently large planar electrode surface, the potential cannot change in directions parallel to it because of the symmetry. Using this information, one dimensional solution of the electric potential with respect to distance from the electrode surface can be obtained by Gouy-Chapman model as [60]
(3.13) Electric field intensity can be calculated by taking derivative of electric potential with respect to x.
(3.14) Electric field intensity in the neighborhood of a negatively charged electrode is illustrated in Figure 3.9.
Figure 3.9 Electric field intensity with respect to the distance from the electrode surface
Electric field decays exponentially with increasing distances from the electrode (equation 3.14). The decaying constant is called Debye length. The effect of ionic concentration on it will be discussed in the following pages. For now, it is necessary to observe that within five Debye lengths from the electrode, the electric field almost vanishes (becomes less than 1% of ) in the
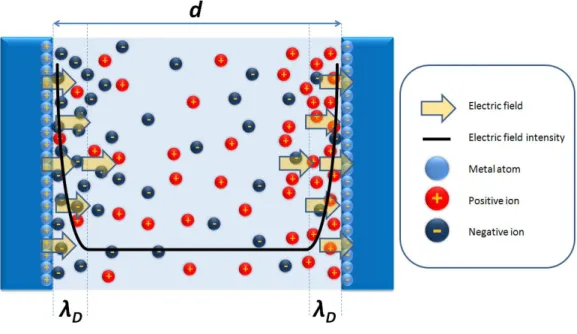
In essence, electrical double layer acts as a shield against the applied electrical field. This causes a major problem for the biosensor applications since the electric field applied by the electrodes does not appear on the significant portion of the target medium as shown in Figure 3.10.
Figure 3.10 Electric field intensity between the two electrodes in a solution
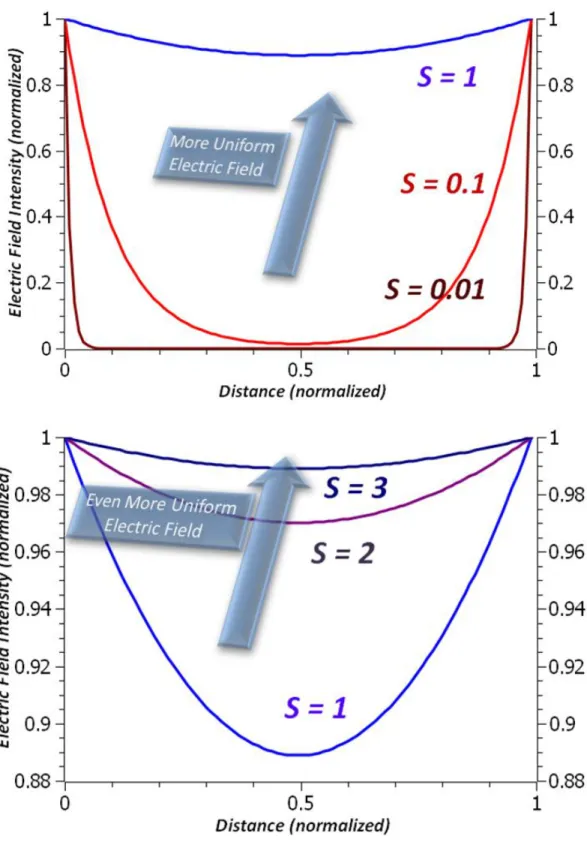
There are two ways of dealing with this problem, which are increasing the Debye length and decreasing the electrode separation distance d. For simplicity, these two are combined in a single dimensionless parameter
(3.15) Using equation 3.14, electric field intensity can be obtained for the single electrode. Since it will be similar (symmetric with respect to the midpoint of the electrodes) for the other electrode and since electric fields related to both electrodes are superimposable due to the linearity of the system at low voltages, total electric field in the solution can be obtained. It is plotted for different S parameters in Figure 3.11.
Figure 3.11 Electric field intensity with respect to distance. S denotes the ratio between Debye length and electrode separation distance.
![Figure 1.1 Incidence and mortality numbers of the five major cancer diseases with highest mortality/incidence rates in 2008 (after [2])](https://thumb-eu.123doks.com/thumbv2/9libnet/5896659.121956/26.893.201.754.197.876/figure-incidence-mortality-numbers-diseases-highest-mortality-incidence.webp)
![Figure 2.1 Canaries as one of the oldest biosensors from the 19 th century [8]](https://thumb-eu.123doks.com/thumbv2/9libnet/5896659.121956/30.893.346.611.868.1094/figure-canaries-oldest-biosensors-th-century.webp)
![Figure 2.5 Dynamic ranges associated with some clinically important analytes [After 43]](https://thumb-eu.123doks.com/thumbv2/9libnet/5896659.121956/36.893.192.769.197.586/figure-dynamic-ranges-associated-clinically-important-analytes.webp)