MICROFLUIDIC BASED
DIFFERENTIAL ELECTROCHEMICAL
SENSORS
A THESIS
SUBMITTED TO THE DEPARTMENT OF PHYSICS
AND THE GRADUATE SCHOOL OF ENGINEERING AND SCIENCE OF BILKENT UNIVERSITY
IN PARTIAL FULFILLMENT OF THE REQUIREMENTS FOR THE DEGREE OF
MASTER OF SCIENCE
By Özge Akay January, 2013
ii
I certify that I have read this thesis and that in my opinion it is fully adequate, in scope and in quality, as a dissertation for the degree of Master of Science.
.
Asst.Prof. Dr. Coşkun Kocabaş
I certify that I have read this thesis and that in my opinion it is fully adequate, in scope and in quality, as a dissertation for the degree of Master of Science.
.
Prof. Dr. Atilla Aydınlı
I certify that I have read this thesis and that in my opinion it is fully adequate, in scope and in quality, as a dissertation for the degree of Master of Science.
.
Asst. Prof. Dr. Emrah Özensoy
Approved for the Institute of Engineering and Science:
.
iii
ABSTRACT
A MICROFLUIDIC BASED DIFFERENTIAL ELECTROCHEMICAL SENSOR Özge Akay
M.S. in Physics
Supervisor: Asst. Prof. Dr. Coşkun Kocabaş January, 2013
Lab-on-a-chip systems aim to integrate analytical techniques on a single chip to achieve high-throughput measurements with little reagent. Microfluidic devices use the advantage of fluid dynamics in microscale to generate new physical phenomena which are less familiar in macroscale. Laminar flow is one of these emergent phenomena in microscale dimensions. Fluids flowing in a microchannel with low Reynolds number (Re), have small inertial effects which suppress the turbulent mixing. Ability to control liquids without turbulent mixing provides new tools for integration of analytical techniques on a single chip. In this work we present a new type of electrochemical device based on hydrodynamic modulation in a microfluidic channel. The presented microfluidic device is a kind of hydrodynamic modulation voltammetry (µ-HMV) that uses a periodic modulation of two laminar streams of buffer and analyte solutions in a micro channel. The periodic modulation of the laminar flow generates periodic variation of mass transport to the electrode surface. The generated periodic electrochemical current is detected by a phase-sensitive detector. The differential electrochemical sensor eliminates charging and other transient background current and provides high sensitivity with a detection limit of 10 nM. This technique provides a convenient hydrodynamic electrochemical detection with a relatively simple and compact instrument which does not require any moving mechanical parts.
iv
Keywords: Microfluidics ,Laminar flow ,voltammetry ,Reynolds number ,phase
v
ÖZET
MİKROAKIŞKAN TABANLI DİFERANSİYEL ELEKTROKİMYASAL SENSOR Özge Akay
Fizik Yüksek Lisansı
Tez Yöneticisi: Yard. Doç. Coşkun Kocabaş Ocak, 2013
Lab-on-a-chip sistemlerin amacı, küçük reaktif(tepki daha doğru gibi geldi burda ) ile yüksek verimlilik ölçümleri elde etmek için analitik teknikleri tek bir yonga üzerinde birleştirmektir. Mikroakışkan cihazlar makro ölçekte daha az bilinen yeni fiziksel olayları oluşturan mikro ölçekteki sıvı dinamiğinin avantajını kullanır. Tabakalı akış bu mikro ölçekli boyutta çıkan yeni olaylardan birisidir. Düşük Reynolds sayısı (Re) ile bir mikro kanal içinde akan sıvılar, türbülans karışımını bastıran küçük durağan (inertial) etkilere sahiptir. Türbülans olmadan sıvıları kontrol etme yeteneği, analitik tekniklerin tek bir yonga üzerinde entegrasyonu ile oluşan yeni araçlar sağlar. Biz bu çalışma da bir mikroakışkan kanal içinde hidrodinamik modülasyona dayalı yeni bir elektrokimyasal cihaz sunuyoruz. Bu sunulan mikroakışkan cihaz, bir mikro kanal içinde iki laminar akış olan analit ve bufferın periyodik modülasyonunu kullanan, mikroakışkan tabanlı hidrodinamik modülasyonu voltametre(μ-HMV) türüdür. Tabakalı akışın periyodik modülasyonu, elektrot yüzeyinde toplu taşımayı periyodik olarak değiştirir.. Oluşturulan periyodik elektrokimyasal akım, faz-duyarlı detektör tarafından tespit edilir. Diferansiyel elektrokimyasal sensor yükleme ve diğer geçici arka plan akımı ortadan kaldırır ve 10 nM bir algılama sınırı ile yüksek hassasiyet sağlar. Bu teknik, herhangi bir hareketli mekanik parça gerektirmeden nispeten basit ve kompakt cihaz ile uygun hidrodinamik elektrokimyasal algılama sağlar.
vi
Anahtar sözcükler:Mikroakışkan sistemler, Tabakalı akış, Voltametre,faz duyarlı
vii
Acknowledgements
I would like to express my sincere gratitude to Assoc. Prof. Dr. Coşkun Kocabaş for his continuous guidance, encouragement, support, advice and supervision throughout this study.
I would like thank to Prof. Dr. Atilla Aydınlı and Asst. Prof. Dr. Emrah Özensoy for their judgments and helpful critics as the Master’s Thesis committee.
I would like to express my deepest appreciation to my family for their love, support and faith in me.
I would like to my best friend Simge Ateş. She has always encouraged me to keep on, no matter what problem was. Her presence helped me to cope with difficulties here and METU.
I would like to thank Kocabaş group for their supports and friendship during hard times of M.S. programme.
This work was granted by Turkish Scientific and Technical Research Council (TUBITAK), grant no: 110T304.
viii
Contents
ABSTRACT ... iii ÖZET ... v Acknowledgements ... vii Contents... viii List of Tables ... x List of Figures ... xi 1. Introduction ... 2 2. Physics of fluids ... 52.1 Dimensionless Numbers in Microfluidics... 5
2.1.1 The Reynolds number ... 6
2.1.2 The Péclet Number ... 9
3. Electrochemistry and Electroanalytical Methods ... 12
3.1 Electrochemical cell ... . .……. 13
3.2 Faradic and Non-Faradic Currents ... 16
3.3 Mass transport ... 17
3.4 Electrochemical analysis methods ... 18
3.5 Voltammetry ... 18
3.6 Linear sweep and cyclic voltammetry ... 19
3.7 Hydrodynamic modulation voltammetry ... 21
4. Fabrication of Electrochemical Cell ... 22
4.1. Molding of Microfluidic channels from PDMS ... 22
4.1.1 Fabrication of the mold ... 22
ix
4.2. Fabrication of Electrodes ... 25
4.3. Sealing of PDMS Channel and Electrodes... 27
4.4. Voltammetry ... 27
4.5. Phase sensitive detection: Lock-In Amplifier ... 30
4.6. Electrochemical reactions ... 33
5. Microfluidic Hydrodynamic Voltammetry ... 34
6. Conclusion ... 43
x
List of Tables
Table 2.1 Dimensionless numbers used to characterize fluid flow. ... 11 Table 4.1 RIE condition for oxygen plasma ... 27
xi
List of Figures
Figure 2.1 Inertial forces exerted by accelerating fluid elements in two different microchannel. Changing the direction of a fluid element (a), Or accelerating on element (b) brings inertial forces onto microfluidic channels. ... 8 Figure 2.2 The flow profile for a T- junction channel. The graded region is the
diffusion zone. ... 10 Figure 3.1An example of a simple electrochemical cell ... 15 Figure 3.2 Electrode double layer at positive potential near an electrode surface. .... 17 Figure 3.3 Schematic diagram of a voltammetry ... 19 Figure 3.4 Graphs of potential as a function of time (a) linear sweep voltammetry, (b)
for cyclic voltammetry. ... 20 Figure 4.1 Schematic drawing of molding microfluidic channels from PDMS,
a)photoresist ( SU-8) coating ,b) photolithography, c) casting PDMS, d) molding PDMS. ... 24 Figure 4.2 Transparent mask used for UV-photolithography ... 25 Figure 4.3 The schematic drawing of fabrication of electrodes, a) photoresist
(AZ5214E) coating , b) photolithography, c) metallization (Ti/Au, 6/100 nm), d) gold electrodes. ... 26 Figure 4.4 The circuit diagram of the electrochemical cell integrated with a
voltammetry and a phase sensitive detector. ... 28 figure 4.5 An image of the data acquisition program for electrochemical sensor written
using labVIEW (a) front panel, (b) block panel ... 29 Figure 4.6 Schematic representation of lock-in amplifier ... 30 Figure 4.7 A representative frequency response of low pass filter ... 32 Figure 5.1 Schematic representation of the fabricated microfluidic device to measure differential electrochemical current. Three gold thin film electrodes (working, counter and reference electrodes) were fabricated on a glass slide. The Y-junction microfluidic channel sealed on the glass slide has two inlets named as A and B.
xii
The buffer solution is injected to the inlet A and the analyte injected to the inlet B. A solenoid valve is used to control the pressure of the buffer. The pressure of inlet A oscillates between P1 and P2 at a frequency of 3Hz. The pressure of inlet B is kept at P3. The alternating electrochemical current on the working electrode is detected with a lock-in amplifier operating at current detection mode. The voltage of counter and reference electrodes are controlled by a homemade potentiostat.35 Figure 5.2 (a) An image of the fabricated microfluidic device. The three thin film
electrodes are registered to the Y-junction microchannel. The area of counter electrode is chosen to cover the entire microchannel to increase electron transfer. The wires are connected to the chip with a conductive epoxy. (b) The flow profile of in a Y-junction microchannel. Two fluids are introduced from channels A and B. The upper and lower channels have rate of flow of Q1 and Q2. The fractional filling of the channel downstream of the junction area is w1 and w2 which are linear functions of Q1 and Q2. ... 37 Figure 5.3 (a.b) Schematic drawing of the working principle of the device. As the
pressure of the buffer changes, the microchannel is periodically filled by the buffer and analyte. The periodic change of flow of the buffer stream generate periodic modulation of the mass transport to the working electrode resulting in a periodic electrochemical current. (c) Time trace of the mass transport limited electrochemical current generated by the oxidation of (Fe(CN) 6 )+4 while the
working electrode is held at +1V. Here 0.1 M LiClO4 acts as supporting
electrolyte. (d) The time decay of the electrochemical current after switching the buffer solution. The response time of the system is around 100 msec. ... 38 Figure 5.4 (a) Steady-state voltammograms for oxidation of 320 nM ferrocyanide in
0.1 M LiClO4 buffer recorded at a scan rate of 0.01Vs-1 for several values of hydrodynamic modulation frequencies. (b) Dependence of current amplitude upon frequency of modulation. The rate of flow is 290 µL/min. (c) Power spectrum of the electrochemical current with a hydrodynamic modulation frequency of 3Hz.
xiii
The power spectrum is recorded by changing the internal frequency of the lock-in amplifier while keeping the modulation frequency constant at 3Hz. ... 40 Figure 5.5 (a) Steady state voltammograms for low concentration of ferrocyanide in
0.1 M LiClO4 buffer. (b) The measured maximum electrochemical current as a
1
2
CHAPTER 1
1.
Introduction
Lab-on-a-chip systems aim to integrate analytical techniques on a single chip to achieve high-throughput measurements with little reagent. Microfluidic devices use the advantage of fluid dynamics in microscale to generate new physical phenomena which are less familiar in macroscale. Laminar flow is one of these emergent phenomena in microscale dimensions. Fluids flowing in a microchannel with low Reynolds number (Re), have small inertial effects which suppress the turbulent mixing[1][1]. Ability to control liquids without turbulent mixing provides new tools for integration of analytical techniques on a single chip[2]. Hydrodynamic modulation voltammetry (HMV) uses modulated convection to increase the mass transport to the working electrode[3]. The primary aim of HMV is to increase the detection sensitivity and potential window of voltametric measurements under well-defined transport conditions. A periodic modulation of mass transport either varying the rate of flow over the electrode or moving the electrode itself, generates alternating electrochemical current[4]. This alternating current is immune of background signal generated by non-Faradaic effects[5]. Many types of modulation techniques have been implemented for HMV. Stopped flow [6, 7], chopped flow [8], oscillating jet [9] and ultrasonic modulation [10] are examples for varying rate of flow type HMV, on the other hand rotating [11, 12] and vibrating electrodes [13, 14] are good examples for moving electrode type HMV. A detailed comparative analysis of these techniques can be found in [6-14]. The main drawback of flow modulation methods is the relatively low mass transport rate and low modulation frequency (<1Hz), whereas the electrode motion
3
modulation techniques are limited by the inertia and response time of the mechanical parts. Microfluidics could provide new perspective for HVM to reduce diffusion time and analyte volume and to increase detection sensitivity [15, 16].
In this work we present a new type of hydrodynamic voltammetry based on a microfluidic system. The device incorporates the concept of laminar flow in a microfluidic channel to control the mass transport to an electrode surface fabricated in the microchannel. The device integrates an electrochemical cell with a phase sensitive detector to measure periodic current. Phase sensitive detection is a powerful technique for recovering weak signals buried under a noisy background. The technique is based on modulation of signal of interest at a particular frequency and detecting the modulated signal using a band pass filter. With this technique, the modulated signal can be selectively amplified and the uncorrelated noisy background is filtered out. The working principle of the microfluidic hydrodynamic modulation voltammetry (µ-HMV) is based on periodic modulation of mass transport to a microelectrode fabricated in a microchannel. The periodic control of laminar flow of buffer and analyte in a microchannel provides a convenient means of controlling mass transport to the working electrode thus allows a sensitive electrochemical detection. We believe that the presented microfluidic device which has relatively fast response time (<100 ms) with no moving mechanical parts provide an ease-of-use hydrodynamic modulation technique together with higher detection sensitivity.
In this thesis, a new type of microfluidic based electrochemical sensor is presented. The thesis is organized in 5 chapters. First chapter involves general information about previous studies regarding microfluidic devices and analytical techniques integrated in lab-on-a-chip system. In chapter 2, a review of theoretical background of physics of fluids in microscale is presented. Dimensionless numbers are discussed to characterize flow in microchannels. In chapter 3, electrochemistry and electroanaltical methods are explained. Electrochemical cell is studied to understand formation of electrochemical current between solution and electrode surface. In order to understand modulation of
4
mass transport to electrode surface, HMV method is studied. In chapter 4, fabrication procedure of electrochemical cell is given. Fabrication procedure is divided into two parts, these are fabrication of the microfluidic channel and fabrication of the electrodes. The phase sensitive detection using a lock in amplifier is studied to detect periodic electrochemical current generated in the electrochemical cell. Finally in chapter 5 the obtained results are presented. Future work and possible applications are discussed as a conclusion.
5
CHAPTER 2
2.
Physics of fluids
2.1 Dimensionless Numbers in Microfluidics
Fluids are classified as Newtonian and non-Newtonian fluids based on their behavior under an external force. A Newtonian fluid has a linear stress- strain curve. The slope of this curve is known as viscosity (µ). Therefore a Newtonian fluid has constant viscosity under a stress. Water is an example for Newtonian fluids. Non-Newtonian fluids have shear rate dependent viscosity. The viscosity changes with the applied shear force. Ketchup is an example of non-Newtonian fluids. In this thesis, we will work with Newtonian fluids. We can model these fluids as continuum materials. There are two important physical parameters for characterizing liquids; density ( ), and viscosity (µ). The velocity profile of Newtonian liquids whose viscosity and density are constant, complies with the Navier-Stokes equation (2.1) and continuity equation (2.2) as
(
)
(2.1)
6
where P is the pressure, is the density, is the viscosity of the fluid and g is the gravitational force. Using the incompressibility condition that is the case in which the density of fluid does not change, the solution of continuity equations is expressed as Eqn. (2.3).
(2.3)
The Newton’s second law of motion,
(2.4)
is also identical to Eqn. 2.3 to represent the velocity field of fluid.
The left hand side of Eq.2.3 represents the product of acceleration and mass and the right hand side shows the total force which are frictional force ( ) , pressure (P), and gravitational force (g).
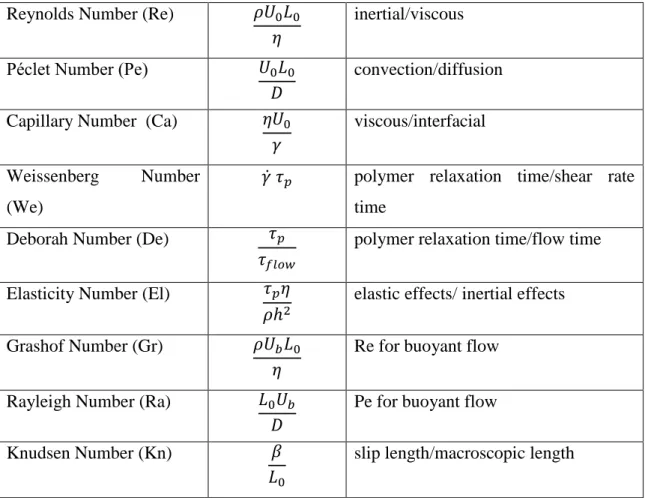
Dimensionless numbers are useful quantities that their associated physical units are excluded in order to simplify and parameterize the solutions of Eq. 2.3 for various conditions. There are different dimensionless numbers, some of them are listed in Table 2.1. These numbers characterize different physical phenomena occurring in microfluidic devices. Some of these numbers are discussed in detail below.
2.1.1 The Reynolds number
The Reynolds number (Re) is the most important dimensionless number in fluid mechanics. The Reynolds number is defined as the ratio of inertial forces to viscosity forces. The former is defined as the resistance to move or change and the latter is defined as ability of materials to stick together. According to this definition, Reynolds
7
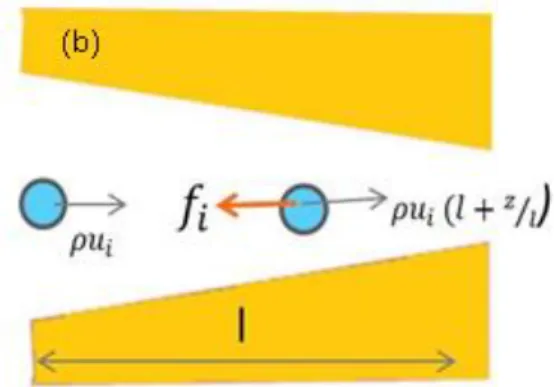
number can be derived by using two examples shown in Figure 2.1. A fluid element flows with velocity in a corner of a microchannel whose width is w (Fig.2.1.a). While turning the corner, it loses momentum density, , throughout the turn time ⁄ and the inertial centrifugal force density can be written by using the conservation of momentum as showed in Eq.2.5.
⁄ ⁄ (2.5) Considering the second example ( Fig.2.1.b ), a fluid flowing in a channel with a length of . The velocity, rising as ( ⁄ ) brings about a fluid element to gain momentum at a rate given in Eqn.2.6.
⁄
8
Figure 2.1 Inertial forces exerted by accelerating fluid elements in two different microchannel. Changing the direction of a fluid element (a), Or accelerating on element (b) brings inertial forces onto microfluidic channels.
As can be concluded from these two examples, inertial forces of fluids are independent of direction of flow. The viscous forces are characterized by using viscous stress, T and expressed in Eqn. 2.7. The viscous force density is given by Eqn. 2.8.
(2.7)
⁄ (2.8)
where L0 is the typical length scale of the system. According to the definition of
9
⁄ (2.9)
based on the Reynolds number, behavior of fluids can be classified in these regimes; (1) If Re< 2000, laminar flow regime holds that fluids travel in straight lines along
the direction of flow.
(2) If 2000 4000, transient flow regime holds that flows may fluctuate between laminar and turbulent flow.
(3) If Re > 4000, turbulent flow regime holds that flows have no uniform motion at the certain level.
2.1.2 The Péclet Number
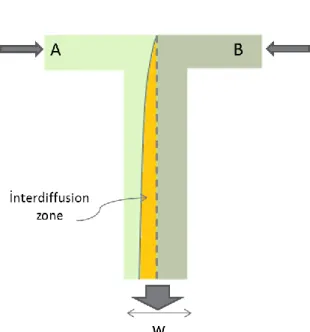
The Péclet number (Pe) is a dimensionless number that is related to transport phenomena in fluid mechanics so it is defined to be the ratio of convection to diffusion of physical quantities. Two fluids, entering to the T- junction from A ports and B ports, respectively, flow through the channel as in Fig. 2.2. The necessary time scale for diffusion of particles across the entire channel is expressed in Eqn. 2.10.
⁄ (2.10)
where w is the channel width, D is the diffusion coefficient.
Through this time, in order to achieve complete mixing, one has to consider the distance of stripe movement through channel. This can be calculated by using Eqn.
10
2.11, then the number of channel widths for complete mixing can be found using Eqn. 2.1.2. [2]
⁄ (2.11)
⁄ (2.12)
Figure 2.2 The flow profile for a T- junction channel. The graded region is the diffusion zone.
11
Table 2.1 Dimensionless numbers used to characterize fluid flow. Reynolds Number (Re) inertial/viscous
Péclet Number (Pe) convection/diffusion Capillary Number (Ca) viscous/interfacial Weissenberg Number
(We)
̇ polymer relaxation time/shear rate time
Deborah Number (De)
polymer relaxation time/flow time Elasticity Number (El)
elastic effects/ inertial effects Grashof Number (Gr) Re for buoyant flow
Rayleigh Number (Ra) Pe for buoyant flow
12
CHAPTER 3
3.
Electrochemistry and Electroanalytical
Methods
Electrochemistry is a physical measurement of electron movement in chemical reactions, in other words, it is interested in transformation of electrons between the electrode surface and solution. This transformation depends on making and breaking of chemical bonds such as covalent bonds. In electrochemistry, the major chemical reactions are oxidation and reduction, which are called redox reactions. Oxidation means loss of electrons while reduction means gain of electrons.[17] These two reactions are represented by eq. 3.1 and Eq. 3.2 as,
Ba+ A(a+n)+ + ne- (Oxidation) (3.1)
Aa+ +ne- A(a-n) (Reduction) (3.2)
There are several electrochemical methods in electrochemical analytical science such as voltammetry, potentiometry, conductimetry that are defined later in section 3.3. The major purposes of all these methods are extending the detection limit of electroactive species and increasing the potential window of a given solvent due to the raise of interval of characterizing information of addressable species.
13
Furthermore, being inexpensive and yielding information about activities instead of concentration of chemical species, makes electrochemical methods preferred in eletroanalytical science[18].
3.1 Electrochemical cell
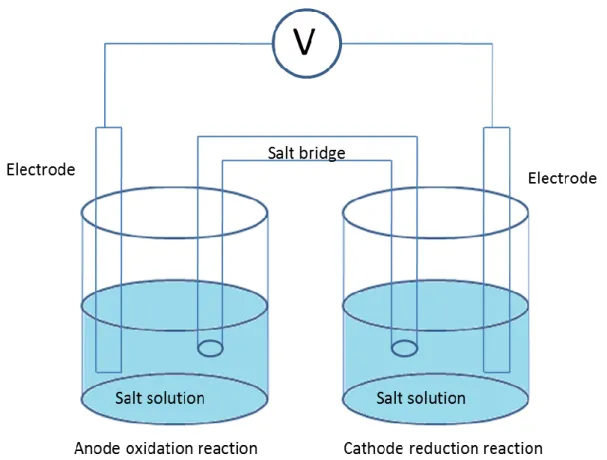
An electrochemical cell is a system, which contains chemical reactions that are based on redox reactions. It is composed of two or three electrodes that are embedded in suitable electrolyte solution. In order to develop current in a cell, these electrode must be connected to one another externally by conducting wires and in solution by ionic transport[18]. There are two or more charge transfer occurs at different electrodes in opposite directions in a cell. Figure (3.1) shows an example of standard electrochemical cell.[19]. According to Figure 3.1, there are two electrodes called anode where the oxidation reaction occurs and cathode where the reduction reaction occurs in the electrochemical cell. Moreover, there is a salt bridge in electrochemical cell in order to provide charge transfer along the solutions and prevent mixing of the solutions[20]. In the cell, two half-cell reactions occur in the two electrodes separately. Potential of the electrochemical cell is varied by the activities of these half-cell chemical reactions. Due to these chemical activities, there is a voltage difference carried out between two electrodes and called electromotive force, (Emf)[21]. Emf is defined as the standard electrode potential under standard conditions that are 1 M H+ in 25Co at 1 atm ( ). To obtain the equilibrium reduction voltage of a half cell or total electrode potential of the electrochemical cell, Nernst equation (3.3) is used. Nernst equation defines the balance between the concentration gradient to the electric gradient. According to reaction given in eqn.(3.3), Nernst equation is written as Eqn. 3.4.
14
Nernst equation can be written,
(3.4)
where n is the number of electrons, F is the Faraday constant ( 96,487 coul mol-1), R is the gas constant (8,3143 V coul deg-1 mol-1) , T is temperature (Kelvin) and Q is the reaction quotient[20] and expressed in Eq. 3.5.
(3.5) Nernst equation for total voltage of electrochemical cell is given by Eq. 3.6
(3.6)
The potential difference between the cathode electrode potential and the anode electrode potential is the potential of the electrochemical cell, and expressed in Eqn. 3.7.
15
Figure 3.1An example of a simple electrochemical cell
There are two types of electrochemical cell. First type is galvanic cell (voltaic cell), in which the chemical reactions take place spontaneously and produce electrical energy [22]. It is generally used for transforming chemical energy to electrical energy. Battery is one of the most common examples for galvanic cells. The second type is called electrolytic cell. To obtain current in this type of cell, voltage difference must be applied or non-spontaneous chemical reactions to occur. Electrolytic cells are used in order to fulfill indented chemical reactions by way of expanding electrical energy. The favorite example of electrolytic cell is electrolysisof water.[17]
16
3.2 Faradic and Non-Faradic Currents
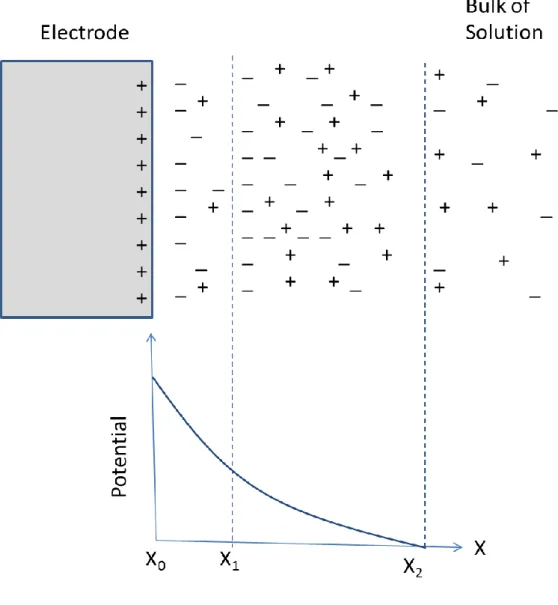
In electrochemical cells, two kinds of processes occur at the surface electrodes. First process is the direct transfer of electrons through an electrode-solution interface, which is formed as a result of oxidation or reduction reactions. Due to being controlled redox reactions by Faraday’s law, this process is called faradic process and corresponding current is called Faradic current[18]. Under certain conditions, there is no charge transfer between electrode-solution interface but some absorption and desorption can occur due to thermodynamic and kinetic reasons and an electrode-solution interface may show a variation in structure with a potential or solution composition [21]. When applying voltage to electrode surface, the electrode is polarized and the solution that is adjacent to an electrode forms layers which have different potentials according to distribution of charge carriers. These processes are called non-faradic processes and the resulting current is called non-faradic current. For example, if positive voltage is applied to electrodes, the positive charges are gathered out the electrode solution-interface and two charge layer are formed in the solution near the electrode surface as shown in Figure 3.2. The inner layer is defined as inner compact layer (X0 to X1) and
the second layer is defined as diffuse layer. According to increase of distance to electrode, potentials of these two layers decrease linearly in the inner compact layer and exponentially in the diffuse layer as showed in Figure 3.2 [18]. As a result of that while characterizing currents of type, the traveling of electron is examined. If an electron of electrodes remains at the electrode surface and causes to form of double layer , it contributes to non-faradic process, however if it breaks up electrode surface and reacts with the species in the solution, it can be considering as a Faradic current.[18]. In electrochemical cells, not only Faradic current but also non-faradic currents are formed in electrode at the same time. While obtaining information and associated reaction by using electrochemical data, both type of currents should be taken in to consideration[22] .
17
Figure 3.2 Electrode double layer at positive potential near an electrode surface. .
3.3 Mass transport
Mass transport is defined as the variation of material location inside a solution. This movement is resulted from diffusion that is the transfer of material from high concentration to low concentration. Migration is the movement of charged particles related to electrical field, and convection is the movement of particles due to the
18
hydrodynamic forces [23]. The total mass transport is defined by the Nernst-Planck equation for one dimension and given in Equation 3.8 [24].
3.8
where D is the diffusion coefficient of solution species, u is the velocity of species, and c is the concentration of species.
3.4 Electrochemical analysis methods
There are several electroanalytical methods to measure electrical properties of species. Potentiometry is one of these methods. Potentiometry is used to define concentration of species in the analyte by the means of measuring potential of electrode system. The other method is coulometry which is used to measure the total charge that is consumed throughout an electrolysis reactions. Amperometry, as the name implies, is employed for measuring the electric current that passes among a solution to lead to oxidation or reduction of the analyte [25] . Conductimetry is used to measure conductivity of solution by use of motions of ions in the solution. Voltammetry is the most common and essential analysis method that is used to measure current resulted from electrode by applying various potential[20].
3.5 Voltammetry
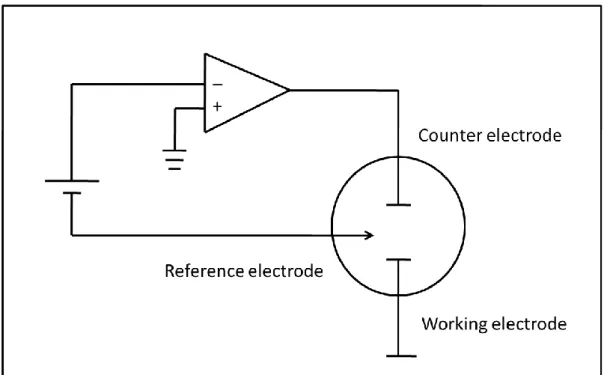
As mentioned in the above, voltammetry is widely used by chemist because of using extra electrode, which is called reference electrode in order to make quantitative analytical measurement. Voltammetric cell is composed of three electrodes, they are working electrode where oxidation and reduction occur, counter (auxiliary) electrode which polarizes the working electrode, and reference electrode that keeps the potential of the liquid stable. A circuit diagram of a voltammetry is given in Figure 3.3. As shown Figure 3.3, there is an operational amplifier in the system in order to control the potential on the working electrode. In voltammetric cell, the voltage is carried out
19
between the working and the counter electrodes and the current is saved as a function of working electrode potential. The potential of working electrode is measured according to potential of reference electrode [20]. In a voltammetry, generally microelectrodes can be used to reduce sample consumption and detection time.
Figure 3.3 Schematic diagram of a voltammetry
There are also similar type of measurement techniques in voltammetry such as linear sweep voltammetry, cyclic voltammetry. These methods provides some degree of improvement of sensitivity of the voltammetry.
3.6 Linear sweep and cyclic voltammetry
In linear sweep voltammetry (LSV), the voltage of working electrode is scanned linearly in a fixed potential range with time as shown in figure 3.4a. The applied potential at a certain time is can be written,
20
(3.9)
where is the electrode potential at time t, is the starting potential, ʋ is the sweep rate. According to direction of potential scan, the sign of Eqn (3.9) is changed[26]. The sweep rate (ʋ) ,the chemical reactivity of the electroactive species, and the electron transfer reaction rate influence the characteristics of linear sweep voltammetry[22].
(a) (b) Figure 3.4 Graphs of potential as a function of time (a) linear sweep voltammetry, (b) for cyclic voltammetry.
In cyclic voltammetry, the voltage is swept between two values at a constant rate but when the voltage reaches to its extreme value, it sweeps this same interval with reversed direction. The applied voltage at any time is calculated by using Equation 3.10.
21
where is switching time[26].
3.7 Hydrodynamic modulation voltammetry
Hydrodynamic modulation voltammetry ( HMV ) methods present high sensitivities in the field of electroanalytical chemistry. HMV comprises a mass transfer rate of species on to the electrode surface in order to lead to higher current and reproducibility. This transfer rate is obtained by oscillating periodically as means of modulating the flow of solution over the static electrode or motion of electrode with regard to solution.[27, 28]. In this method, phase sensitive detector can be used to extract alternating current (ac) component therefore it allows us to detect mass-transport limited current that is separated from the current signal resulted from background processes[28]. Moreover, hydrodynamic modulation voltammetry makes it possible to enable high modulation frequency which provides to decrease detection time[27]. There are so many hydrodynamic modulation voltammetry methods in electroanaltical technology such as rotating disc electrode, stopped channel flow, vibrating electrode ,ultrasonic modulation. The main purpose of all these methods is to achieve to decrease analysis time and increase the sensitivity of detection.
22
CHAPTER 4
4.
Fabrication of Electrochemical Cell
Shrinking of microfluidic devices has been the main goal to enhance the performance and to increase the sensitivity of analytical devices. Moreover, this shrinkage provides many advantages such as decreasing fabrication cost, sample consumption, analysis time [29]. In this chapter of the thesis, the fabrication process of the electrochemical sensor will be given in a detailed manner. The sensor consists of a three-electrode electrochemical cell, an elastomeric microfluidic channel, and electronic circuit and flow controllers. First we fabricated the microfluidic channels by molding an elastomeric channel from a master and then sealed the channel on the electrodes fabricated on a glass slide.
4.1. Molding of Microfluidic channels from PDMS
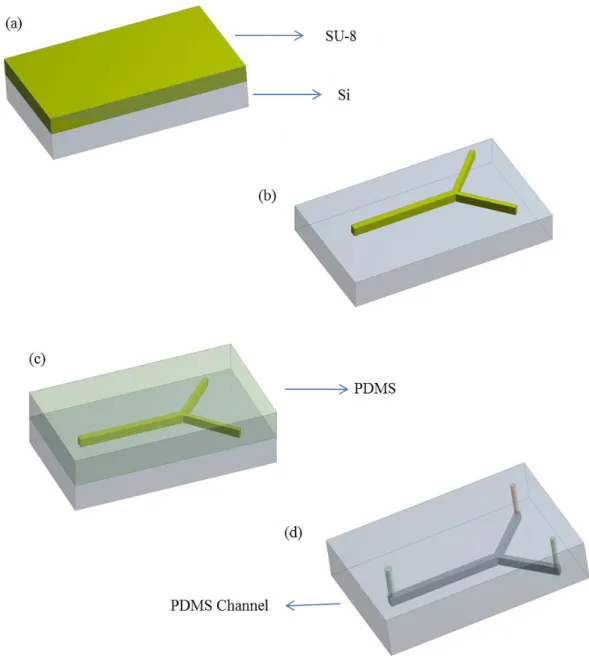
The fabrication procedure of molding microfluidic channels consist of three parts; (1) fabrication of the mold, (2) molding the elastomeric channel, (3) fabrication of the microfluidic channels. Figure 4.1 shows the schematic drawing of fabrication process microfluidic channel.
4.1.1 Fabrication of the mold
The first step of the fabrication process is the preparation of the mold. We used SU-8 photoresist to fabricate the molds. It is a kind of photoresist that is widely used in molding processes of microfluidic applications [30, 31]. We used a silicon wafer as a substrate. First of all, in order to prevent any defect and contamination in the wafer, it was cleaned in a piranha solution (H2O2:H2SO4) (1:3) for 15 minutes before coating of
23
The wafer with 25 µm thick SU-8 coating was baked about 5 minutes at 95 . Y junction channel pattern are obtained by using photolithography. After the illumination, soft exposure bake was done at 95 for 5 minutes. At last, the photoresist was developed with MR-600 for 8 minutes. Y junction pattern on silicon wafer was ready for molding.
4.1.2 Preparation of microchannels by molding
PDMS (polydimethylsiloxane) is a soft polymer, widely used to make microfluidic channels. There are many advantages to use it commonly such as being transparent, compatible, and peals easily from substrates[32]. While preparing PDMS, we put PDMS and curing agent that is mixed 10:1 ratio, in a petri dish and stirred strongly in order to mix them completely. Then to remove air bubble, we placed it in a vacuum chamber. Then we poured the PDMS solution to the silicon wafer with SU-8 pattern. Then, silicon wafer with PDMS was baked the oven at 75 about 40 min to 1h to cure PDMS. Once the PDMS is cured, PDMS was pealed from silicon wafer, we cut the PDMS carefully around the channel by using bistouries. We sealed the PDMS cahnnels on the glass slide using O2 plasma. At last step, by using sharp hollow wires, we made two inlet and one outlet holes on heads of channels, showed in figure 5.d in order to allow entering and exiting of fluids through the microfluidic channels.
24
Figure 4.1 Schematic drawing of molding microfluidic channels from PDMS, a)photoresist ( SU-8) coating ,b) photolithography, c) casting PDMS, d) molding PDMS.
25
4.2. Fabrication of Electrodes
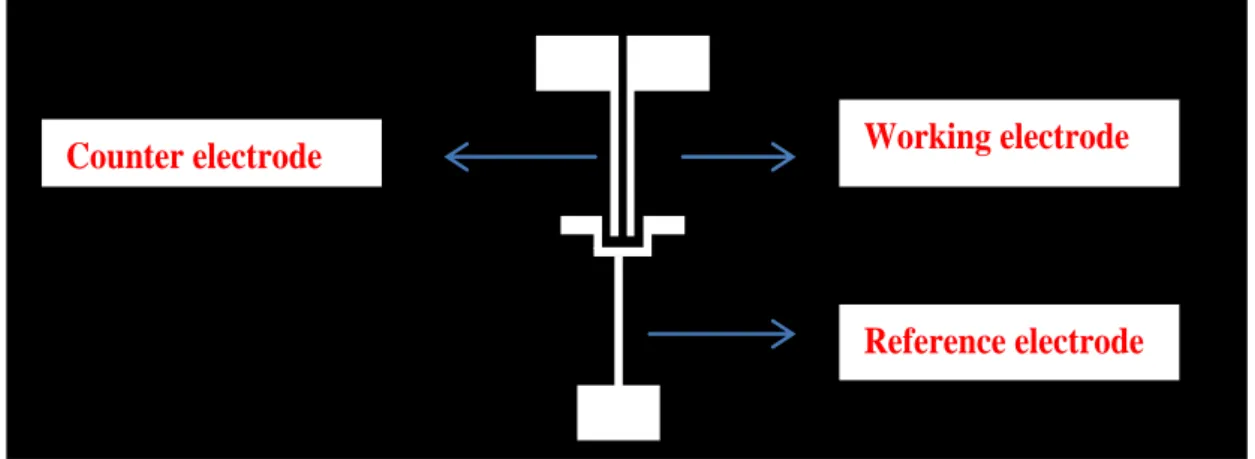
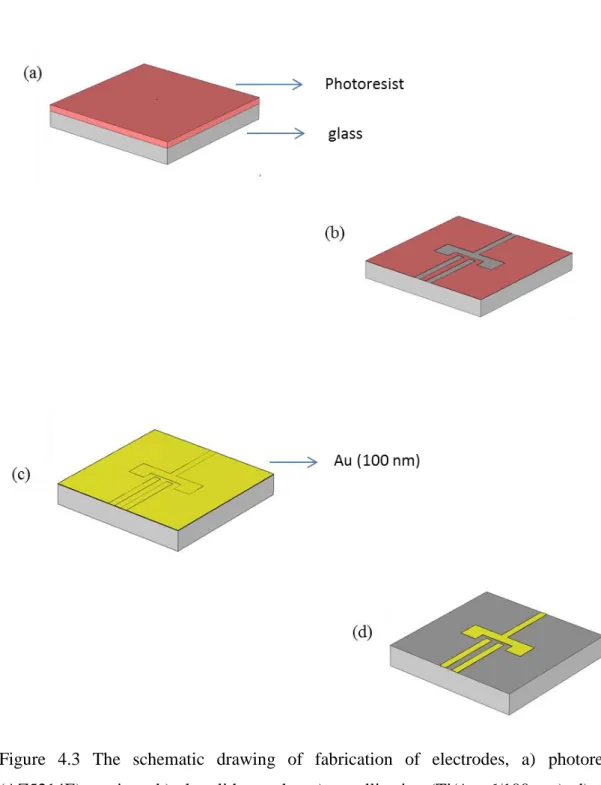
Electrode fabrication process start with a cleaning step. We used a glass slide as a substrate and slide was cleaned by using a standard cleaning process that contains acetone- isopropanol-water respectively. The fabrication procedure of electrodes is shown at Figure 4.3. Photolithography was implemented for patterning of electrodes to microscope slide. The figure 4.2 shows the mask of electrodes that is used in mask illumination. According to mask, the width of the electrodes ( working electrode, counter electrode) are 0.5mm, the gap of electrodes is 0.5mm, the size of reference electrode is 1mm and the size of pads are 3 mm/5 mm. AZ5214E (image reversal photoresist) was used for patterning of electrodes. We used gold for electrode metals since gold has a high electrical conductivity. However, there is a problem about the adhesion between gold and glass. In order to solve this problem, Ti was coated on the glass by sputtering as the adhesive layer. Ti/Au (5-6 nm/ 100 nm) were grown on the glass slide by sputtering and thermal evaporation respectively. Finally, lift-off was implemented to remove metal from place, where covered with photoresist by immersing in acetone about 1 hour.
Figure 4.2 Transparent mask used for UV-photolithography
Reference electrode Working electrode Counter electrode
26
Figure 4.3 The schematic drawing of fabrication of electrodes, a) photoresist (AZ5214E) coating , b) photolithography, c) metallization (Ti/Au, 6/100 nm), d) gold electrodes.
27
4.3. Sealing of PDMS Channel and Electrodes
Before sealing the PDMS channels with electrodes, the PDMS surface and the electrodes surface must be chemically activated by exposing them to O2 plasma.
Therefore, a reactive ion etching ( RIE) was used for O2 plasma with conditions that
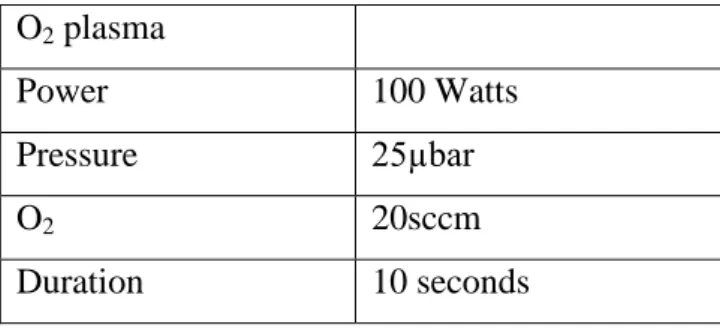
are showed in Table 4. The role of O2 plasma is twofold, (1) it cleans the surface of the glass and (2) it activates the surface of PDMS by removing the organic parts and leaving broken oxygen bonds. After activating the PDMS surface we aligned the electrodes to the channel and sealed the channels by heating at 150 degree for 5 minutes.
Table 4.1 RIE condition for oxygen plasma O2 plasma Power 100 Watts Pressure 25µbar O2 20sccm Duration 10 seconds
4.4. Voltammetry
Voltammeter is a kind of electrochemical cell with three electrodes. This is an effective electroanalytical method for doing quantitative analytical measurement. We started to set-up with establishing electrical circuit. Figure 4.4 depicts the schematic representation of electrical circuit. Our electrical circuits contain two operational amplifiers (OP07CR, very low offset single bipolar operational amplifier). One of them was connected to microfluidic device for holding the voltage of electrochemical cell constant. The other was used to convert current of the working electrode to voltage by using 2.66 kOhm feedback resistance. Solenoid valve is used for changing the pressure of fluids that are in microfluidic channels at 3 Hertz. The circuit also
28
contained a lock- in amplifier which will be discused in section (4.5) to detect the generated ac current on the working electrode. IA lock-in amplifier is a kind of phase sensitive detector that can remove the carrier wave which is a signal from an extremely noisy environment. Therefore it eliminates noise and background current significantly in the electrochemical cell and increase the sensitivity of microfluidic devices.
Electrochemical current occurred in electrochemical cell is controlled and measured by using LabVIEW program. Figure 4.5 shows the LabVIEW block panel and front panel respectively that was used to control electrochemical current.
Figure 4.4 The circuit diagram of the electrochemical cell integrated with a voltammetry and a phase sensitive detector.
29
figure 4.5 An image of the data acquisition program for electrochemical sensor written using labVIEW (a) front panel, (b) block panel
30
4.5. Phase sensitive detection: Lock-In Amplifier
Phase sensitive detection (PSD) is a very powerful method in many scientific experiments with the offer of two useful opportunities which are its ability to reduce noise and perform phase detection in frequency domain. The lock-in is a signal recovery technique. The signal of interest is modulated at a given frequency and the generated signal is demodulated by nonlinear circuits. Lock-in amplifier uses a reference signal at a specific frequency sensitive detection [33, 34]. The lock-in amplifier is an instrument that measures signals in and the phase in order to eliminate uncorrelated noise signal that is signal at frequencies other than the reference frequency. Lock-In amplifier generates own reference signal by using a phase locked loop (PLL) or reference signal is provided by excitation source called external reference source such as function generator[35].
31
The working principle of a lock-in amplifier is given in figure 4.5. Firstly, we have an ac input signal (Eq.4.1) and a reference signal (Eq.4.2),
( ) ( ) (4.1)
( ) (4.2) Then, when we multiply these two signals using a nonlinear circuit element then we obtain two AC signals at different frequencies ( ) and ( ) (Eq.4.3) .
If the input signal has different frequency from frequency of reference signal ( ), the output signal is an AC signal and eliminated while passing through a low pass filter. But, if the frequency of the input and the reference signals are the same ( ), then one of the components of the output signal will be a DC signal (Eq.4.4).
Then, by adding a second PSD, the phase dependence can be eliminated and therefore there are two output signals occur,
(4.5)
(4.6) Where is a phase difference between reference and output signals.
√ (4.7)
( ) ( ) { ( ) ( ) } (4.3)
32
Vsig is a signal amplitude. It is independent of phase differences between reference and
input signal.
In the lock-in amplifier, the low pass filter is used for eliminating the different frequency components of the noise signal, which are different than reference frequency[33]. The working principle of low pass filter is shown in figure 4.6. Low pass filter allow to pass signal at a certain frequency interval close to reference frequency. This interval is called bandwidth.
The input signal is a sine wave with different amplitudes and Fourier’s theorem provide to be representing this input signal as the sum of sine waves with different amplitudes and phases.
33
4.6. Electrochemical reactions
In the electrochemical cell, we used 0.1 M LiClO4 (lithium perchlorate) as a buffer
and 10 mM K3[Fe(CN)6] (potassium ferricyanide) as an analyte solved in distilled
water. Redox reactions occur in the cell. ( ( ) (ferricyanide) is reduced and turned ( ( ) (ferrocyanide) ion. This redox couple is reversible as showed in eq.(4.8).
( ) ( ) (4.8)
The standard reduction potential of the redox reaction in aqueous solutions is 0.36 V at 298K [36]. We used LiClO4 in order to have high ionic strength with potassium
ferricyanide and wide potential window. Potential window is a potential range between which the substance does not get oxidized nor reduced so it is an important parameter for choosing a convenient buffer for electrochemical reactions. The potential window of potassium ferricyanide is ±0.5V .The potential window of lithium perchlorate is from -3.0 to 2.4 V for platinum electrode and this range is changed due to electrode that is used. In our work we used gold electrode and we expect that potential window range is decreased compared to platinum electrode.
We scanned the voltage of working electrode linearly with a scan rate of 0.01Vs-1 between -1V and 1V voltage range.
34
CHAPTER 5
5.
Microfluidic Hydrodynamic
Voltammetry
In this chapter we will summarize the results obtained using fabricated device. Figure 5.1 shows the schematic drawing of the µ-HMV. The microfluidic channel has Y-junction geometry. The laminar flows of buffer and analyte solutions were injected to the electrochemical cell with three-electrode configuration. The rate of flow of the buffer was modulated by changing the pressure using a three way solenoid valve (LFAA1201418H, The Lee Corporation). As the rate of flow of buffer oscillates, the mass transport of analyte on the working electrode is periodically modulated at a frequency around 3Hz. The alternating current generated on the working electrode is detected by a lock-in amplifier (Stanford Research, SR830). The lock-in amplifier (LIA) works as a very narrow-band-pass filter (band width of 0.1Hz ) around the reference frequency. Periodic electrochemical signals pass through the filter and uncorrelated current in the electrochemical cell due to charging and other transient background current are filtered out. A homemade potentiostat controls the voltage of the working and counter electrodes and send the current generated on the working electrode to the input of the LIA. The time constant of the LIA is set to 1 sec to achieve steady state electrochemical current. The output of the LIA provides the steady state current at the modulation frequency. To obtain the steady state voltagrams, we swept the voltage linearly and recorded the output of the LIA.
35
Figure 5.1 Schematic representation of the fabricated microfluidic device to measure differential electrochemical current. Three gold thin film electrodes (working, counter and reference electrodes) were fabricated on a glass slide. The Y-junction microfluidic channel sealed on the glass slide has two inlets named as A and B. The buffer solution is injected to the inlet A and the analyte injected to the inlet B. A solenoid valve is used to control the pressure of the buffer. The pressure of inlet A oscillates between P1 and P2 at a frequency of 3Hz. The pressure of inlet B is kept at P3. The alternating electrochemical current on the working electrode is detected with a lock-in amplifier operating at current detection mode. The voltage of counter and reference electrodes are controlled by a homemade potentiostat.
An schematic of the fabricated microfluidic device is shown in Figure 5.2.a. The fabrication process consists of two main steps; (1) fabrication of elastomeric channels and (2) fabrication of microelectrodes. The elastomeric channels were fabricated using PDMS (Polydimethylsiloxane) based rapid prototyping. We used 50 um thick SU8-2025 photoresist to fabricate the masters. The electrodes were defined by a standard UV photolithography. After the metallization of 100 nm thick gold film and lift-off process, we sealed the PDMS microfluidic channel on the metal electrodes using oxygen plasma. After attaching the wiring with a conductive epoxy, we connected the
36
electrodes to the homemade potentiostat. Figure 5.2.b shows the flow profile in the channel with Y-junction geometry. The flow profile in the channel junction which is called node, is not laminar. Far from the channel junction, the laminar low profile applies. The fractional filling of the channel is determined by the rate of flow from channel A and channel B. We fabricated the electrodes downstream from the channel junction where we have steady state profiles. Figure 5.3.a and 5.3.b illustrates the working principle of the device. We injected analyte (potassium ferrocyanide in 0.1 M LiClO4) and buffer (0.1 M LiClO4) from the upper and bottom channels. We
controlled the rate of the buffer by modulating the pressure using a solenoid valve. The flow profile inside the microchannel oscilates between the two cases shown in Figure 5.3.a and 5.3.b. The detected electrochemical current due to the oxidation of 320 nM potassium ferrocyanide is shown in Figure 5.3.c. As the pressure of the buffer oscillates, the generated electrochemical current changes between 1.12x10⁴ mA to 3.6x10⁵ mA. Figure 5.3.d shows the decay of the electrochemical current after switching the pressure. The decay time is around 100 msec. The time response is defined by the rate of mass transport.
37
Figure 5.2 (a) An image of the fabricated microfluidic device. The three thin film electrodes are registered to the Y-junction microchannel. The area of counter electrode is chosen to cover the entire microchannel to increase electron transfer. The wires are connected to the chip with a conductive epoxy. (b) The flow profile of in a Y-junction microchannel. Two fluids are introduced from channels A and B. The upper and lower channels have rate of flow of Q1 and Q2. The fractional filling of the channel downstream of the junction area is w1 and w2 which are linear functions of Q1 and Q2.
38
Figure 5.3 (a.b) Schematic drawing of the working principle of the device. As the pressure of the buffer changes, the microchannel is periodically filled by the buffer and analyte. The periodic change of flow of the buffer stream generate periodic modulation of the mass transport to the working electrode resulting in a periodic electrochemical current. (c) Time trace of the mass transport limited electrochemical current generated by the oxidation of (Fe(CN) 6 )+4 while the working electrode is held
39
electrochemical current after switching the buffer solution. The response time of the system is around 100 msec.
We obtained steady state voltammograms for oxidation of 320 nM ferrocyanide, by scanning the voltage of the working electrode with a scan rate of 0.01Vs-1. The modulation frequency is set to 3Hz and the time constant of the LIA is set to 1sec. The obtained steady-state voltammograms for oxidation of 320 nM ferrocyanide in 0.1 M LiClO4 buffer for several values of hydrodynamic modulation frequencies are given in
Figure 5.4.a. In Figure 5.4.b, we plot the frequency dependence of the generated electrochemical current at -1V. The current is constant up to 4 Hz and decays as the modulation frequency increases. The power spectrum of the electrochemical current with a hydrodynamic modulation frequency of 3Hz is given in Figure 5.3.c. We measured the power spectrum by changing the internal frequency of the lock-in amplifier while keeping the modulation frequency constant at 3Hz.
40
Figure 5.4 (a) Steady-state voltammograms for oxidation of 320 nM ferrocyanide in 0.1 M LiClO4 buffer recorded at a scan rate of 0.01Vs-1 for several values of hydrodynamic modulation frequencies. (b) Dependence of current amplitude upon frequency of modulation. The rate of flow is 290 µL/min. (c) Power spectrum of the electrochemical current with a hydrodynamic modulation frequency of 3Hz. The power spectrum is recorded by changing the internal frequency of the lock-in amplifier while keeping the modulation frequency constant at 3Hz.
41
After characterization of the working principle of the microfluidic device, we will demonstrate the detection limit of differential electrochemical sensor. This device present a clear advantage for trace level detection because of elimination of current due to background processes. The modulation frequency is limited to low frequencies due to the response time of the flow inside the microchannel. To determine low concentration of analyte, we used the modulation frequency of 3Hz. Figure 4a shows steady state voltammograms for low concentration of ferrocyanide in 0.1 M LiClO4 buffer. These measurements were recorded with the same experimental setup and parameters described in Figure 5.4. The maximum current recorded at analyte ((Fe(CN) 6 )+4) concentration of 20 nM is 180 pA. Even for these low concentrations
the signal-to-noise ratio is very high. The limiting background current in these measurements are around 40pA. Figure 5.5b shows the maximum current for wide concentration range of analyte.
42
Figure 5.5 (a) Steady state voltammograms for low concentration of ferrocyanide in 0.1 M LiClO4 buffer. (b) The measured maximum electrochemical current as a function of analyte
43
CHAPTER 6
6.
Conclusion
As a conclusion we demonstrate a microfluidic based hydrodynamic voltammatery by combining modulation of laminar flow pattern of analyte and buffer solutions on an electrode surface integrated in the microchannel. The periodic modulation of mass transport to a microelectrode electrode surface is achieved by controlling the pressure of the buffer solution. This periodic mass transport generates a periodic electrochemical current that is detected by a phase sensitive detector. Since the phase sensitive detector detects only correlated signal at the modulation frequency, it rejects the uncorrelated current due to non-Faradaic effects. By combining microfluidics and electroctrochemical techniques, we were able to measure 10 nM concentration of potassium ferrocyanide in water. This technique provides a convenient hydrodynamic electrochemical detection with a relatively simple and compact instrument which does not require any moving mechanical parts. The presented microfluidic based hydrodynamic voltammetry could provide a sensitive detection technique for lab-on-a-chip systems.
44
8.
References
[1] J. Strutwolf, G. Herzog, A. Homsy, A. Berduque, C. Collins, D.M. Arrigan, Potentiometric characterisation of a dual-stream electrochemical microfluidic device, Microfluid Nanofluid, 6 - 231-240.(2009).
[2] T.M. Squires, S.R. Quake, Microfluidics: Fluid physics at the nanoliter scale, Rev Mod Phys, 77 977-1026. (2005).
[3] D.T. Schwartz, Experimental Implementation and Capabilities of Fourier-Transform Hydrodynamic Modulation Voltammetry, J Electrochem Soc, 140 452-458. (1993).
[4] J.V. Macpherson, Recent advances in hydrodynamic modulation voltammetry, Electroanal, 12 1001-1011. (2000).
[5] J. Wang, R. Polsky, B. Tian, M.P. Chatrathi, Voltammetry on microfluidic chip platforms, Anal Chem, 72 5285-5289. (2000).
[6] J. Wang, H.D. Dewald, Rapid stopped-flow voltammetry with potential scanning, Anal Chim Acta, 136 77-84. (1982).
[7] W.J. Aixill, A.C. Fisher, Q. Fulian, Hydrodynamic Microelectrodes. The Microstrip Electrode: Theory and Experiment, The Journal of Physical Chemistry, 100 14067-14073. (1996).
[8] N. Simjee, P.R. Unwin, J.V. Macpherson, Hydrodynamic Modulation Voltammetry with a Dual Disk Chopped Flow-Microjet Electrode (CF-MJE), Electroanal, 15 1445-1452. (2003). [9] J.V. Macpherson, P.R. Unwin, Hydrodynamic modulation voltammetry with an oscillating microjet electrode, Anal Chem, 71 4642-4648. (1999).
[10] H.D. Dewald, B.A. Peterson, Ultrasonic Hydrodynamic Modulation Voltammetry, Anal Chem, 62 779-782. (1990).
[11] J. Wang, Stopped-Rotation Voltammetry, Anal Chem, 53 1528-1530. (1981).
[12] W.J. Blaedel, R.C. Engstrom, Investigations of the ferricyanide-ferrocyanide system by pulsed rotation voltammetry, Anal Chem, 50 476-479. (1978).
[13] D.E. Williams, K. Ellis, A. Colville, S.J. Dennison, G. Laguillo, J. Larsen, Hydrodynamic modulation using vibrating electrodes: Application to electroanalysis, J Electroanal Chem, 432 159-169. (1997).
[14] S.A. Schuette, R.L. Mccreery, Efficient Hydrodynamic Modulation Voltammetry with a Microcylinder Electrode, Anal Chem, 58 1778-1782 .(1986).
[15] G.M. Whitesides, The origins and the future of microfluidics, Nature, 442 368-373. (2006).
[16] S.A. Schuette, R.L. McCreery, Hydrodynamically modulated alternating current voltammetry, Anal Chem, 59 2692-2699. (1987).
[17] G.D. Christian, Analytical chemistry, 5th ed., Wiley & Sons, New York, (1994).
[18] F.J.H. D.A. Skoog, T.A. Nieman, principles of Instrumental Analysis, Saunders College Publishing, USA, (1998).
[19] A.M.O.B. C.m.A.Brett, Electrochemistry Principles, Methods, and Applications., Oxford University Press, Oxford, (1993).
[20] G.D. Christian, Analytical Chemistry, JOHN WILEY & SONS,INC, New York, (1994). [21] H.H. Willard, Instrumental Methods of Analysis, Cengage Learning, (1988).
[22] S.K. Lower, Electrochemistry, in, (2004).
[23] C.M.A. Brett, A.M.O. Brett, Electrochemistry : principles, methods, and applications, Oxford University Press, Oxford, (1993).
45
[24] B. Kirby, Micro- and nanoscale fluid mechanics : transport in microfluidic devices, Cambridge University Press, New York, (2010).
[25] J.F.R. K.A. Rubinson, Contemporary Instrumental Analysis, Prentice-Hall,Inc, New Jersey, 2000.
[26] R.T. G. Bontempelli, Linear Sweep and Cyclic, (2005).
[27] J.V. Machpherson, Recent Advances in Hydrodynamic Modulation Voltammetry. [28] P.r.U. N. Simjee, J.V. Machpherson.
[29] S.W. Hyun-Chul Jung, Xin Hu, L., James Lee, Wu Lu., Etching of Pyrex Glass Substrates by ICP-RIE for Micro/Nanofluidic applications, in: J. Vac. Sci. technology, 2006.
[30] K.E. Herold, A. Rasooly, Lab on a chip technology, Caister Academic Press, Norfolk, UK, 2009.
[31] J.O.M. Bockris, S.U.M. Khan, Surface electrochemistry : a molecular level approach, Plenum, 1993.
[32] J.M.K. Ng, I. Gitlin, A.D. Stroock, G.M. Whitesides, Components for integrated poly(dimethylsiloxane) microfluidic systems, Electrophoresis, 23 (2002) 3461-3473.
[33] J.H. Scofield, Frequency-Domain Description of a Lock-in Amplifier, Am J Phys, 62 (1994) 129-133.
[34] R. Wolfson, The Lock-in Amplifier - a Student Experiment, Am J Phys, 59 (1991) 569-572.
[35] G.B. Armen, Phase sensitive detection: the lock-in amplifier, (2008).
[36] A.J. Bard, L.R. Faulkner, Electrochemical methods : fundamentals and applications, 2nd ed., Wiley, New York, (2001).