The Quantitative Analysis of Uvulopalatal Flap Surgery
Amaç: Bu çalışmada, uvulopalatal flap cerrahisinin kantitatif analizi için sinyal işleme tekniklerine dayanan yeni bir metodoloji önerilmektedir. Uvulopalatal flap ameliyatı ile ilgili klinik değerlendirme çalışmaları, doktorların muayenesine bağlı olmakla birlikte, hastanın subjektif geribildirimini de içermektedir. Kantitatif ve objektif değerlendirme çalışması literatürde halen eksiktir.
Gereç ve Yöntem: Ameliyat öncesinde ve sonrasında 21 hastanın tüm gece uyku kayıtları analiz edilmiştir. Önerilen algoritma, iki bağımsız bölümden oluşmaktadır. Birinci bölümde, kalp hızı değişkenliği ve elektrokardiyogramın karmaşıklığı hesaplanmıştır. İkinci bölüm ise, elektroensefalogram alt bantlarının enerjilerinin hesaplanmasını içerir. Ardından, klinik ve deneysel parametreler arasındaki ilintinin belirlenmesi için istatistiksel yöntemler uygulanmıştır.
Bulgular: Düşük frekans/yüksek frekans oranı ve beta dalgasının alt bant enerjisi, ameliyat sonrası delta uyku süresi düşük olan hastalar için anlamlıdır. Ayrıca, hem ameliyat sonrası delta uyku süresi hem de kan gazında ölçülen O2 satürasyonu (SaO2) parametresi yüksek olanlar için alfa ve beta dalgalarının ve teta dalgasının alt bant enerjileri anlamlıdır. Ameliyat sonrası solunum bozukluğu endeksi ve SaO2 parametresi düşük olan hastalarda karmaşıklık anlamlıdır ve solunum bozukluğunun horlama indeksi ile ilintisi bulunmaktadır.
Sonuç: Ameliyat öncesi ve sonrasındaki klinik bulgulara göre anlamlı olmayan solunum bozukluğu indeksinin karmaşıklık özelliği ile doğrudan ilişkili olduğu bulunmuştur. Bu çalışmanın en önemli sonucu, ameliyat öncesi karmaşıklık özelliğinin solunum bozukluğu ve horlama indeksi ile ilintili olmasıdır. Bu, karmaşıklık özelliğinin cerrahiden önce bir öngörü parametresi olabileceği anlamına gelmektedir.
Anahtar Kelimeler: Uyku bozuklukları, obstrüktif uyku apnesi, uvulopalatal flap cerrahisi, karmaşıklık, Hjorth parametreleri
Objective: In this work, a new methodology based on signal processing techniques for the quantitative analysis of uvulopalatal flap surgery is proposed. Clinical assessment studies of uvulopalatal flap surgery are based on not only the physician’s examination, but also the patient’s subjective feedback. Quantitative and objective evaluation studies are still lacking in the literature.
Materials and Methods: Full night sleep records were analyzed for 21 patients before and after the surgery. The proposed algorithm consists of two independent parts. In the first part, the heart rate variability and complexity of the electrocardiogram were calculated. The second part includes calculating the electroencephalogram sub-band energy. Afterwards, the statistical methods were applied in order to determine the correlation of clinical and experimental parameters.
Results: The low frequency/high frequency ratio and the sub-band energy of beta wave were significant for the patients having low post-operative delta sleep duration. Moreover, the sub-band energies of both alpha and beta waves, and theta wave were significant for the patients who had high post-operative delta sleep duration and blood oxygen saturation (SaO2)-parameter. Complexity was significant for the patients with low postoperative respiratory disturbance index and SaO2 parameter, and respiratory disturbance is correlated with snoring index. Conclusion: Respiratory disturbance index, which is not significant according to the pre- and post-operative clinical findings, was found to be directly related to the complexity feature. The most important result of this work is that the pre-operative complexity feature is correlated with respiratory disturbance and snoring index. This means that complexity feature can be a predictor prior to surgery.
Keywords: Sleep disorders, obstructive sleep apnea, uvulopalatal flap surgery, complexity, Hjorth parameters
Öz Abstract
Uvulopalatal Flap Cerrahisi Etkinliğinin Nicel Analizi
Aykut Erdamar, Tuncay Bayrak*, Hikmet Fırat**, Murad Mutlu***, Sadık Ardıç****, Osman Eroğul*****
Ad dress for Cor res pon den ce/Ya z›fl ma Ad re si: Aykut Erdamar PhD, Başkent University Faculty of Engineering, Department of Biomedical Engineering, Ankara, Turkey Phone: +90 312 246 66 66 E-mail: [email protected]
Re cei ved/Ge liş Ta ri hi: 05.04.2017 Ac cep ted/Ka bul Ta ri hi: 07.06.2017
©Copyright 2017 by Turkish Sleep Medicine Society / Journal of Turkish Sleep Medicine published by Galenos Publishing House.
Başkent University Faculty of Engineering, Department of Biomedical Engineering, Ankara, Turkey *Turkey Medicines and Medical Devices Agency, Ankara, Turkey
**Dışkapı Yıldırım Beyazıt Training and Research Hospital, Clinic of Chest Diseases, Ankara, Turkey *** Dışkapı Yıldırım Beyazıt Training and Research Hospital, Clinic of Otorhinolaryngology, Ankara, Turkey ****Kafkas University Faculty of Medicine, Department of Chest Diseases, Kars, Turkey
*****Economics and Technology University Faculty of Engineering, Department of Biomedical Engineering, Ankara, Turkey
Introduction
Obstructive sleep apnea (OSA) is one of the important sleep disorders that affects nearly 4% of men and 2% of women population (1). It is usually occurred by the relaxation of tongue and throat muscles leading to interruption in breathing during sleep (2). OSA is diagnosed with polysomnography (PSG) recordings which remains the gold standard laboratory technique for the assessment of sleep and its disorders (3). OSA is treated by either non-surgical or surgical methods. Correction of sleep posture, weight loss, external nasal support device, oral appliance therapy, pharmacological therapy and continuous positive airway pressure therapy are given as an example of non-surgical several treatment options for OSA. However, the surgical methods are an alternative option in case failure of non-surgical treatments. Uvulopalatopharyngoplasty (UPPP), tonsillectomy, mandibular osteotomy, tracheotomy, laser assisted uvulopalasty, reduction of glossectomy, internal and external nasal reconstruction, and the upper and lower jaws advancement are commonly known as surgical treatment options (4,5). The primary surgery technique is the UPPP procedure that was introduced by Fujita et al. (6). In this technique, surgeon aims to remove palatal and lateral pharyngeal tissues that are highly complaint during sleep. In 1996, the UPPP was altered to the uvulopalatal flap (UPF) technique (7). In the UPF, the wall mucosa between the uvula and lateral pharyngeal is removed and then the uvula is retracted toward the junction of the hard-soft palate for widening the oropharyngeal airway (8,9). The main advantages of UPF over UPPP are reduced risk of velopharyngeal insufficiency and nasopharyngeal stenosis, potential to be reversible, improved velopalatal opening from preserved uvular muscle, low risk of bleeding, and reduced pain (7).
The effectiveness of the surgical method is defined by the reduction of apnea hypopnea index (AHI) by 50% according to the value before surgery or an absolute AHI of 20 or less (10). Several clinical studies have reported the UPF is evaluated in the short time (≤6 months) and the long time (≥48 months), and the success of UPF and its modifications are between 42.4% and 96% for the different patient groups (10,11). After the UPF surgery, some improvements in snoring, respiratory disturbance index (RDI) and AHI for different patient groups in various pre-post-operative conditions may be observed (7).
In the literature, the success of the surgical method was generally assessed with clinical findings, whereas in another study, it was reported that this assessment was inadequate and subjective (10). Nevertheless, there is no study in the literature in which the success of the surgical method is numerically evaluated. Merely, there are few studies including the assessment of the non-surgical treatment, using numerical methods (12-14). However, there is no signal processing based study for the assessment of OSA surgery.
In this context, in our preliminary study, we observed that some patients with high post-operative AHI declared that their sleep quality became better after the surgery, conversely some patients with low post-operative AHI continued with the initial complaints (15). These results show that the numerical techniques are required to determine the new predictor or criteria for the assessment of OSA surgery. Therefore, the
efficacy of the surgery should be evaluated by both physicians and signal processing experts.
In the present work, a novel methodology based on electrocardiogram (ECG) and electroencephalogram (EEG) features is introduced for the quantitative analysis of UPF surgery. For this purpose, the same patient group for the same surgical procedure to introduce an objective assessment for the UPF was investigated and hence, full night PSG records before and after surgery were analyzed.
The rest of this paper is organized as follows. Section 2 begins with the description of the proposed algorithm. Then, the patient records and the properties of the signals are introduced. In this context, the methodological approach of the research is explained. Moreover, suitable ways to formulate the problem are presented. This section is completed by explaining the statistical model. The test results of the model are given in Section 3, which is followed by Section 4 with a discussion on the extensive results. Section 5 provides some final remarks with an emphasis on the novelties of the study and directions for future works.
Materials and Methods
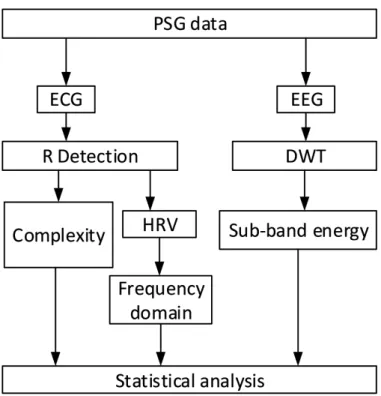
In this study, the full night sleep records were analyzed for 21 patients before and after the surgery. The proposed algorithm was applied using MATLAB, The Math Works Inc. The ECG and EEG channels were used for the analysis. The algorithm, shown in Figure 1, consists of two independent parts. The first part includes the ECG analysis. The heart rate variability (HRV) and the Hjorth parameters of the ECG were calculated subsequently. The second part includes calculating the EEG sub-band energy. Afterwards, the statistical methods were applied
Figure 1. The block diagram of the algorithm
PSG: Polysomnography, ECG: Electrocardiogram, EEG: Electroencephalogram, HRV: Heart rate variability, DWT: Discrete wavelet transform
in order to determine the correlation between the ECG, EEG and UPF parameters. The methods used in each part of the proposed method and recordings are explained in the following subsections.
Polysomnography Recordings
In the present study, a set of overnight PSG data was used. The recordings were collected from the Sleep Research Laboratory Database of the Department of Chest Diseases at the Yıldırım Beyazıt Instructional and Exploratory Hospital, Ankara, Turkey. Twenty-one patients with OSA had undergone nocturnal PSG recording using gold standard method (16,17). All signals were recorded with a multichannel digital PSG device (Compumedics E series). The PSG recordings contain the ECG, EEG (C3-A2, C4-A1, O2-A1, O1-A2), electromyogram, electrooculogram, blood oxygen saturation (SaO2), thorax impedance, body position, airflow, snoring sound, and photoplethysmogram. In this study, the ECG and EEG channels of PSG records were only used. The ECG electrodes were placed on the body with Einthoven triangular forms to acquire lead-II derivation. The EEG electrodes were placed on the scalp due to 10-20 electrode system and C3-A2 derivation of EEG was used. The ECG and EEG signals were recorded with 512 and 256 samples per second, respectively. Both signals were filtered with a 0.5-35 Hz band-pass filter and have 16 bit resolution. The PSG data used in the study were recorded in routine clinical trials. In this work, only retrospective studies were performed on this data. No information from patients was used. For this reason, ethics committee approval is not required.
The Electrocardiogram Analysis
In ECG analysis, teager energy operator (TEO) was used for R-wave detection to obtain HRV series. After, the Hjorth parameters of the ECG was calculated. R-wave detection is the crucial step to calculate HRV series and Hjorth parameters. The QRS complex has special characteristics such as sharp rising and falling edges, so a derivative based operator should be used in R-wave detection. The raw ECG signal may include different kinds of noise and artefacts [low and/or high frequency (LF and/or HF] noise, baseline drift etc.) so, R detection algorithms can give incorrect results. Therefore, three different R detection algorithms (based on TEO, wavelet transform and template matching) were examined. Since TEO is cost-effective, reliable method and according to results, it was preferred to detect R peaks (18,19).
Teager Energy Operator
TEO is defined as a nonlinear signal carrier operator, and it was firstly used to estimate the envelope of amplitude modulated signal (20). This method has successfully been used in various signal processing applications and some biomedical applications (21-25). In discrete-time, TEO is given in equation 1:
(1) TEO depending on the first two difference of the signal is used as an energy operator. It intensifies the instantaneous changes such as R peak, while it suppresses the LF components (P and T waves) and background level (20).
Hjorth Parameters
Hjorth parameters, called activity, mobility and complexity, are depending on activity changes between adjacent segments in the same signal. These parameters were firstly introduced by Hjorth which characterized with the EEG pattern in terms of amplitude, time scale, and slope spread (26,27). The signal power, mean frequency of signal and change in signal frequency could be defined as an activity, mobility and complexity in time domain, respectively. Therefore, instantaneous changes in the signal could be investigated with Hjorth parameters. This useful method was motivated us to use complexity in ECG signals. The activity is the variance of signal x(n) and it is given in equation 2. The mobility is the square root of variance of first derivation of signal divided to variance of signal descirebed in equation 3. The complexity is the mobility of first derivation of signal divided to mobility of signal shown in equation 4 (28).
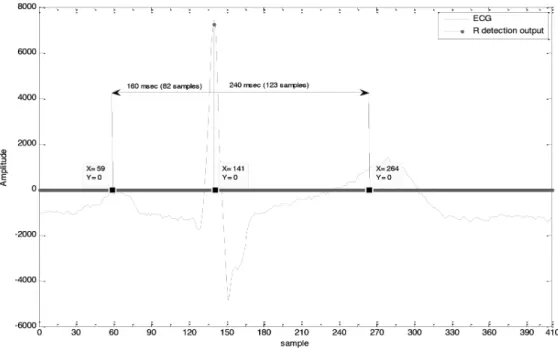
(2) (3) (4) The complexity is a morphological feature of transitions between the P, QRS and T waves which are related to cardiovascular and electrical circulation in the heart. In case of the sleep apnea, sufficient amount of blood is not pumped to tissues by heart due to blood oxygen deficiency, which affects the coherence of ventricular and atrial contractions. A normal ECG waveform is about 700 msec and QRS complex is about 400 msec. For this reason, the complexity was calculated over 160 msec before and 240 msec after R wave (29). The time intervals used to calculate the complexity are shown in Figure 2.
Heart Rate Variability Analysis
HRV is the physiological representation of heartbeats variation in the time intervals (30). In HRV analysis, the RR interval detection has to be as accurate as possible. In recent years, great emphasis was given to the research of HRV during sleep and the obtained parameters have been used not only for a better understanding of the sleep physiology, but also evaluation of sleep disorders.
There are many features in both time and frequency domains of HRV and several methods are used for the determination of these features. These are classified as short-term (5 min) and long-term (24 hours). ECG raw data is analyzed with many time and frequency domain statistical methods (30). In spectral analysis of HRV, HF (HF, 0.15- 0.4 Hz), LF (LF, 0.04-0.15 Hz) and very LF (VLF, 0.003-0.04 Hz) parameters are known as spectral components. LF and HF are approximately 95% of total power. The increase in the LF is observed in physical activity, mental stress, moderate exercise, standing, a coronary artery occlusion and moderate hypotension. The increase in the HF could be depending on controlled respiration (30). The LF/HF
ratio is the one of HRV feature that is a considerable indicator for the respiratory disorders (23,30,31). In this work, the power spectrum of HRV was computed and then the LF/HF ratio was calculated.
The Electroencephalogram Analysis
The analysing of the specific waveforms or the sub-bands of EEG is an important approach in the sleep researches (32,33). The EEG raw signal is composed of delta, theta, alpha, and beta waveforms. The power spectrum and the EEG sub-band energy analysis were performed on PSG records in earlier studies. Some of them reported that respiration events or some kinds of sleep disorders are related to the variation of EEG energy and power spectral density (23,33,34).
Electroencephalogram Sub-band Decomposition
The wavelet transform is a suitable method for the non-stationary signals (22,32,35). The EEG signal is non-non-stationary and has highly complex time-frequency characteristics (35). The wavelet transform provides a varying window size, as wide at low-frequencies and narrow at high frequencies. Thus, the optimum time-frequency resolution can be obtained in all frequency ranges (36). The wavelet transform is applied in two different ways, including continuous and discrete (37). Calculation of the wavelet coefficients is difficult and time consuming for each scale due to the continuous change of the scale and the continuous wavelet transformation parameters. Therefore, the discrete wavelet transform (DWT) is more frequently used (32).
The DWT provides a sub-band decomposition of a given signal x(n) into a set of approximation and detail coefficients (35). In the first step, the original signal x(n) is passed through a high-pass filter g(n) and low high-pass filter h(n). This process includes one level of decomposition and it can be expressed in equation 5 and 6.
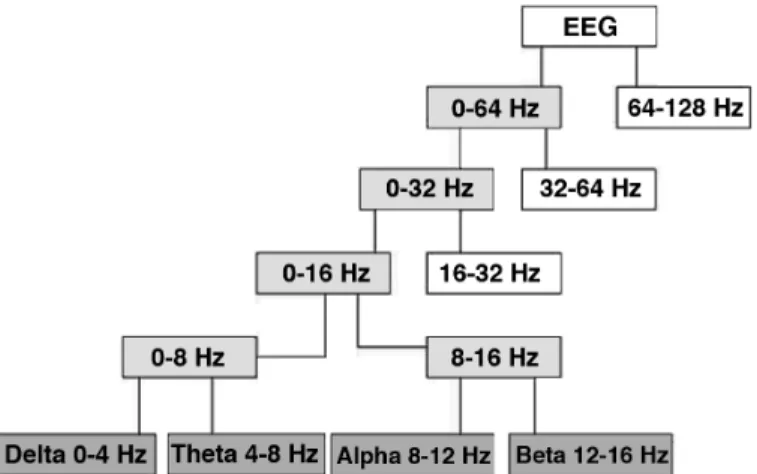
(5) (6) Here, Yhigh (k) and Ylow (k) are the outputs of the high pass and low pass filters respectively. This process can be repeated consecutively, and the desired frequency intervals are obtained. Sub-band decomposition of EEG signal which is called the wavelet decomposition tree is given in Figure 3.
The choice of the wavelet basis function and the number of decomposition levels is based on the features of the signal. In this study, five level decompositions were performed with order 4 Daubechies wavelet basis function (38). This wavelet shape fairly resembles the shape of the related EEG sub-band waveform. The number of decomposition level should provide a necessary sub-band of the signal.
The Sub-band Energy Calculation
The energy (E) of a signal x(n) over the finite interval (-N ≤ n ≤ N) is defined as:
(7) The Wavelet coefficients were used to compute energy associated with each sub-bands. To calculate the sub-band energy, firstly the full-band EEG signal was decomposed into four sub-bands: delta (0-4 Hz), theta (4-8 Hz), alpha (8-12 Hz), and beta (12-16 Hz). The energy of each sub-band was then computed with using equation 7.
Statistical Analysis
In the statistical analysis, the patient records were divided into the clinically specific groups. These are depending on the value
Figure 2. Illustration of the time intervals of calculated complexity
of the pre and post-operative body mass index (BMI), AHI, RDI, SaO2 parameter and delta sleep duration.
We proposed a statistically based evaluation model described in Figure 4 in which we firstly classified the features as clinical and experimental. Both of feature types were performed with Kolmogorov-Smirnov and Shapiro-Wilk-W tests to determine the
distribution. After the descriptive test, the clinical features were found to be parametric and otherwise, experimental features were found to be non-parametric, accordingly. Therefore, a paired sample test which is a parametric statistical hypothesis test, was applied to the experimental data of clinical features. Moreover, the Wilcoxon Signed-Rank test which is a non-parametric statistical hypothesis test was applied to compare the values of the experimental features before and after surgery. In the tests, each patient was referred as a single mean value for each feature. Following the determination of significant features, we performed Cochran q and McNemar tests to reach a paired relation between clinical and experimental features that was determined significant in Stage 2 of proposed model.
Results
This section presents the experimental and statistical results from the analysis of ECG and EEG signals and the clinical features. The sample raw ECG signal with 30 seconds with detected R-peaks using TEO method is shown in Figure 5. First, all R-peaks were detected successfully and HRV signal was obtained from the R-peaks locations. A sample of HRV series obtained as a result of a 5-minute analysis is shown in Figure 6. The LF, HF and LF/HF parameters were calculated from HRV. The complexity was then obtained from ECG using Figure 3. Wavelet decomposition tree and sub-bands of the
electroencephalogram signal
EEG: Electroencephalogram
Figure 4. The flowchart of the proposed statistically based evaluation model
BMI: Body mass index, AHI: Apnea hypopnea index, RDI: Respiratory disturbance index, SaO2: Oxygen saturation, LF/HF: Low frequency/high frequency, ECG:
R-peak locations. Concurrently, the sub-band decomposition of EEG was performed with DWT. The energy of delta, theta, alpha, and beta sub-bands were calculated afterwards. The experimental features were calculated for full night sleep ECG and EEG data, both of which were collected from before and after surgery for the twenty-one OSA patients.
The LF/HF and complexity values which are calculated for all patient data are separately given in Table 1. Each LF/HF ratio was calculated with 5-minutes time intervals for full night sleep data, and mean values were considered for each patient. Similarly, the complexity was calculated in the adjacent signal parts with 30 seconds, and mean values were evaluated. Lastly, the sub-band energy values were calculated in the adjacent signal parts with 30 seconds and normalized mean values were obtained. The calculated sub-band energies from the EEG that recorded before and after surgery are separately given in Table 2.
Patients were divided into five groups for statistical analysis according to the values of BMI, AHI, RDI, SaO2 parameter, snoring index, and delta sleep duration. The analysis results are shown in Table 3. Changes of the parameters in the groups
are represented by arrows in Table 4 (i.e., 9 patients have increased, arrow-up, post-operative AHI, whereas 12 of them have decreased, arrow-down, value in the AHI group).
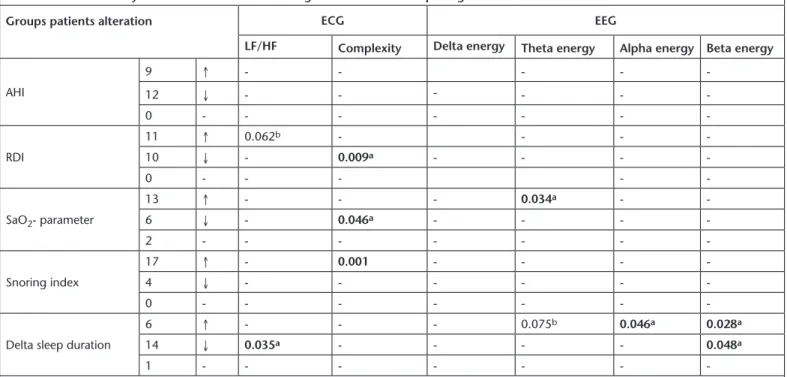
In the statistical analysis, the p-threshold value was taken as 0.05, the Wilcoxon Signed-Rank test was separately applied to the features obtained from the ECG and EEG before and after the surgery. The results showed that the LF/HF ratio was significant (p=0.035) for the patients who had low post-operative delta sleep duration. Moreover, the sub-band energies of both alpha and beta waves were significant (p=0.028 and p=0.046, respectively) for the patients who had high post-operative delta sleep duration. In addition, it was also observed that energy of beta wave was significant (p=0.048) for the patients who had low post-operative delta sleep duration. Besides these findings, the energy of theta wave was significant (p=0.034) for the patients who had high post-operative SaO2 -parameter. In addition, complexity was significant for the patients who had low post-operative RDI (p=0.009) and SaO2 parameter (p=0.046). The change in complexity was found inversely proportional to the reductions in the SaO2 parameter.
Figure 5. 30 sec (15360 samples) electrocardiogram signals, teager energy operator output and detected R peaks
ECG: Electrocardiogram, TEO: Teager energy operator
Table 1. The calculated low frequency/high frequency and complexity values before and after surgery for the twenty-one obstructive sleep apnea patients Patient 1 2 3 4 5 6 7 8 9 10 11 Pre LF/HF 0.90 2.01 2.38 0.95 1.25 1.38 2.00 2.26 1.24 2.30 1.70 Pre complexity 2.32 2.37 3.08 3.16 2.50 1.75 2.25 2.68 2.48 1.27 1.76 Post LF/HF 1.49 1.87 3.89 0.52 1.31 1.95 1.67 3.70 1.67 1.79 1.57 Post complexity 2.09 2.68 1.87 1.90 2.69 1.82 2.22 1.28 2.44 2.37 1.87
Table 1. The calculated low frequency/high frequency and complexity values before and after surgery for the twenty-one obstructive sleep apnea patients (continue)
Patient 12 13 14 15 16 17 18 19 20 21 Pre LF/HF 2.58 1.02 2.01 1.88 2.19 1.23 1.06 1.63 1.09 3.44 Pre complexity 2.93 2.47 2.25 2.75 3.22 2.03 2.22 1.51 2.03 1.83 Post LF/HF 1.69 1.46 1.58 1.06 2.09 2.33 1.27 2.25 1.36 1.79 Post complexity 1.23 1.23 2.58 3.85 2.01 1.83 1.89 1.34 2.09 2.45
LF/HF: Low frequency/high frequency
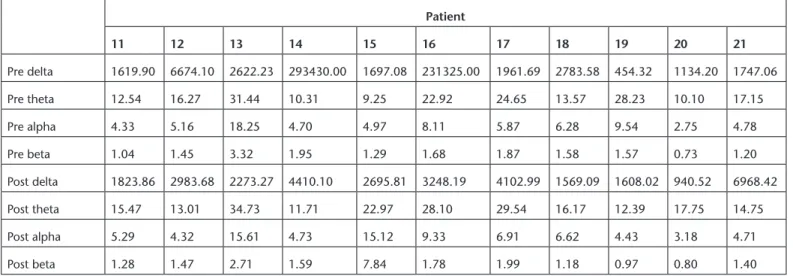
Table 2. The calculated sub-band energy values before and after surgery for the twenty-one obstructive sleep apnea patients Patient 1 2 3 4 5 6 7 8 9 10 Pre delta 1462.90 2111.33 8122.95 2248.69 6940.04 1992.63 7213.21 18889.68 981.70 3665.73 Pre theta 15.63 10.86 23.63 13.63 25.71 9.96 34.24 22.16 39.52 11.77 Pre alpha 4.48 3.84 10.06 4.90 7.47 3.72 8.98 10.47 9.12 5.04 Pre beta 1.06 0.84 1.84 1.20 1.75 0.91 1.48 1.84 1.38 1.36 Post delta 2821.93 1885.49 7638.38 1839.26 1664.26 1522.85 1874.78 1345.38 981.70 843.60 Post theta 22.39 13.65 20.81 19.21 24.53 9.23 15.79 17.35 39.52 13.48 Post alpha 6.03 4.81 9.41 5.63 6.79 3.25 6.14 8.38 1.38 5.56 Post beta 1.48 1.24 1.67 0.94 1.16 0.75 1.22 1.96 1.38 1.40
Table 2. The calculated sub-band energy values before and after surgery for the twenty-one obstructive sleep apnea patients (continue) Patient 11 12 13 14 15 16 17 18 19 20 21 Pre delta 1619.90 6674.10 2622.23 293430.00 1697.08 231325.00 1961.69 2783.58 454.32 1134.20 1747.06 Pre theta 12.54 16.27 31.44 10.31 9.25 22.92 24.65 13.57 28.23 10.10 17.15 Pre alpha 4.33 5.16 18.25 4.70 4.97 8.11 5.87 6.28 9.54 2.75 4.78 Pre beta 1.04 1.45 3.32 1.95 1.29 1.68 1.87 1.58 1.57 0.73 1.20 Post delta 1823.86 2983.68 2273.27 4410.10 2695.81 3248.19 4102.99 1569.09 1608.02 940.52 6968.42 Post theta 15.47 13.01 34.73 11.71 22.97 28.10 29.54 16.17 12.39 17.75 14.75 Post alpha 5.29 4.32 15.61 4.73 15.12 9.33 6.91 6.62 4.43 3.18 4.71 Post beta 1.28 1.47 2.71 1.59 7.84 1.78 1.99 1.18 0.97 0.80 1.40
Discussion
The UPF has become a popular option in the surgical treatment of OSA and snoring regarding its benefits over UPPP. The assessment of UPF is a challenging topic and hence, there are lots of prospective studies. Although UPF has advantages over UPPP in the surgical treatment of OSA, it has been reported in some studies that this surgical method is not an absolute solution according to clinical observations. For example, in some patients, findings such as post-operative complications, transient nasal regurgitation, moderate pain, snoring, and repetition of preoperative complications have been reported (39-41). These clinical evaluations are based on the examination of the physician, but also include the patient’s subjective feedback. The main reasons of the variations in the assessment of the UPF may be related to its little modifications and the nature of human physiological variety. As a consequence, there
is no study in which the success of the UPF surgery has been objectively assessed.
Although much of information regarding OSA surgery is clinically evaluated, the quantitative and objective evaluation criteria obtained by the signal processing methods were presently lacking. Therefore, in this work, the success of UPF surgery in the short-term was assessed for the pre-and post-operative patient records that were supported by the clinical observation of sleep experts using signal processing techniques. Firstly, the detailed history was obtained for each patient who was referred to the clinic for complaints of apnea before surgery, and then the post-operative assertion from the patients and their spouses were obtained. In accordance with the clinical and experimental features, a statistically based evaluation model was performed. This approach has three stages in which there are several statistical methods mentioned in the previous section.
Table 3. Statistical analysis results of the clinical features
Parameter Pre-UPF (Mean ± SD) Post-UPF (Mean ± SD) p value (p<0.05)
BMI (kg/m2) 28.6±3.5 28.6±3.8 0.065
AHI (count/hr) 16.3±9.2 14.8±11 0.756
RDI (count/hr) 17.3±8.9 17.7±11 0.726
Snoring Index (count/epoch) 1.8±1.4 0.7±0.99 0.012
SaO2 (%) 82.8±6.3 82.1±7.6 0.689
SaO2-parameter (min) 9.8±13.3 19.6±38.2 0.026
Delta sleep duration (min) 75±9 60.5±7.5 0.038
BMI: Body mass index, AHI: Apnea hypopnea index, RDI: Respiratory disturbance index, SaO2: Oxygen saturation, UPF: Uvulopalatal flap, SD: Standard deviation
Table 4. Statistical analysis results of the electrocardiogram and electroencephalogram features
Groups patients alteration ECG EEG
LF/HF Complexity Delta energy Theta energy Alpha energy Beta energy
AHI 9 ↑ - - - - -12 ↓ - - - -0 - - - -RDI 11 ↑ 0.062b - - - -10 ↓ - 0.009a - - - -0 - - - - -SaO2- parameter 13 ↑ - - - 0.034a - -6 ↓ - 0.046a - - - -2 - - - -Snoring index 17 ↑ - 0.001 - - - -4 ↓ - - - -0 - - -
-Delta sleep duration
6 ↑ - - - 0.075b 0.046a 0.028a
14 ↓ 0.035a - - - - 0.048a
1 - - -
-a: Strong presumption b: Low presumption, ECG: Electrocardiogram, EEG: Electroencephalogram, LF/HF: Low frequency/high frequency, AHI: Apnea hypopnea index, RDI:
In the first stage, we used paired t-test to nominal disturbed data which is composed of clinical features. Clinical parameters, snoring index, SaO2 parameter and delta sleep duration were significantly changed after surgery. Conversely, there was no change in others. In the second stage, we investigated whether there is a correlation between clinical features except for BMI and numerical features obtained from the ECG and EEG signals. For this purpose, the Wilcoxon Signed-Rank test was applied to compare the values of pre- and post-experimental features. Each patient is referred to as a single mean value for each feature. According to test results, there is a relation between complexity and respiratory events. Also, the LF/HF ratio may be a cumulative indicator of deep sleep duration in patient. Respiratory events are generally based on mechanical problems that indirectly affect the EEG parameters during sleep. It is important to note that these significant parameters in respiratory events are more valuable because they may be a direct indicator of respiratory problems. Eventually, we focused on complexity that has been observed as significant in RDI and SaO2 parameter. In third stage, the Cochran q and McNemar’s tests were applied to find any correlation between them. For this, each feature was dichotomized to 0 or 1 prior to applying test. In the Cochran q test, we assigned negative hypothesis h0 that means any parameters cannot be an indicator of the success of UPF and h1 is opposite hypothesis. Considering the results of Cochran q test, the input parameters of stage-3 are significant for the success of UPF (h1 hypothesis accepted). We found the paired relation between them with using the McNemar’s test. Then, significant results were found, and hence, the remarkable finding that there is a strong relation between preoperative complexity-RDI (0.002), post-operative complexity-RDI (p=0.039), preoperative complexity-snoring index (p=0.000), post-operative complexity-snoring index (p=0.001). RDI, which is not significant according to the test results of pre- and post-operative clinical findings, was found to be directly related to the complexity feature obtained with the proposed method. This is a novel result for the literature.
Conclusion
Since the relation between ECG, EEG, and UPF have not been studied yet, we thought in this present study that signal processing methods are a necessary topic for expert sleep physicians to figure out the basic reason of the underlying insufficiency of OSA surgery. The quantitative evaluating of OSA surgery is a very challenging topic that is often composed of clinical remarks. Innovatively in this study, we merged the clinical and experimental terms in our evaluating approach. From this aspect, the presented study contributes to solving of surgery assessment problems. This study demonstrated that complexity is statistically significant for UPF operated patients in respect to their RDI, SaO2 measurements and snoring index with a novel statistically based evaluating model. According to our evaluating approach, complexity could be considered as an assessment parameter in respect to RDI and snoring-index. Based on the results of this study, we, therefore, suggest that the complexity parameter should be also used as a predicting criterion prior to UPF surgery by sleep physicians. The most valuable result of this work is that
pre-operative complexity is correlated with RDI and snoring index. This means that complexity feature can be a predictor prior to surgery.
In future work, this pilot study can be reproduced in a prospective cohort study, and the reliability of the observations could be improved through using this method. Moreover, complexity may be analyzed with parameters of EEG, and alterations based on sleep stages could be also observed.
Ethics
Ethics Committee Approval: Retrospective study. Informed Consent: Retrospective study.
Peer-review: Externally and internally peer-reviewed. Authorship Contributions
Surgical and Medical Practices: M.M., Concept: H.F., S.A., A.E., Design: A.E., H.F., Data Collection or Processing: H.F., M.M., T.B., A.E., Analysis or Interpretation: S.A., O.E., Literature Search: T.B., A.E., Writing: A.E., T.B.
Conflict of Interest: None of the authors has any conflict of
interest.
Financial Disclosure: There is no financial support in the study.
References
1. Moyer CA, Sonnad SS, Garetz SL, Helman JI, Chervin RD. Quality of life in obstructive sleep apnea: a systematic review of the literature. Sleep Med 2001;2:477-91.
2. Xu W, Liu X. Sleep apnea assessment by ECG pattern. Image and Signal Processing, 2009.
3. Berry RB, Brooks R, Gamaldo CE, Harding SM, Marcus C, Vaughn BV. The AASM manual for the scoring of sleep and associated events. Rules, terminology and technical specifications. 2015.
4. Berry RB, Wagner MH. Sleep medicine pearls. Elsevier Health Sciences, 2014.
5. Mehra P, Wolford LM. Surgical management of obstructive sleep apnea. Baylor University Medical Center. Proceedings, Baylor University Medical Center, 2000;13:338.
6. Fujita S, Conway W, Zorick F, Roth T. Surgical correction of anatomic abnormalities in obstructive sleep apnea syndrome: uvulopalatopharyngoplasty. Otolaryngol Head Neck Surg 1981;89:923-34.
7. Zhou TC, Hsia JC. The uvulopalatal flap. Operative Techniques in Otolaryngology 2015;26:78-84.
8. Li KK. Surgical therapy for adult obstructive sleep apnea. Sleep Med Rev 2005;9:201-9.
9. Won CH, Li KK, Guilleminault C. Surgical treatment of obstructive sleep apnea: upper airway and maxillomandibular surgery. Proc Am Thorac Soc 2008;5:193-9.
10. Ravesloot MJ, de Vries N. Reliable calculation of the efficacy of non-surgical and non-surgical treatment of obstructive sleep apnea revisited. Sleep 2011;34:105-10.
11. Lu SJ, Chang SY, Shiao GM. Comparison between short-term and long-term post-operative evaluation of sleep apnoea after uvulopalatopharyngoplasty. J Laryngol Otol 1995;109:308-12. 12. Bakker JP, Campana LM, Montesi SB, Balachandran J, DeYoung PN,
Smales E, Patel SR, Malhotra A. A pilot study investigating the effects of continuous positive airway pressure treatment and weight-loss surgery on autonomic activity in obese obstructive sleep apnea patients. J Electrocardiol 2014;47:364-73.
13. Hsu CC, Wu JH, Chiu HC, Lin CM. Evaluating the sleep quality of obstructive sleep apnea patients after continuous positive airway pressure treatment. Comput Biol Med 2013;43:870-8.
14. Penzel T, Riedl M, Gapelyuk A, Suhrbier A, Bretthauer G, Malberg H, Schöbel C, Fietze I, Heitmann J, Kurths J, Wessel N. Effect of CPAP therapy on daytime cardiovascular regulations in patients with obstructive sleep apnea. Comput Biol Med 2012;42:328-34. 15. Bayrak T, Koçak O, Fırat H, Mutlu M, Telatar Z, Ardıç S, Eroğul O,
Erdamar A. Uyku Apnesi Parametrelerinin Cerrahi Tedavi Öncesi ve Sonrasında Araştırılması. 13. Ulusal Uyku Tıbbı Kongresi, Antalya, Türkiye 2012.
16. Iber C, Ancoli-Israel S, Chesson A, Quan SF. The AASM manual for the scoring of sleep and associated events: rules, terminology and technical specifications. Vol 1. American Academy of Sleep Medicine Westchester, IL, 2007.
17. Rechtschaffen A, Kales A. A manual of standardized terminology, techniques and scoring system for sleep stages of human subjects. 1968.
18. Akşahin M, Erdamar A, Fırat H, Ardıç S, Eroğul O. Obstructive sleep apnea classification with artificial neural network based on two synchronic hrv series. Biomed Eng Appl Basis Commun 2015;27:1550011.
19. Kamath C. A new approach to detect congestive heart failure using Teager energy nonlinear scatter plot of R-R interval series. Med Eng Phys 2012;34:841-8.
20. Hamila R, Astola J, Cheikh FA, Gabbouj M, Renfors M. Teager energy and the ambiguity function. IEEE Transactions on Signal Processing 1999;47:260-2.
21. Bovik AC, Maragos P, Quatieri TF. AM-FM energy detection and separation in noise using multiband energy operators. IEEE Transactions on Signal Processing 1993;41:3245-65.
22. Duman F, Erdamar A, Erogul O, Telatar Z, Yetkin S. Efficient sleep spindle detection algorithm with decision tree. Expert Syst Appl 2009;36:9980-5.
23. Erdamar A. A Model Development for Prediction of Sleep Apnea and Stimulation of Genioglossus Muscle. Ankara, Turkey, Hacettepe University, 2007.
24. Maragos P, Kaiser JF, Quatieri TF. On amplitude and frequency demodulation using energy operators. IEEE Transactions on signal processing 1993;41:1532-50.
25. Teager H. Some observations on oral air flow during phonation. IEEE Transactions on Acoustics, Speech, and Signal Processing 1980;28:599-601.
26. Hjorth B. EEG analysis based on time domain properties. Electroencephalogr Clin Neurophysiology 1970;29:306-10.
27. Hjorth B. The physical significance of time domain descriptors in EEG analysis. Electroencephalogr Clin Neurophysiol 1973;34:321-5. 28. Vidaurre C, Krämer N, Blankertz B, Schlögl A. Time domain
parameters as a feature for EEG-based brain-computer interfaces. Neural Netw 2009;22:1313-9.
29. Rangayyan RM. Biomedical signal analysis: a case-study approach. IEEE Press; Wiley-Interscience, Piscataway, NJ New York, NY, 2002. 30. No authors listed. Heart rate variability: standards of measurement,
physiological interpretation and clinical use. Task Force of the European Society of Cardiology and the North American Society of Pacing and Electrophysiology. Circulation 1996;93:1043-65.
31. Yetkin S, Erdamar A, Yokuşoğlu M, Özgen F, Aydin H. Panik bozukluğu hastalarında uykuda kalp hızı değişkenliği. J Turk Sleep Med 2014;1:28-32.
32. Erdamar A, Duman F, Yetkin S. A wavelet and teager energy operator based method for automatic detection of K-Complex in sleep EEG. Expert Syst Appl 2012;39:1284-90.
33. Poyares D, Guilleminault C, Rosa A, Ohayon M, Koester U. Arousal, EEG spectral power and pulse transit time in UARS and mild OSAS subjects. Clin Neurophysiol 2002;113:1598-606.
34. Xavier P, Behbehani K, Watenpaugh D, Burk JR. Detecting electroencephalography variations due to sleep disordered breathing events. Engineering in Medicine and Biology Society, 2007. EMBS 2007. 29th Annual International Conference of the IEEE, IEEE, 2007;6097-100.
35. Semmlow JL. Biosignal and biomedical image processing: MATLAB-based Applications, 2004.
36. Cohen L. Time-frequency distributions-a review. Proceedings of the IEEE 1989;77:941-81.
37. Mertins A. Signal Analysis: Wavelets. Time-Frequency Transforms and Applications, Wiley 1999.
38. Goelz H, Jones RD, Bones PJ. Wavelet analysis of transient biomedical signals and its application to detection of epileptiform activity in the EEG. Clin Electroencephalogr 2000;31:181-91.
39. Labra A, Huerta-Delgado AD, Gutierrez-Sanchez C, Cordero-Chacon SA, Basurto-Madero P. Uvulopalatopharyngoplasty and uvulopalatal flap for the treatment of snoring: technique to avoid complications. J Otolaryngol Head Neck Surg 2008;37;256-9.
40. Neruntarat C. Uvulopalatal flap for obstructive sleep apnea: Short-term and long-Short-term results. The Laryngoscope 2011;121:683-7. 41. Powell N, Riley R, Guilleminault C, Troell R. A reversible uvulopalatal