CHARACTERIZATION OF BEAN (PHASEOLUS VULGARIS L.)
CULTIVARS GROWN IN TURKEY BY SDS-PAGE
OF SEED PROTEINS
İSMET BERBER1* AND FİKRET YAŞAR2
1
Department of Biology, Faculty of Arts and Science, Sinop University, 57000 Sinop, Turkey
2
Department of Horticulture, Faculty of Agriculture, Yüzüncü Yil University, 65080 Van, Turkey
*
Corresponding author’s E-mail: [email protected]
Abstract
In the present research, a total 28 bean cultivars grown in Turkey were characterized by the numerical analysis of seed protein profiles obtained by using sodium dodecyl sulphate polyacrylamide gel electrophoresis (SDS-PAGE) technique. The numerical analysis of seed protein profiles generated two major clusters at similarity levels of 82.52% or above. The first cluster included 5 reference bean cultivars at the intra-cluster similarity values of 91.25% or above. The second cluster comprised the all remaining genotypes at similarity values between 84.46% and 100%. Our results also indicated that Gina standard cultivar together with all eastern genotypes belonged to subcluster IIc, having the highest intra-cluster similarities between 95.54% and 100%. In this sense, it is suggested that probably there may be a very close genetic relationship between eastern genotypes and Gina cultivar. In conclusion, this study indicated that the numerical analysis of seed protein profiles offer no final answer to the identity of bean genotypes, however, the method can provide of extra banding pattern for the discrimination of bean genotypes cultivated in Turkey.
Introduction
Bean (Phaseolus vulgaris L.) originated in Latin America is an important legume providing a major protein source for human worldwide. In addition to the mature dry seed, freshly pods are often consumed as vegetable and the rest of the plants used as animal fodder. Various molecular techniques, including separate either individual proteins or the isozymes of special enzymes (Weeden, 1984; Koenig & Gepts, 1989; Belletti & Lotito, 1996; Lioli et al., 2005), phaseolin diversity (Shing 1989; Gepts, 1990; Duran et al., 2005) and PCR-based techniques such as RAPD and AFLP (Skrock & Neienhuis, 1998; Tiwari et al., 2005; Duran et al., 2005), are used to determine genetic diversity among bean germplasm.
Turkey is an important bean producer in the world, and several common bean cultivars are cultivated in Turkey on a larger scale especially in the Black Sea region (Balkaya & Yanmaz, 1999). Additionally, it is reported that some green bean genotypes are cultivated in the Gevaş and Erciş areas of Van province from the Eastern Anatolia region (Sarıkamış et al., 2009).
A number of researchers have employed successfully Sodium dodecyl sulphate polyacrylamide gel electrophoresis (SDS-PAGE) of seed proteins in the discrimination of various crop species, especially for the cultivars levels (Panda et al., 1986; Koenig et al., 1990; Karihaloo et al., 2002; Lioli et al., 2005; Yüzbaşıoğlu et al., 2008). The technique is rapid and generally free from environmental effects compared with the traditional morphological and other descriptive criteria derived from field trials (Cooke, 1984;
Gepts, 1990; Panella et al., 1993; Pekşen et al., 2005; Yüzbaşıoğlu et al., 2008). Moreover, it is reported that SDS-PAGE of seed proteins is potentially a useful identifier and descriptor for the purpose of seed certification and Plant Variety Rights (Gardiner et al., 1986; Panella et al., 1993, Duran et al., 2005).
The aim of the present study was to investigate the differentiation of 28 bean cultivars grown in Turkey by the numerical analysis of seed storage protein profiles obtained by using SDS-PAGE technique.
Materials and Methods
Plant materials: Seeds of a total of 28 bean cultivars, (Gevaş 24, Gevaş 69, Gevaş
64, Gevaş 57, Gevaş 35, Gevaş 38, Gevaş 26, Edremit, Erciş 16, Gina, Samsun 94, Samsun 98, Samsun 95, Samsun 101, Samsun Bodur, Samsun 100, Helden, Alman Ayşe, Şeker Oturak, Oturak Barbunya, Balkız Oturak, 4F-89 Fransız, Sazova 1949, Bolkar Oturak, Ferasetsiz 95, Sırık Barbunya, Kırkgünlük 21, Şeker Beyaz), were obtained from Department of Horticulture, Faculty of Agriculture, Yüzüncü Yil University (Van, Turkey).
Extraction of total seed proteins for SDS-PAGE: The dry cotyledons of 5-6 seeds per
sample were ground to flour and protein extractions were performed by the addition of 25 μL of modified SDS-samples buffer (0.06 M Tris-HCl, 2.5% Glycerol, 0.5% SDS, 1.25% β-mercaptoethanol, 0.1% TCA, 10 mM urea, 1 mM EDTA). The extracts were centrifuged at 10.500 rpm for 10 min., and the soluble proteins were denatured by keeping them in boiling water for 5 min.
SDS-PAGE: The soluble seed proteins were subjected to SDS-PAGE in gel slabs of 1
mm thickness (3.5 cm, 4% stacking and 15.5 cm, 12% resolving gels) as described by Laemmli (1970). Electrophoresis was performed with a discontinuous buffer system in a UVP Vertical Electrophoresis Unit (Cambridge, UK). The gel was run at 30 mA until the bromophenol blue marker had reached the bottom of the gel. Protein molecular masses were calculated on the basis of comparison with the following standards (PageRulerTM
Protein Ladder SDS-PAGE Standards, Fermentas, molecular weight range 10-200 kDa). After electrophoresis the gels rinsed out for 20 min in an isopropanol-acetic acid-water (1:3:6) solution, then for 5 min in methanol-acetic acid-water (3:1:6) solution. Then, the gels were stained for 6 h in 0.01% (w/v) Coomassie Brilliant Blue R-250. Afterwards, the gels were destained in a methanol-acetic acid-water (3:1:6) mixture until protein bands became clearly visible.
Protein profile analysis: The gels were scanned via a high resolution scanner (HP 3500
C, Hewlett Packard Co.) and the molecular weight of each band was determined by one-dimensional analysis software (Lab Image Version 2.6, Halle, Germany). Data were coded as 0 (absent) and 1 (present). A hierarchical cluster analysis was performed using the average linkage method and correlation coefficient distance. The dendrogram, based on the total seed protein patterns of bean cultivars, was constructed by the program Minitab for Windows, version 14.20 (Minitab Inc. Pennsylvania, USA).
Results
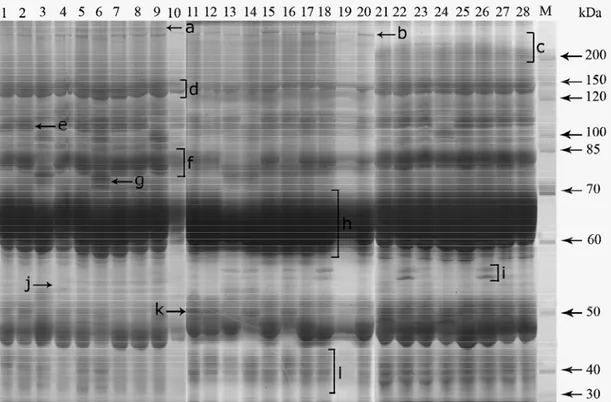
The total seed protein profiles of 28 bean cultivars, obtained by one-dimensional denaturing gel electrophoresis, are shown in Fig. 1. The protein patterns of the cultivars were inspected visually and compared with each other. SDS-PAGE analyses of cotyledon proteins exhibited high similarities between all bean genotypes in their low-molecular-mass range (between 30-70 kDa); however, several distinctive proteins were detected with molecular masses ranging from 70 to 256 kDa. Similarities in the profiles of bean cultivars were manifested by the existence of the protein bands b, d, f, h, j and l. The eastern cultivars (lines 1-9) were distinguished from the other all cultivars by the presence of single band marked as a. Besides, the eastern genotypes and Gina (line 10) were not including the binary protein band marked by i, except for the other reference cultivars. Gevaş 24 and Gevaş 69 genotypes (line 1 and 2) were discernable from all the remaining genotypes by the presence of the threefold protein band e. Gevaş 64 and Gevaş 38 genotypes (lines 3 and 6) were also very similar to protein patterns, and they distinguished from all cultivars by the existence of twice band g. Despite the fact that eight common cultivars (lines 21-28) displayed similar protein banding, they were discerned from all cultivars by the presence of the multiple-fold band marked as c. Two reference cultivars, named as Samsun 94 and Samsun 98 (lines 11 and 12) were differentiated from all cultivars by the existence of the protein band k.
The average linkage method and correlation coefficient distance cluster analysis based on SDS-PAGE profiles of seed proteins generated a dendrogram (Fig. 2). The dendrogram consisted in two major clusters (I and II) at similarity levels of 82.52% or above. The cluster I included 5 reference bean cultivars at the intra-cluster similarity values of 91.25% or above. The cluster II comprised the remaining cultivars, and it was branched three subclusters (IIa, IIb and IIc) at similarity levels between 84.46% and 100% (Fig. 2). The subcluster IIa includes 5 standard genotypes at the intra-cluster similarity degrees between 89.50% and 100%, from the Black Sea region and subcluster IIb had also 8 standard cultivars at the intra-similarity values changed between 94.17% and 100%. A single reference cultivar (Gina) together with nine genotypes, from the Gevaş and Erciş districts of Van province from the Eastern Anatolia, grouped into the subcluster IIc at the intra-similarity levels of 95.54% and 100%.
Discussion
Different kinds of electrophoretic methods based on cotyledon storage protein patterns have been used for the identification and the characterization of crop and herbage cultivars (Cooke, 1984; Gardiner et al., 1986; Panella et al., 1993; Karihaloo et al., 2002; Yüzbaşıoğlu et al., 2008). Some investigators proposed that seed protein profiles may be useful as an indicator of taxonomic relationships within some species (Cooke, 1984; Gardiner et al., 1986, Lioli et al., 2005; Duran et al., 2005), but ones said that this method was insufficient for the discrimination at the cultivar level (Panella et al., 1993; Yüzbaşıoğlu et al., 2008). Our findings indicated that SDS-PAGE of seed proteins supplied additional banding patterns for the discrimination of the bean genotypes, however; the differentiations were not sufficient in distinguishing among the cultivars. The results were in partial agreement with the findings of Balkaya &Yanmaz (2002).
Fig. 1. SDS-PAGE of total seed protein profiles of bean cultivars. Lines 1-28 refer to the bean cultivars (1; Gevaş 24, 2; Gevaş 69, 3; Gevaş 64, 4; Gevaş 57, 5; Gevaş 35, 6; Gevaş 38, 7; Gevaş 26, 8; Edremit, 9; Erciş 16, 10; Gina, 11; Samsun 94, 12; Samsun 98, 13; Samsun 95, 14; Samsun 101, 15; Samsun Bodur, 16; Samsun 100, 17; Helden, 18; Alman Ayşe, 19; Şeker Oturak, 20; Oturak Barbunya, 21; Balkız Oturak, 22; 4F-89 Fransız, 23; Sazova 1949, 24; Bolkar Oturak, 25; Ferasetsiz 95, 26; Sırık Barbunya, 27; Kırkgünlük 21, 28; Şeker Beyaz, respectively), and line M; molecular weight marker (10-200 kDa).
Fig. 4. Grouping of bean cultivars studied using hierarchical cluster analysis (average linkage and correlation coefficient distance) based on total seed protein profiles obtained by SDS-PAGE.
Recently, several studies suggested that the application of numerical analysis, coupled with the utilization of a standardized identification system instead of simple quantitative comparison of protein patterns provides an effective approach to the investigation of taxonomic relationships among crop species (Karihaloo et al., 2002; Lioli et al., 2005; Yüzbaşıoğlu et al., 2008). Here in the present study, Minitab program was used to analyze the data because of the difficulties in the visual interpretation of SDS-PAGE of seed protein profiles. The numerical analysis of SDS-PAGE of seed protein profiles showed that each cluster had slight discriminative protein banding. For example, the cluster I include 5 of reference bean cultivars (lines 15, 17-20), sharing many protein bands. All members of the subcluster IIa were from Black Sea region, whereas the subcluster IIc consisted in Gina standard cultivar together with all genotypes from the Eastern Anatolia part of Turkey, having the highest intra-cluster similarities (between 95.54% and 100%). This case confirmed that there may be a very close genetic relationship between eastern genotypes and Gina cultivar. Additionally, our findings showed that Black Sea region genotypes were similar to eastern genotypes. However, some at least of the differences in seed protein profile could be observed due to probably different environmental and climatic conditions of two regions.
Sarıkamış et al., (2009) reported that there was low level of DNA polymorphism among the eastern genotypes and two reference bean cultivars in Turkey. Our findings were in correlated with the results of this study that said the genetic relatedness among the genotypes could be as a result of the relatively close proximity of the collection sites and probably to the breeders’ intensive selection. According to the SDS-PAGE results gathered from the study, it can be suggested that Turkish bean genotypes and common bean cultivars grown in Turkey come from a narrow gene pool.
In conclusion, this study indicated that the numerical analysis of seed protein profiles were not sufficient as a typing tool for the differentiation of bean genotypes, however, the method can provide useful information in order to distinguish Turkish bean lines and standard cultivars.
References
Balkaya, A. and R. Yanmaz. 2002. Morphological properties of cultivar nominate selected Black Sea Region bean populations and identification by protein markers. Ankara Univ. J. Agric. Sci., 9: 182-188.
Belletti, P. and S. Latito. 1996. Identification of runner bean genotypes, Phaseolus vulgaris L., by means of isozyme analysis. J. Genet. Breed., 50: 185-190.
Cooke, R.J. 1984. The characterization and identification of crop cultivars by electrophoresis. Electrophoresis, 5: 59-72.
Duran, M.W., M.C. Blair, R. Giraldo, E. Macchiavelli, J.C. Prophete, J.C. Nin and J.S. Beaver. 2005. Morphological and Molecular Chacterization of Common Bean Landraces and Cultivars from the Caribbean. Crop Science, 45: 1320-1328.
Gardiner, S.E., M.B. Forde and C.R. Slack. 1986. Grass cultivar identification by sodium dodecyl sulphate polyacrylamide gel electrophoresis. New Zealand J Agric. Res., 29: 193-206.
Gepts, P. 1990. Origin and evolution of common bean: past events and recent trends. HortScience, 33: 1124-1130.
Karihaloo, J.M., M. Kaur and S. Singh. 2002. Seed protein diversity in Solanum melongena L., and its wild and weedy relatives. Genet. Resources Crop. Evol., 49: 533-539.
Koenig, R.L., S.P. Singh and P. Gepts. 1990. Novel phaseolin types in wild and cultivated common bean (Phaseolus vulgaris, Fabaceae). Econ. Botany, 44: 50-60.
Konig, R. and P. Gepts. 1989. Allozyme diversity in wild Phaseolus vulgaris: further evidence for two major centers of genetic diversity. Theor. Appl. Genet., 78: 809-817.
Laemmli, U.K. 1970. Cleavage of structural proteins during the assembly of the head of bacteriophage T4. Nature (London), 227: 680-685.
Lioli, L., A.P. Piergiovanni, D. Pignone, S. Puglisi, M. Santantonio and G. Sonnante. 2005. Genetic diversity of some surviving on-farm Italian common bean (Phaseolus vulgaris L.) landraces. Plant Breed., 124: 576-581.
Panda, R.C., O.A. Kumar and K.G. Raja Roa. 1986. The use of seed protein electrophoresis in the study of phylogenetic relationships in chili pepper (Capsium L.). Theor. Appl. Genet., 72: 665-670.
Panella, L., J. Kami and P. Gepts. 1993. Vignin Diversity in Wild and Cultivated Taxa of Vigna unguiculata (L.) Walp. (Fabaceae). Econ. Botany, 47: 371-386.
Pekşen, E., C. Artık and B. Palabıyık. 2005. Determination of genotypical differences for leaf characteristics in Cow pea (Vigna unguiculata L. Walp.) Genotypes. Asian J. Plant Sci., 4: 95-97.
Sarıkamış, G., F. Yaşar, M. Bakır, K. Kazan and A. Ergül. 2009. Genetic characterization of green bean (Phaseolus vulgaris) genotypes from eastern Turkey. Genet. Mol. Res., 8: 880-887. Singh, S.P. 1989. Patterns of variation in cultivated common bean (Phaseolus vulgaris, Fabaceae).
Econ. Botany, 43: 39-57.
Skroch, P.W. and J. Nienhuis. 1998. Comparison of Mexican common bean (Phaseolus vulgaris L.) core and reserve germplasm collections. Crop Science, 38: 488-496.
Tiwari, M., N.K. Singh, M. Rathore and N. Kumar. 2005. RAPD markers in the analysis of genetic diversity among common bean germplasm from Central Himalaya. Genet. Res. Crop Evol., 52: 315-324.
Weeden, N.F. 1984. Distinguishing among white seeded bean cultivars by means of allozyme genotypes. Euphytica, 33: 199-208.
Yüzbaşıoğlu, E., L. Açık and S. Özcan. 2008. Seed protein diversity among lentil cultivars. Biologica Plantarum, 52: 126-128.