Full Terms & Conditions of access and use can be found at
https://www.tandfonline.com/action/journalInformation?journalCode=kaup20
ISSN: 1554-8627 (Print) 1554-8635 (Online) Journal homepage: https://www.tandfonline.com/loi/kaup20
MITF-MIR211 axis is a novel autophagy amplifier
system during cellular stress
Deniz Gulfem Ozturk, Muhammed Kocak, Arzu Akcay, Kubilay Kinoglu,
Erdogan Kara, Yalcin Buyuk, Hilal Kazan & Devrim Gozuacik
To cite this article: Deniz Gulfem Ozturk, Muhammed Kocak, Arzu Akcay, Kubilay Kinoglu, Erdogan Kara, Yalcin Buyuk, Hilal Kazan & Devrim Gozuacik (2019) MITF-MIR211 axis is a novel autophagy amplifier system during cellular stress, Autophagy, 15:3, 375-390, DOI: 10.1080/15548627.2018.1531197
To link to this article: https://doi.org/10.1080/15548627.2018.1531197
View supplementary material
Accepted author version posted online: 05 Oct 2018.
Published online: 16 Oct 2018. Submit your article to this journal
Article views: 552
RESEARCH PAPER - BASIC SCIENCE
MITF
-MIR211 axis is a novel autophagy amplifier system during cellular stress
Deniz Gulfem Ozturka, Muhammed Kocaka, Arzu Akcayb, Kubilay Kinoglub, Erdogan Karab, Yalcin Buyukb, Hilal Kazanc,
and Devrim Gozuacik a,d,e
aSabanci University, Faculty of Engineering and Natural Sciences, Molecular Biology, Genetics and Bioengineering Program, Orhanli-Tuzla, Turkey; bCouncil of Forensic Medicine, Ministry of Justice, Bahcelievler, Turkey;cAntalya Bilim University, Faculty of Engineering, Department of Computer
Engineering, Antalya, Turkey;dCenter of Excellence for Functional Surfaces and Interfaces for Nano Diagnostics (EFSUN)Orhanli-Tuzla, Turkey; eSabanci University Nanotechnology Research and Application Center (SUNUM), Sabanci University, Orhanli-Tuzla, Turkey
ABSTRACT
Macroautophagy (autophagy) is an evolutionarily conserved recycling and stress response mechanism. Active at basal levels in eukaryotes, autophagy is upregulated under stress providing cells with building blocks such as amino acids. A lysosome-integrated sensor system composed of RRAG GTPases and MTOR complex 1 (MTORC1) regulates lysosome biogenesis and autophagy in response to amino acid availability. Stress-mediated inhibition of MTORC1 results in the dephosphorylation and nuclear translocation of the TFE/ MITF family of transcriptional factors, and triggers an autophagy- and lysosomal-related gene transcription program. The role of family members TFEB and TFE3 have been studied in detail, but the importance of MITF proteins in autophagy regulation is not clear so far. Here we introduce for the first time a specific role for MITF in autophagy control that involves upregulation ofMIR211. We show that, under stress conditions including starvation and MTOR inhibition, a MITF-MIR211 axis constitutes a novel feed-forward loop that controls autophagic activity in cells. Direct targeting of the MTORC2 component RICTOR byMIR211 led to the inhibition of the MTORC1 pathway, further stimulating MITF translocation to the nucleus and completing an autophagy amplification loop. In line with a ubiquitous function, MITF andMIR211 were co-expressed in all tested cell lines and human tissues, and the effects on autophagy were observed in a cell-type independent manner. Thus, our study provides direct evidence that MITF has rate-limiting and specific functions in autophagy regulation. Collectively, the MITF-MIR211 axis constitutes a novel and universal autophagy amplification system that sustains autophagic activity under stress conditions.
Abbreviations: ACTB: actin beta; AKT: AKT serine/threonine kinase; AKT1S1/PRAS40: AKT1 substrate 1; AMPK: AMP-activated protein kinase; ATG: autophagy-related; BECN1: beclin 1; DEPTOR: DEP domain containing MTOR interacting protein; GABARAP: GABA type A receptor-associated protein; HIF1A: hypoxia inducible factor 1 subunit alpha; LAMP1: lysosomal associated membrane protein 1; MAP1LC3B/LC3B: microtubule associated protein 1 light chain 3 beta; MAPKAP1/SIN1: mitogen-activated protein kinase associated protein 1; MITF: melanogenesis associated transcription factor; MLST8: MTOR associated protein, LST8 homolog; MRE: miRNA response element; MTOR: mechanistic target of rapa-mycin kinase; MTORC1: MTOR complex 1; MTORC2: MTOR complex 2; PRR5/Protor 1: proline rich 5; PRR5L/Protor 2: proline rich 5 like; RACK1: receptor for activated C kinase 1; RPTOR: regulatory associated protein of MTOR complex 1; RICTOR: RPTOR independent companion of MTOR complex 2; RPS6KB/ p70S6K: ribosomal protein S6 kinase; RT-qPCR: quantitative reverse transcription-polymerase chain reaction; SQSTM1: sequestosome 1; STK11/LKB1: serine/threonine kinase 11; TFE3: transcription factor binding to IGHM enhancer 3; TFEB: transcription factor EB; TSC1/2: TSC complex subunit 1/2; ULK1: unc-51 like autophagy activating kinase 1; UVRAG: UV radiation resistance associated; VIM: vimentin; VPS11: VPS11, CORVET/HOPS core subunit; VPS18: VPS18, CORVET/HOPS core subunit; WIPI1: WD repeat domain, phosphoinositide interacting 1
ARTICLE HISTORY
Received 18 September 2017 Revised 21 September 2018 Accepted 26 September 2018
KEYWORDS
Autophagy; cellular stress; lysosome; microRNA; MITF; MTOR; RICTOR
Introduction
Autophagy is an evolutionarily conserved catabolic pathway that is necessary for the maintenance of cellular homeosta-sis in eukaryotes [1]. Active at a basal level, autophagy may be upregulated in response to cellular stress conditions, including nutrient (e.g., amino acid) and growth factor deprivation, changes in ATP:ADP ratios, unfolded, mis-folded or mutant protein accumulation, oxidative stress
and hypoxia, etc [2]. Following autophagy activation, dou-ble-membrane compartments termed phagophores are formed in the cytosol, engulfing cytosolic components as well as organelles, such as mitochondria. The phagophores subsequently mature into autophagosomes. Fusion of autophagosomes with lysosomes results in the delivery of autophagy targets to lysosomes, and allows their degrada-tion and recycling [3].
CONTACTDevrim Gozuacik [email protected] Sabanci University. Faculty of Engineering and Natural Sciences, Molecular Biology, Genetics and Bioengineering Program, Orhanli-Tuzla, Istanbul 34956, Turkey; Center of Excellence for Functional Surfaces and Interfaces for Nano Diagnostics (EFSUN)Orhanli-Tuzla, Turkey; Sabanci University Nanotechnology Research and Application Center (SUNUM), Orhanli-(EFSUN)Orhanli-Tuzla, Turkey
Supplemental data for this article can be accessedhere. AUTOPHAGY
2019, VOL. 15, NO. 3, 375–390
https://doi.org/10.1080/15548627.2018.1531197
Autophagic activity is regulated by various upstream signal-ing pathways. The serine/threonine kinase MTOR negatively controls autophagy through inhibitory phosphorylations of the components of the key autophagy-related complex ULK1/2-ATG13 and through regulation of ATG5-RACK1 protein com-plexes [4,5]. The MTOR kinase is found in 2 different protein complexes: MTOR complex 1 (MTORC1) and MTORC2. MTORC1 is composed of the MTOR kinase and its positive (RPTOR and MLST8) and negative (AKT1S1/PRAS40 and DEPTOR) regulators [6,7]. Conversely, components of MTORC2 include RICTOR, MLST8, DEPTOR, MAPKAP1/ SIN1 and PRR5/PROTOR1-PRR5L/PROTOR2 [7,8]. Stability, integrity and function of the MTORC2 complex rely on the presence of various components, including RICTOR [9]. While MTORC2 is primarily regulated by INSR (insulin receptor)-phosphoinositide 3-kinase signaling [10], MTORC1 integrates signals emanating from the STK11/LKB1-AMPK, RAS-MAP2K1/MEK-MAPK1/ERK2-MAPK3/ERK1, WNT and AKT pathways converging at the level of TSC1/2, negative regulators of MTORC1 activity [11,12]. Yet, between these 2 major MTOR complexes crosstalk mechanisms exist and depend on signaling components, including AKT [13].
Another mode of regulation of MTORC1 is through RRAG proteins [14]. Amino acid availability is sensed by RRAG GTPases that control subcellular localization of MTORC1. In the presence of amino acids, MTORC1 complexes are recruited to lysosome membranes through active RRAG GTPase hetero-dimers (RRAGA/B-GTP and RRAGC/D-GDP), leading to their activation by RHEB proteins [12]. In fact, RRAG GTPases bind and recruit TFEB, TFE3 and MITF transcription factors to lysosomes, promoting their MTORC1-dependent phosphorylation, and their sequestration in the cytosol by YWHA/14–3-3 proteins [15]. Conversely, amino acid starva-tion shuts-off RRAG proteins, resulting in the inactivastarva-tion of MTORC1. Under these conditions, the ULK1/2-ATG13 com-plex is reactivated and can induce autophagy [4]. Moreover, TFEB, TFE3 and MITF transcription factors can be depho-sphorylated and then set free to translocate to the nucleus, and stimulate expression of genes coding for autophagy-lyso-some components. TFEB, TFE3 and MITF were reported to have partially overlapping autophagy- and lysosome-related targets (Table S1) [16–20]. Whereas the role of TFEB and TFE3 in this context has been studied in detail, whether MITF is indispensable and has a distinct function in autophagy regulation is yet to be established.
Recent studies introduced microRNAs (miRNAs) as new players in the control of autophagy. MiRNAs are 18–21 base pair protein non-coding small RNAs that fine tune cellular levels of transcripts. They do so through modulation of mes-senger RNA (mRNA) stability and/or through inhibition of protein translation [21]. Indeed, players in various steps of autophagy, including upstream regulatory pathways and core autophagy components, were reported to be targets of differ-ent miRNAs [22]. For example, we have previously shown that autophagy-inducing signals upregulated MIR376A and MIR376B that directly targeted key autophagy genes, ATG4C and BECN1, forming a gas and break mechanism, and preventing uncontrolled and excessive activation of autophagy under prolonged stress conditions [23–25].
Here, we introduce a novel MITF-MIR211 pathway of autophagy amplification. First, we showed that knockdown of MITF significantly attenuated starvation and MTOR inhi-bition-mediated autophagy, and established that MITF has a rate-limiting function in autophagy regulation. MITF-depen-dent control of autophagy required transcriptional activation of its specific target, MIR211. Overexpression of MIR211 potentiated both basal and MTOR-dependent autophagy, and its downregulation resulted in a decrease in the amplitude of autophagy. We determined that the MTORC2 component RICTOR was a rate limiting and direct target of MIR211. RICTOR downregulation by MIR211 attenuated the MTORC1 signal through an AKT-mediated crosstalk, further stimulating MITF translocation to the nucleus. We confirmed co-expression of MITF and MIR211 in tested cell lines and human tissues. All together, our results showed that a MITF-specific and MIR211-dependent feed-forward amplification mechanism is required for optimal autophagy activation under cellular stress conditions.
Results
MITF is required for starvation and MTOR inhibition-induced autophagy
Under basal conditions, TFEB and MITF transcription factors are phosphorylated by MTORC1 and sequestered in the cyto-sol [15]. Upon MTORC1 inhibition secondary to cellular stress, especially amino acid starvation, both factors migrate to the nucleus, and transactivate several lysosome- and autop-hagy-related genes. In previous studies, TFEB was introduced as a master regulator of lysosomal biogenesis [26,27]. Although some reports in the literature indicate that MITF contributes to autophagy control, detailed and convincing analyses are missing [15,16,28]. In order to evaluate whether MITF is indispensable for autophagy and that it has a specific function in autophagy regulation, we analyzed MITF function under classical autophagy-inducing conditions.
First, we overexpressed GFP-fused constructs of TFEB and MITF in HeLa cells. Under control conditions, TFEB (Figure S1(a,b)) and MITF (Figures 1(a–d) and S1(c)) proteins were cytosolic, and they were excluded from the nucleus. Upon treatment with autophagy inducers, the MTOR inhibitor torin1 or starvation, both TFEB (Figure S1(a,b)) and MITF (Figures 1(a–d) and S1(c)) translocated to nuclei in almost all analyzed cells as previously reported [29]. To clarify the role of MITF in this context, we analyzed autophagic activity in cells. We tested the effect of the overexpression of MITF-A (an alternative splicing isoform of MITF) in HeLa cells using the LC3 shift assay. In order to clarify whether the observed accumulation of the LC3-II form of the protein was a result of increased autophagic activity, and not a result of a block in autophagosome-lysosome fusion, we performed the experi-ments in the presence or absence of the lysosomal protease inhibitors E64D-pepstatin A. We observed that, upon treat-ment with torin1, extracts from cells that overexpressed MITF had higher levels of LC3-II and further accumulation was observed upon lysosomal inhibition confirming that MITF stimulated autophagosome formation and did not
prominently affect autophagosome-lysosome fusion (Figure 1 (e,f)). Similar results were obtained when starvation was used as an autophagy stimulus (Figure 1(g,h)).
To check whether endogenous MITF was a rate-limiting factor in autophagy activation by stress, we transfected cells with siRNAs targeting MITF (siMITF) or control siRNAs (siCNT), and checked autophagy levels under basal conditions or with autophagy inducers and in the presence or absence of the lysosomal inhibitors E64D-pepstatin A. Of note, we con-firmed that pan-MITF siRNAs that were used in this study could target all endogenous MITF isoforms (Figure S2(a,b)). Moreover, siRNA knockdown of MITF protein levels were confirmed and quantified for each and every experiment and their triple replicates (Figure S2(c–f)). Under these experi-mental conditions, GFP-LC3 dot formation analysis showed that knockdown of MITF significantly attenuated autophagy that was stimulated by torin1 in HeLa cells (Figure 1(i,j)). Interestingly, MITF downregulation could even suppress autophagy at basal levels (Figure 1(j)). Moreover, MITF-dependence of autophagy was confirmed by LC3-II shift assays that were performed in torin1- (Figure 1(k,l)) or star-vation- (Figure 1(m,n)) treated HeLa cells in the presence or absence of E64D-pepstatin A. Additionally, the inhibitory effect of MITF knockdown on torin1-induced autophagy was confirmed in SK-MEL-28 cells (human skin malignant melanoma cell line), using both GFP-LC3 dot formation assays (Figure 1(o,p)). These results were also confirmed in torin1- or starvation-treated SK-MEL-28 cells using LC3-II shift assays (Figure 1(q–t)). During autophagy activation, the phosphatidylinositol-3-phosphate (PtdIns3P) effector WIPI1 proteins are recruited to phagophores and form punctate patterns [30]. In line with LC3 tests, MITF knockdown sig-nificantly decreased GFP-WIPI1 dot formation following torin1 treatment (Figure 1(u,v)) or starvation (Figure 1(w,
x)). All these results clearly showed that MITF is required for the upregulation of autophagy in cells under stress.
To further confirm that MITF did not block autophago-some-lysosome fusion and increased the autophagic flux, we used 2 independent approaches. The GFP-RFP-LC3 tandem
fusion construct is commonly used to assess autophagosome and autolysosome numbers. Whereas GFP and RFP label autophagosomes, the GFP signal quenches in the lysosomes while the RFP signal remains, marking autolysosomes. Quantitative analysis of autophagosome and autolysosome numbers using this test showed that torin1 led to an increase in both autophagosome and autolysosome numbers, and the knockdown of MITF significantly decreased the numbers of both vesicle types (Figure S2(g,h)). Additionally, we used another flux test that was suggested in the autophagy guide-lines article [31], the GFP-LC3 lysosomal delivery and pro-teolysis test. Here, when GFP-LC3 is delivered to lysosomes, the LC3 part of the chimera is degraded, whereas the GFP protein that is relatively resistant to hydrolysis accumulates. Therefore, the appearance of free GFP on western blots can be used to monitor breakdown of the autophagosomal cargo. Using this test, we observed a robust accumulation of free GFP in torin1-treated cells, indicating increased flux and degradation. Knockdown of MITF almost completely abol-ished free GFP accumulation under these conditions. All of these results showed that MITF is required for autophagic activity in cells (Figure S2(i)). Therefore, MITF is a key regulator of MTOR inhibition- and starvation-induced autophagy.
Role of MITF-dependent transcriptional activation in autophagy control
Previous studies indicated that transcription of some autop-hagy-related genes, including LC3B and ATG10, are regulated in a MITF-dependent manner [16,31]. We tested the expres-sion of these autophagy genes following MITF knockdown under control, torin1 or starvation conditions. MITF knock-down significantly attenuated both basal, torin1- (Figure 2(a, b)) or starvation- (Figure 2(c,d)) induced expression of ATG10 (Figure 2(a,c)) and LC3B (Figure 2(b,d)). Using chro-matin immunoprecipitation (ChIP) experiments, we con-firmed that MITF could bind to the promoter of LC3B and, when autophagy was stimulated, MITF binding to the
Figure 1.MITF was required for starvation and MTOR inhibition-induced autophagy. (a and b) MITF translocated to nuclei of cells following torin1 (MTOR inhibitor) (a) or starvation (b) treatment. HeLa cells were transiently transfected with GFP-MITF-A vector and incubated with either torin1 (200 nM, 4 h) or in starvation medium (Earle’s Balanced Salt solution, 4 h, STV) and analyzed under a flourescence microscope. DMSO, carrier control. Non-STV, non-starved. Hoechst dye was used to stain the nuclei (blue). Scale bar: 10 µm. (c and d) Quantitative analysis of MITF nuclear translocation in the experimental set-up shown in A and B (mean± SD of n = 3 independent experiments, ***p < 0.01). (e) Overexpression of MITF-A amplified torin1-induced LC3-II (lipid-conjugated and autophagosome-associated LC3 form) formation in HeLa cells. LC3-I, free LC3 form. E + P, E64D (10 µg/ml) and pepstatin A (10 µg/ml) were used as lysosomal protease inhibitors. (f) Graph depicting quantification of LC3-II:ACTB ratios in the experimental set-up shown in E (mean± SD, n = 3 independent experiments, **p < 0.03, *p < 0.05). (g) Overexpression of MITF-A increased starvation-induced LC3-II formation in HeLa cells. (h) Graph depicting quantification of LC3-II:ACTB ratios in the experimental set-up shown in G (mean± SD, n = 3 independent experiments, *p < 0.05). (i) MITF knockdown bysiMITF attenuated torin1-induced GFP-LC3 puncta formation compared to control siRNA (siCNT)-transfected HeLa cells. Scale bar: 10 µm. (j) Quantitative analysis of GFP-LC3 dots in the experimental set-up shown in I (mean± SD of n = 3 independent experiments, **p < 0.03, *p < 0.05). (k) Immunoblots ofsiCNT- or siMITF-transfected HeLa cells that were treated with DMSO or torin1. (l) Graph depicting quantification of LC3-II:ACTB ratios in the experimental set-up shown in K (mean± SD, n = 3 independent experiments, ***p < 0.01). (m) Immunoblots of siCNT or siMITF transfected and non-starved or starved HeLa cells. (n) Graph depicting quantification of LC3-II:ACTB ratios in the experimental set-up shown in M (mean± SD, n = 3 independent experiments, ***p < 0.01). (o)siMITF blocked torin1-induced GFP-LC3 puncta formation in SK-MEL-28 cells. Scale bar: 10 µm. (p) Quantitative analysis of GFP-LC3 dots in the experimental set-up shown in O (mean± SD of n = 3 independent experiments,*p < 0.05). (q) Immunoblots ofsiCNT- or siMITF-transfected SK-MEL-28 cells that were treated with DMSO or torin1. (r) Graph depicting quantification of LC3-II:ACTB ratios in the experimental set-up shown in Q (mean± SD, n = 3 independent experiments, ***p < 0.01, **p < 0.03). (s) Immunoblots ofsiCNT- or siMITF-transfected and non-starved or starved SK-MEL-28 cells. (t) Graph depicting quantification of LC3-II:ACTB ratios in the experimental set-up shown in S (mean± SD, n = 3 independent experiments, ***p < 0.01, **p < 0.03, *p < 0.05). (u)siMITF blocked torin1-induced GFP-WIPI1 puncta formation in HeLa cells. Scale bar: 10 µm. (v) Quantitative analysis of GFP-WIPI1 puncta in the experimental set-up shown in U (mean± SD of n = 3 independent experiments, ***p < 0.01). (w)siMITF blocked starvation-induced GFP-WIPI1 puncta formation in HeLa cells. Scale bar: 10 µm. (x) Quantitative analysis of GFP-WIPI1 dots in the experimental set-up shown in W (mean± SD of n = 3 independent experiments, ***p < 0.01).
promoter was significantly increased in 2 different cell lines (Figure S3(a,b)).
Interestingly, a microRNA, MIR211, was reported to be a direct transcriptional target of MITF in a melanoma invasion and metastasis context [32,33]. Yet, whether MITF regulates
MIR211 under autophagy-inducing conditions in melanoma and epithelial cells, and whether it contributes to general autophagy control is not known. To confirm that MIR211 was expressed in HeLa cells, we performed qPCR analysis following control, torin1 or starvation treatment. Torin1
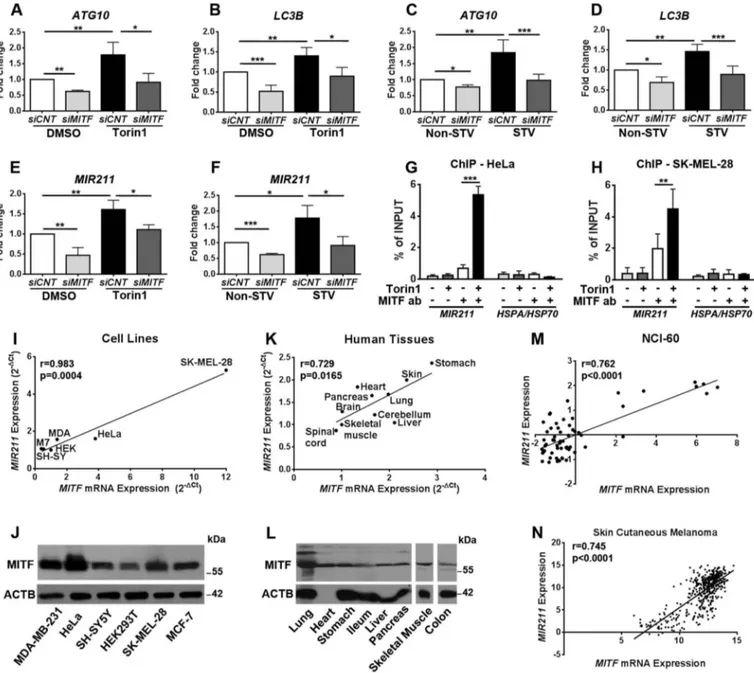
Figure 2.MITF regulated expression levels of autophagy-related genes andMIR211. (a-d) RT-qPCR analysis of mRNA levels of ATG10 (a and c) and LC3B (b and d) in control siRNA (siCNT)- or siMITF-transfected HeLa cells following torin1 (a and b) or starvation (c and d) treatment (mean± SD of n = 5 independent experiments ***p < 0.01, **< 0.03, *p < 0.05). DMSO, carrier control. Data were normalized toGAPDH. (e) TaqMan RT-qPCR analysis of MIR211 expression in DMSO or torin1-treated HeLa cells (mean± SD of n = 3 independent experiments, **p < 0.03, *p < 0.05). Data were normalized toRNU6-1 (RNA, U6 small nuclear 1) (U6). (f) TaqMan RT-qPCR analysis ofMIR211 expression in non-starved (Non-STV) or starved (STV) HeLa cells (mean± SD of n = 3 independent experiments, ***p < 0.01, *p < 0.05). Data were normalized toRNU6-1. (g and h) ChIP assays showing specific association of MITF with the MIR211 promoter region in HeLa (G) and SK-MEL-28 (H) cells under DMSO or torin1-treated conditions. qPCR results of MIR211 promoter primers were obtained from input (pre-IP) samples or following ChIP with MITF antibodies. Ct (threshold cycle) ratios were normalized (CtChIP/Ctinput). In control (CNT) ChIP experiments, no antibody was added.HSPA/HSP70 promoter primers were
used as negative control (mean± SD of n = 3 independent experiments, ***p < 0.01, **p < 0.03). (i) Correlation of endogenousMIR211 and MITF mRNA levels in various cell lines. A positive correlation between endogenousMIR211 and MITF mRNA levels was determined by RT-qPCR in MDA-MB-231 (MDA), MCF-7 (M7), SH-SY5Y (SH-SY), HEK293T (HEK), HeLa and SK-MEL-28 cells. r, Pearson’s correlation coefficient. (r > 0, positive correlation; p value = 0.004). (j) Expression of MITF protein was detected in MDA-MB-231, HeLa, SH-SY5Y, HEK293T, SK-MEL-28, MCF-7 cells using a pan-MITF antibody. (k) Correlation of endogenousMIR211 and MITF mRNA levels in human tissues from 4 different cadavers. A positive correlation between endogenousMIR211 and MITF mRNA levels was determined by RT-qPCR in the indicated tissues (Pearson’s r coefficient (r) = 0.729, p value (p) = 0.0165). (l) Immunoblot analysis of tissue protein extracts from a cadaver using a pan-MITF antibody. ACTB was used as loading control. (m and n) The correlation between miRNA and gene expression profile is quantified by computing the correlation coefficient using the NCI-60 expression profiling data (m) (Pearson’s r coefficient (r) = 0.762, p value (p)< 0.0001) and TCGA Skin Cutaneous Melanoma (n) (Pearson’s r coefficient (r) = 0.745, p value (p)< 0.0001) microRNA and gene expression data.
treatment significantly induced MIR211 expression in HeLa cells (Figure 2(e)). Under these conditions, introduction of MITF siRNA significantly decreased both basal and torin1-induced expression of MIR211 (Figure 2(e)). Similar results were obtained when starvation used was used as an autophagy inducer (Figure 2(f)). Moreover, in ChIP experiments, the amount of MITF protein bound to the MIR211 promoter region was significantly increased upon autophagy induction by torin1 in HeLa (Figure 2(g)) and SK-MEL-28 (Figure 2(h)) cells. Therefore, all these results showed for the first time that MITF controlled basal and autophagic stress-induced MIR211 levels in cells.
We also checked that MITF and MIR211 were co-expressed in several cell lines originating from different tissue types. A positive correlation was found between MIR211 and MITF mRNA expression in cell lines, includ-ing HeLa and SK-MEL-28 that were used as cellular mod-els in this study (Figure 2(i)). MITF protein expression in all these cell lines was also demonstrated by immunoblot-ting analysis (Figure 2(j)). Additionally, analyses of RNAs that were isolated from various human tissues showed a positive correlation between MIR211 and MITF (Figure 2 (k)). MITF protein expression was demonstrated in all studied human tissues as well (Figures 2(l) and S3(c)).
Next, correlation of MIR211 and MITF expression was checked in publicly available expression datasets: NCI-60 datasets obtained from 60 different cancer cell lines showed that MIR211 expression positively correlated with MITF expression in these cell lines (Figure 2(m)) (r = 0.762, p < 0.0001). The Cancer Genome Atlas (TCGA) cancer tissue data subsets were also analyzed. Subsets providing suitable sample size (see Materials and Methods) were skin cutaneous melanoma, pan-kidney cohort, testicular germ cell tumors, glioma and ovarian serous cystadenocarcinoma datasets. While a high correlation of MIR211-MITF expression was observed in the skin cutaneous melanoma subset (r = 0.745, p < 0.0001) (Figure 2(n)), a variable but positive correlation was present in the pan-kidney cohort (r = 0.11, p = 0.0052), testicular germ cell tumors (r = 0.26, p = 0.0034) and glioma (r = 0.22, p < 0.0001) subsets. A similar tendency was observed in the ovarian serous cystadenocarcinoma dataset (r = 0.13, p = 0.0661) (Figure S3(d–g)).
All of the above data demonstrated for the first time that, in addition to LC3B and ATG10, MITF regulated MIR211 expression under autophagy-inducing conditions. Because both MITF and MIR211 are co-expressed in cell lines and human tissues that were tested in this study, a MITF-MIR211 axis might play a role in general autophagy control.
MIR211 induced autophagy
In order to test whether MIR211 stimulated autophagy, we overexpressed miRNA mimic and control constructs in cells (Figure S4(a,b)) and checked for autophagy activation
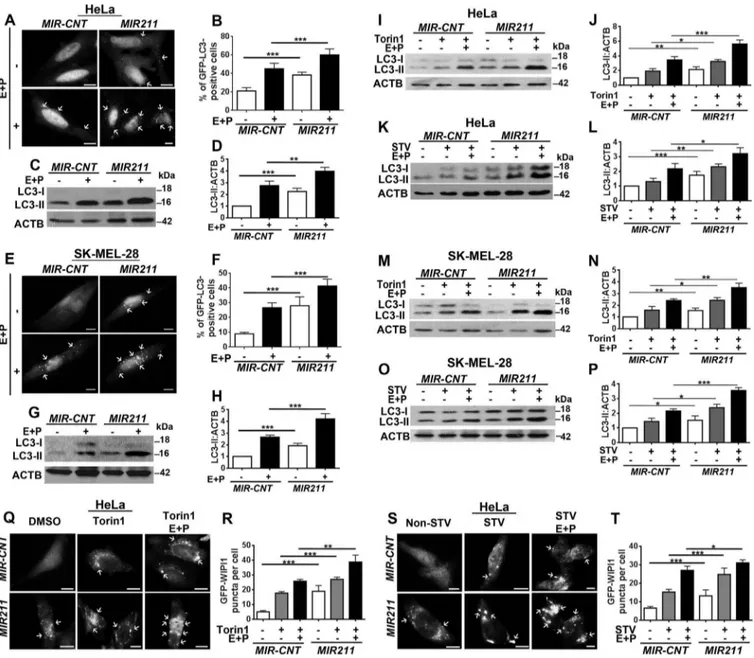
(Figure 3(a–h)). Overexpression of MIR211 but not the
control construct (MIR-CNT) induced GFP-LC3 dot forma-tion and LC3 shift in unstimulated HeLa cells in the pre-sence or abpre-sence of lysosomal inhibitors (Figure 3(a–d)). Similar results were obtained with SK-MEL-28 cells
(Figure 3(e–h)). Moreover, autophagy that was stimulated by torin1 or starvation was further upregulated in both HeLa (Figure 3(i–l)) and SK-MEL-28 (Figure 3(m–p)) cells following MIR211 overexpression (Figure S4(c–f)). We observed that, following addition of lysosomal inhibi-tors, LC3-II accumulation was further increased under these conditions upon MIR211 overexpression (Figure 3(i– p)). Of note, in line with post-translational control of MITF levels under these conditions, there was no significant change in MITF levels upon autophagy stimulation or MIR211 transfection (Figures S2(c–f) and S5). These results were confirmed using another independent test, a GFP-WIPI1 puncta formation assay following torin1 treatment (Figure 3(q,r)) or starvation (Figure 3(s,t)).
To further provide evidence that MIR211 stimulated productive autophagy that resulted in autophagosome-lysosome fusion and autophagic flux, we performed quan-titative GFP-LC3 analyses and GFP-LC3 and RFP-LAMP1 colocalization analyses. MIR211 overexpression stimulated an increase in both autophagosome and auto-lysosome numbers both in GFP-RFP-LC3 tests (Figure S6 (a,b)) and GFP-LC3 and RFP-LAMP1 colocalization ana-lyses (Figure S6(c,d)). All of these data showed that MIR211 did not block autophagosome-lysosome fusion but rather stimulated autolysosome formation.
Finally, GFP-LC3 lysosomal delivery and proteolysis tests were performed in the presence or absence of lyso-somal inhibitors. These analyses showed that MIR211 sti-mulated lysosome-dependent degradation of GFP-LC3. Free GFP accumulation was observed following MIR211 overexpression, whereas inhibition of lysosomal proteases prominently decreased this accumulation (Figure S6(e,f)).
Therefore, MIR211 stimulated autophagosome and autoly-sosome formation and autophagic flux.
Inhibition of MIR211 by antagomirs suppressed starvation- and MTOR-dependent autophagy
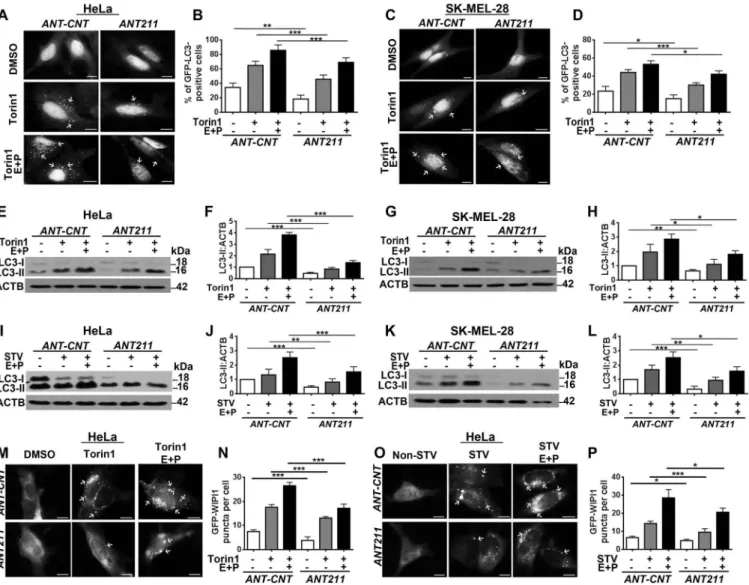
To reveal the importance of endogenous MIR211 in autop-hagy regulation, we inhibited endogenous miRNAs using chemically synthesized anti-MIR211 antagomir oligonucleo-tides (ANT211) or control oligonucleooligonucleo-tides (ANT-CNT), and checked torin1- or starvation-induced autophagy in the pre-sence or abpre-sence of E64D-pepstatin A. Introduction of ANT211 led to a decrease in GFP-LC3 dot numbers following torin1 treatment in HeLa (Figure 4(a,b)) and SK-MEL-28 cells (Figure 4(c,d)). In line with these results, torin1-induced LC3-II accumulation was attenuated in ANT211-transfected cells compared to the control in both HeLa (Figure 4(e,f)) and SK-MEL-28 (Figure 4(g,h)) cells. When starvation was used as an autophagy inducer, the level of LC3-II decreased in ANT211-transfected cells compared to control ANT211-transfected counterparts in both HeLa (Figure 4(i,j)) and SK-MEL-28 cells (Figure 4(k, l)). MIR211-dependence of classical (starvation- or torin1-induced) autophagy was also confirmed using GFP-WIPI1 puncta formation tests (Figure 4(m–p)). These results indicate that endogenous MIR211 levels are critical cellular factors regulating autophagy activation.
RICTOR was an autophagy-related target of MIR211
We next searched for an autophagy-related target(s) of MIR211 using the bioinformatics tools miRanda, FindTar3, TargetScan, miRDB and RNA22. All of these tools identified
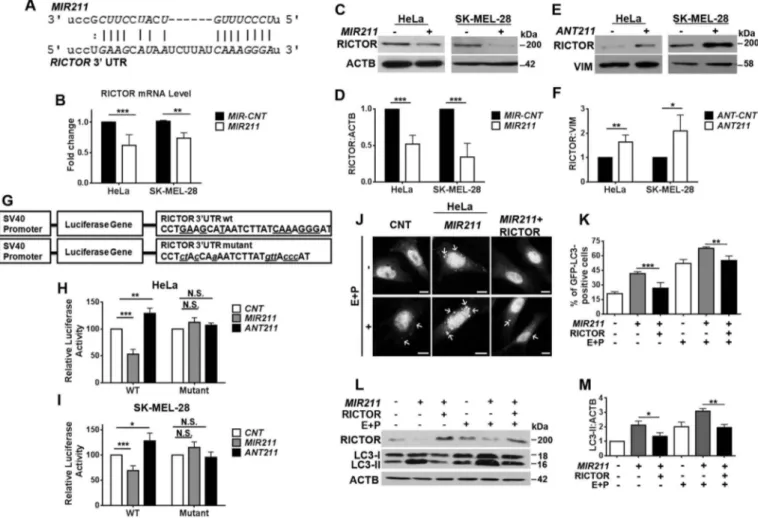
RICTOR (GenBank accession number: NM_152756) as a potential direct target of MIR211. Indeed, we could identify a MIR211 miRNA response element (MRE) in the 3ʹ UTR of the RICTOR mRNA (Base numbers: 4343–4349,Figure 5(a)).
Figure 3.MIR211 activated autophagy. (a-d) Hela cells were transfected with MIR211 or a control construct (MIR-CNT), and autophagy was assessed in the presence and absence of lysosomal inhibitors. (a)MIR211 overexpression increased GFP-LC3 dot formation. Scale bar: 10 µm. (b) Quantitative analysis of GFP-LC3 dots in the experimental set-up shown in A (mean± SD of n = 3 independent experiments, ***p < 0.01). (c) Autophagy-related LC3-II levels were analyzed in immunoblots of MIR-CNT-or MIR211-overexpressing HeLa cell extracts. (d) Graph depicting quantification of LC3-II:ACTB ratios in the experimental set-up shown in C (mean± SD, n = 3 independent experiments, ***p < 0.01, **p < 0.03). (e-h)MIR211 overexpression induced autophagy in SK-MEL-28 cells in the presence or absence of lysosomal inhibitors. (e)MIR211 overexpression increased GFP-LC3 dot formation. Scale bar: 10 µm. (f) Quantitative analysis of GFP-LC3 dots in the experimental set-up shown in E (mean± SD of n = 3 independent experiments, ***p < 0.01). (g) Autophagy-related LC3-II levels were analyzed in immunoblots ofMIR-CNT-or MIR211-overexpressing SK-MEL-28 cell extracts. (h) Graph depicting quantification of LC3-II:ACTB ratios in the experimental set-up shown in G (mean± SD, n = 3 independent experiments, ***p < 0.01). (i-l)MIR211 amplified torin1- or starvation-induced autophagy in HeLa cells. (i) Immunoblots of MIR-CNT- or MIR211-transfected HeLa cells treated with DMSO or torin1. E + P, E64D and pepstatin A. (j)Graph depicting quantification of LC3-II:ACTB ratios in the experimental set-up shown in I (mean± SD, n = 4 independent experiments, ***p < 0.01, **< 0.03, *p < 0.05). (k) Immunoblots ofMIR-CNT- or MIR211-transfected and non-starved or starved (STV) HeLa cells. (l) Graph depicting quantification of LC3-II:ACTB ratios in the experimental set-up shown in K (mean± SD, n = 3 independent experiments, ***p < 0.01, **p < 0.03, *< 0.05). (m-p)MIR211 amplified torin1- or starvation-induced autophagy in SK-MEL-28 cells. (m) Immunoblots of MIR-CNT- or MIR211-transfected SK-MEL-28 cells treated with DMSO or torin1. (n) Graph depicting quantification of LC3-II:ACTB ratios in the experimental set-up shown in M (mean± SD, n = 5 independent experiments, ***p < 0.01, **p < 0.03, *p < 0.01). (o) Immunoblots ofMIR-CNT- or MIR211-transfected and non-starved or starved SK-MEL-28 cells. (p) Graph depicting quantification of LC3-II:ACTB ratios in the experimental set-up shown in O (mean± SD, n = 4 independent experiments, ***p < 0.01, *p < 0.05). (q)MIR211 amplified torin1-induced GFP-WIPI1 puncta formation in HeLa cells. Scale bar: 10 µm. (r) Quantitative analysis of GFP-WIPI1 puncta in the experimental set-up shown in Q (mean± SD of n = 3 independent experiments, ***p < 0.01, **p < 0.03). (s)MIR211 amplified starvation-induced GFP-WIPI1 puncta formation in HeLa cells. Non-STV, non-starved. STV, starved. Scale bar: 10 µm. (t) Quantitative analysis of GFP-WIPI1 puncta in the experimental set-up shown in S (mean± SD of n = 3 independent experiments, ***p < 0.01, *p < 0.05).
In line with these observations, MIR211 overexpression resulted in the downregulation of RICTOR transcript levels in both HeLa and SK-MEL-28 cells (Figure 5(b)). Moreover, overexpression of the miRNA (Figure S4(g,h)) decreased RICTOR protein levels (Figure 5(c,d)), and downregulation of endogenous MIR211 using antagomirs (Figure S4(g,h)) resulted in the accumulation of RICTOR protein compared to controls (Figure 5(e,f)). Therefore, RICTOR levels in cells are regulated by MIR211.
To confirm that the MRE sequence in the 3ʹUTR of RICTOR mRNA was responsive to MIR211, we cloned the MRE sequence into the 3ʹUTR region of the luciferase gene.
Additionally, we created a mutant version of this construct by introducing base changes to putative miRNA binding residues (Figure 5(g)). Co-transfection of MIR211 together with the wild-type luciferase construct into HEK293T (Figure S7(a)), HeLa (Figure 5(h)) and SK-MEL-28 (Figure 5(i)) cells resulted in a significant decrease in luciferase activity. In contrast, MIR211 could no longer affect luciferase levels when the mutant construct was co-transfected instead (Figures 5(h,i), S7(a)). Therefore, MIR211 suppressed RICTOR expression through direct binding to its 3ʹUTR. Similar experiments were performed after transfection of cells with ANT211. In line with suppression of endogenous MIR211 by ANT211, a
Figure 4.Antagomir-mediated inhibition ofMIR211 led to the suppression of torin1- and starvation-induced autophagy. (a) Antagomir against MIR211 (ANT211), but not the control antagomir (ANT-CNT), decreased torin1-induced GFP-LC3 puncta formation in the presence or absence of lysosomal inhibitors E64D and pepstatin A (E + P) in HeLa cells. Scale bar: 10 µm. (b) Quantitative analysis of GFP-LC3 dots in the experimental set-up shown in A (mean± SD of n = 3 independent experiments, ***p < 0.01, **p < 0.03). (c)MIR211 knockdown by ANT211 decreased torin1-induced GFP-LC3 puncta formation compared to ANT-CNT control in SK-MEL-28 cells. Scale bar: 10 µm. (d) Quantitative analysis of GFP-LC3 dots in the experimental set-up shown in C (mean± SD of n = 3 independent experiments, ***p < 0.01, *p < 0.05). (e) Immunoblots ofANT-CNT- or ANT211-transfected HeLa cells that were treated with DMSO or torin1. (f) Graph depicting quantification of LC3-II:ACTB ratios in the experimental set-up shown in E (mean± SD, n = 3 independent experiments, ***p < 0.01). (g) Immunoblots ofANT-CNT- or ANT211-transfected SK-MEL-28 cells that were treated with DMSO or torin1. (h) Graph depicting quantification of LC3-II:ACTB ratios in the experimental set-up shown in G (mean± SD, n = 3 independent experiments, **p < 0.03, *p < 0.05). (i) Immunoblots ofANT-CNT- or ANT211-transfected and non-starved or starved (STV) HeLa cells. (j) Graph depicting quantification of LC3-II:ACTB ratios in the experimental set-up shown in I (mean± SD, n = 3 independent experiments, ***p < 0.01, **p < 0.03). (k) Immunoblots of ANT-CNT- or ANT211-transfected and non-starved or starved SK-MEL-28 cells. (l) Graph depicting quantification of LC3-II:ACTB ratios in the experimental set-up shown in K (mean± SD, n = 3 independent experiments, ***p < 0.01, **p < 0.03, *p < 0.05). (m)ANT211 blocked torin1-induced GFP-WIPI1 puncta formation in HeLa cells. Scale bar: 10 µm. (n) Quantitative analysis of GFP-WIPI1 puncta in the experimental set-up shown in M (mean± SD of n = 3 independent experiments, ***p < 0.01). (o)ANT211 blocked starvation-induced GFP-WIPI1 puncta formation in HeLa cells. Scale bar: 10 µm. (p) Quantitative analysis of GFP-WIPI1 dots in the experimental set-up shown in O (mean± SD of n = 3 independent experiments, ***p < 0.01, *p < 0.05).
significant increase above control levels was observed in the luciferase activity of ANT211-transfected cells, while this effect was not observed in cells transfected with the mutant construct (Figure 5(h,i)).
MicroRNAs may target more than one gene and usually dozens of genes at once. Rescue experiments were performed to validate that RICTOR downregulation was responsible for the autophagy-related effects of MIR211. For this purpose, RICTOR protein was overexpressed from a plasmid lacking the MRE region, and therefore resistant to miRNA-mediated silencing. GFP-LC3 puncta formation assays were performed in the presence or absence of E64D-pepstatin A. Under these conditions, MIR211-induced autophagy could be suppressed by reintroduction of the RICTOR protein (Figure 5(j,k)). In line with these results, an increase in LC3-II protein levels that was observed upon MIR211 overexpression (Figure S4(i)), was attenuated when the RICTOR protein was reintroduced, and
these effects were enhanced by lysosomal inhibitors (Figure 5 (l,m)). Therefore, expression of RICTOR alone was sufficient for autophagy suppression even in the presence of elevated MIR211 levels. The above presented data demonstrated for the first time that RICTOR is a rate-limiting target of the MITF-regulated microRNA MIR211, in the context of autophagy.
MIR211 regulated the MTORC1 pathway through RICTOR
MTORC2 was directly linked to MTORC1 regulation and autophagy control through AKT phosphorylation. The serine 473 (Ser473) residue on the AKT protein was iden-tified as a direct target of the MTORC2-associated MTOR Ser/Thr kinase [34]. Because we established that RICTOR, a major regulator of MTORC2 activity, was directly down-regulated by MIR211, we checked whether AKT Ser473
Figure 5.RICTOR was an autophagy-related direct and rate-limiting target ofMIR211. (a) MIR211 target sequence in the 3ʹ UTR of RICTOR mRNA. The MIR211 seed sequence was marked initalics. (b) RT-qPCR analysis of RICTOR mRNA levels in control (MIR-CNT)- or MIR211-transfected HeLa or SK-MEL-28 cells (mean± SD, n = 3 independent experiments, **p < 0.03, ***p < 0.01). Data were normalized usingGAPDH mRNA as a control. (c) Immunoblots of MIR-CNT or MIR211 transfected cells. RICTOR protein levels decreased followingMIR211 overexpression in HeLa or SK-MEL-28 cells. (d) Graph depicting quantification of RICTOR:ACTB ratios in the experimental set-up shown in C (mean± SD, n = 3 independent experiments, ***p < 0.01). (e) RICTOR protein levels were increased followingANT211- but not control antagomir (ANT-CNT)-transfection in HeLa and SK-MEL-28 cells. (f) Graph depicting quantification of RICTOR:VIM ratios in the experimental set-up shown in E (mean± SD, n = 3 independent experiments, *p < 0.05, **p < 0.03). (g) A scheme representing luciferase constructs with wild-type (WT) or mutantMIR211 target 3ʹ UTR MRE sequences ofRICTOR. Mutations were marked in lowercase letters. (h and i) Normalized luciferase activity in lysates from HeLa (H) and SK-MEL-28 (I) cells that were co-transfected with wild-type or mutant RICTOR-luciferase constructs andMIR211 or ANT211 (mean ± SD of independent experiments, n = 4, *p < 0.05, **p < 0.03, ***p < 0.01, N.S., not significant). (j) RICTOR overexpression was sufficient to revertMIR211-mediated autophagy induction. HeLa cells were co-transfected withMIR211 or MIR-CNT and a RICTOR expression plasmid lacking the MIR211 target MRE region (MIR211-resistant RICTOR plasmid). GFP-LC3 dot formation was evaluated in the presence or absence of E64D and pepstatin A (E + P). Scale bar: 10 µm. (k) Quantitative analysis of GFP-LC3 dots in the experimental set-up shown in J (mean± SD of n = 3 independent experiments, ***p < 0.01, **p < 0.03). (l) Immunoblots of extracts from cells transfected withMIR-CNT, MIR211 or MIR211 together with theMIR211-resistant RICTOR expression plasmid. (m) Graph depicting quantification of LC3B:ACTB ratios in the experimental set-up shown in L (mean ± SD, n = 3 independent experiments, **< 0.03, *p < 0.05).
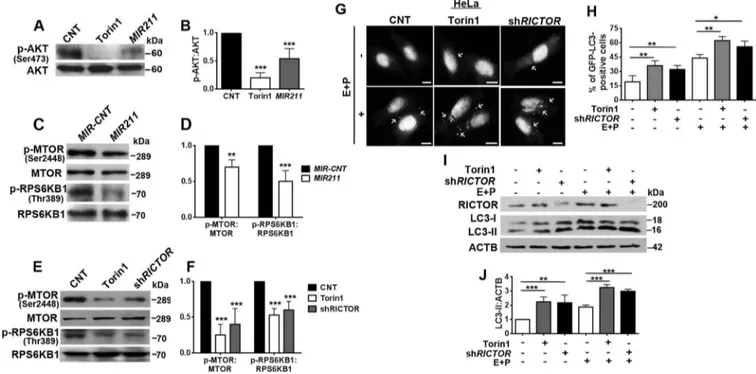
phosphorylation was affected by overexpression of the miRNA. Figure 6(a,b) show that MIR211 overexpression prominently decreased AKT phosphorylation. In the same experimental context, MIR211 overexpression blocked the activation of MTORC1 by AKT through MTOR Ser2448 phosphorylation (Figure 6(c,d)). Furthermore, the miRNA also led to a decrease in RPS6KB1 phosphorylation by MTORC1 at Thr389, confirming the inhibition of MTORC1 activity under these conditions (Figure 6(c,d)). We also showed in our system that RICTOR downregula-tion per se was responsible for MTORC1 inhibidownregula-tion by the miRNA. Indeed, introduction of an shRNA against RICTOR (shRICTOR) resulted in MTOR Ser2448 and RPS6KB1 Thr389 dephosphorylation, and hence MTORC1 inhibition (Figure 6(e,f)). Moreover, overexpres-sion of RICTOR from a MIR211-resistant construct increased MTORC2-related AKT phosphorylation (Figure S7(b)).
Next, we explored autophagy-related consequences of MTORC1 inhibition secondary to RICTOR downregula-tion. Indeed, transfection of shRICTOR alone stimulated autophagy (Figures 6(g,h), S7(c)). Considering that the knockdown efficiency was approximately 50%, we can conclude that shRICTOR activated autophagy to a com-parable level as MTORC1 and MTORC2 inhibitor torin1 treatment (Figure 6(i,j)). All of these data led us to con-clude that MIR211-mediated RICTOR downregulation resulted in a strong inhibition of the
MTORC2-AKT-MTORC1 pathway, leading to the stimulation of autophagy.
MIR211 overexpression resulted in MITF translocation to the nucleus
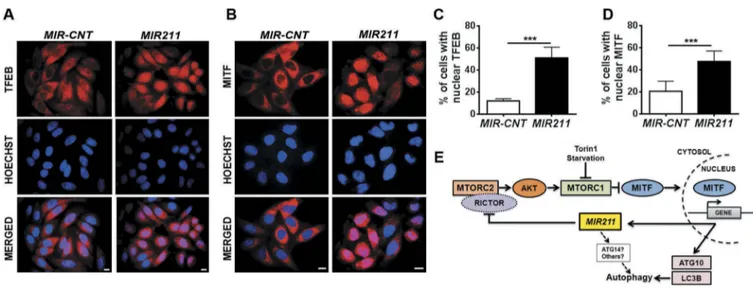
As previously shown, inhibition of MTORC1 led to the trans-location of TFEB and MITF to the nucleus under autophagy-inducing stress conditions (Figures 1(a–d), S1 and as shown in reference [15]). Having demonstrated that MIR211 led to the inhibition of MTORC1, we wondered whether mere over-expression of the miRNA would lead to a similar outcome. We observed that following MIR211 overexpression, endogen-ous TFEB and MITF proteins translocated to the nuclei in a significant fraction of cells (Figure 7(a–d)). Of note, miRNA transfection efficiency was approximately 60% for HeLa cells, indicating that translocation occurred in most of the trans-fected cells (Figure 7(c,d)). MIR211-dependent regulation of MITF nuclear translocation was also observed in other cell lines that were tested (see Figure S8 for results of HEK293T, MCF-7 and SK-MEL-28 cell lines that are derived from dif-ferent tissue types).
Discussion
Results presented in this article demonstrated that MITF plays a crucial role in starvation and MTOR-inhibition mediated autophagy. In addition to controlling the expression of
Figure 6.MIR211 regulated the MTORC1 pathway through RICTOR. (a) MTORC2-mediated AKT Ser473 phosphorylation was decreased in HeLa cells overexpressing MIR211. Torin1 was used as a positive control. (b) Graph depicting quantification of p-AKT:AKT ratios in the experimental set-up shown in A (mean± SD, n = 3 independent experiments, ***p < 0.01). (c) MTOR phospho-Ser2448 (p-MTOR) and RPS6KB1 phospho-Thr389 levels were decreased followingMIR211 overexpression in HeLa cells. (d) Graph depicting quantification of p-MTOR:MTOR and p-RPS6KB1:RPS6KB1 ratios in the experimental set-up shown in C (mean± SD, n = 3 independent experiments, ***p < 0.01, **< 0.03). (e) Knockdown of RICTOR by shRNA (shRICTOR) decreased p-MTOR and p-RPS6KB1 levels. Torin1, positive control. (f) Graph depicting quantification of p-MTOR:MTOR and p-RPS6KB1:RPS6KB1 ratios in the experimental set-up shown in E (mean± SD, n = 3 independent experiments, ***p < 0.01). (g) Knockdown of RICTOR increased GFP-LC3 dot formation. Torin1, positive control. E + P, E64D and pepstatin A. Scale bar: 10 µm. (h) Quantitative analysis of GFP-LC3 dots in the experimental set-up shown in G (mean± SD of n = 3 independent experiments, **p < 0.03, *p < 0.05). (i) Immunoblots of LC3-II formation following knockdown of RICTOR. Torin1, positive control. (j) Graph depicting quantification of LC3B:ACTB ratios in the experimental set-up shown in I (mean± SD, n = 3 independent experiments, ***p < 0.01, **p < 0.03).
lysosome-related genes, we showed that MITF is a key reg-ulator of autophagic signal amplification through a MITF-MIR211 axis. We showed that: i. Following autophagy-indu-cing stress, TFEB as well as MITF translocated to the nuclei of cells. ii. MITF knockdown significantly downregulated the amplitude of autophagy that was activated by starvation and torin1. iii. MITF overexpression potentiated starvation- and torin1-stimulated autophagy. iv. Following translocation to the nuclei, MITF transactivated autophagy-related targets as well as MIR211 expression. v. Both MITF and MIR211 were co-expressed in tested cell lines, human tissue samples and in various tumor datasets. vi. Overexpression of MIR211 stimu-lated autophagosome and autolysosome formation, and autophagic degradation. vii. Knockdown of endogenous MIR211 limited the increase in the amplitude of autophagy under these conditions, indicating a key role for this miRNA in autophagy regulation. viii. MIR211 overexpression was sufficient for the stimulation of TFEB and MITF translocation to nuclei, and it did so through direct targeting of RICTOR and inhibition of the MTORC2 and MTORC1 pathways. All of these data demonstrated that MITF is a universal amplifier of the autophagy signal in cells, through a feed-forward mechanism involving the MITF-MIR211-RICTOR-MTORC1 axis (Figure 7(e)).
MITF is a member of the MITF/TFE family of bHLH-Zip transcription factors, that include TFEB, TFEC, and TFE3. Studies until now implicated TFEB, and to a certain extent TFE3, in the transcriptional regulation of autophagosome and lysosome biogenesis via activation of the genes of crucial proteins, including subunits of the v-ATPase, lysosomal trans-porters and hydrolases (Table S1). Additionally, some autop-hagy-related genes such as BECN1, WIPI, GABARAP, HIF1A, VPS11 and VPS18 were also reported to be transcriptional targets of TFEB [16,17,20]. Similar to TFEB, TFE3 was shown
to perform overlapping gene regulatory functions [16,19]. In contrast, study of MITF function in an autophagy context was limited to the analysis of MITF transcriptional targets, and most studies in the literature on MITF concentrated on its function in melanocyte differentiation and melanoma inva-sion [35]. Although MITF was shown to regulate a number of overlapping genes with TFEB and TFE3, including autophagy genes LC3B, ATG10, ATG16L1, SQSTM1, ATG9B and UVRAG (Table S1), whether MITF played a non-redundant and specific function in autophagy regulation was not estab-lished so far. Strikingly, none of the studies that were pub-lished to date clearly showed the importance of independent contribution of MITF to autophagy regulation. Therefore, our study establishes for the first time a MITF-specific role in autophagic control through a feed-forward autophagy ampli-fication loop involving a MITF-MIR211 axis.
Transcriptional activation of MIR211 by MITF was pre-viously reported in a melanoma invasion and metastasis con-text [32,33,36]. Here, we confirmed that MIR211 expression was dependent on MITF expression because MITF moved to the nuclei and bound to the MIR211 promoter under autop-hagy-stimulating conditions. Furthermore, knockdown of MITF led to a drop in endogenous MIR211 levels. Conversely, antagomir-mediated silencing of MIR211 limited the increase in the amplitude of autophagy when MITF was overexpressed, demonstrating the critical role of this miRNA in MITF-dependent autophagy regulation (Figure S9(a,b)).
During the osteogenic differentiation of human induced pluripotent stem cells, a correlation between MIR211 expres-sion and ATG14 upregulation was suggested, but relevance of this observation for autophagy regulation so far remained obscure [37]. Here, RICTOR was identified as a direct and rate-limiting target of MIR211 in an autophagy context because the 3ʹUTR region of the gene contained a
MIR211-Figure 7.MIR211 overexpression led to MITF translocation to the nucleus. (a and b) Endogenous TFEB (A) or MITF (B) intracellular localizations were analyzed using indirect immunostaining with specific antibodies in HeLa cells transfected withMIR-CNT or MIR211. Scale bar: 10 µm. (c and d) Quantification of endogenous TFEB (c) or MITF (d) nuclear localization (mean± SD, n = 3 independent experiments, ***p < 0.01). (e) A model depicting the MITF-MIR211 autophagy feed-forward regulation pathway. Downregulation of RICTOR byMIR211 blocks MTORC2 activity, leading to AKT inhibition that is followed by MTORC1 blockage. Under these conditions, MITF that was sequestered in the cytosol migrates to the nucleus and contributes to the transactivation of autophagy-related genes as well asMIR211. Upregulation of the miRNA under these conditions creates a feed-forward loop that amplifies and sustains autophagy during stress. Although, we have shown here that RICTOR was a direct and rate-limiting target ofMIR211 in autophagy control (see the rescue assays inFigure 5(j)), additional direct or indirect connections involving otherMIR211 targets (e.g.,ATG14) might also be contributing to the further amplification of the autophagic activity.
responsive sequence element, and, in rescue assays, reintro-duction of RICTOR protein attenuated autophagy activation by the miRNA. Importantly, we showed that RICTOR down-regulation by MIR211 or specific shRNA, led to a decrease in AKT Ser473 phosphorylation and MTORC1 pathway inhibi-tion. Under these conditions, TFEB and MITF translocated to the nuclei of cells, further increasing MIR211 levels in a MITF-dependent manner, and activating a gene expression program that determines the amplitude of the autophagic signal.
Up to now, 4 different miRNAs, namely MIR155 [38], MIR15A [39], MIR16 [39] and MIR185 [40] were shown to target RICTOR in an autophagy context. In none of the studies was RICTOR shown as a rate-limiting target for autophagy induction. Moreover, binding regions of these miRNAs in the 3ʹUTR region of RICTOR mRNA were differ-ent and non-overlapping with that of the MIR211 binding region that we have identified (Figure 5(a)). Furthermore, in our hands, none of these miRNAs were shown to be regulated by starvation or MTOR-inhibition (Figure S10), indicating that MIR211 plays a special and specific role that is different from other RICTOR-targeting miRNAs in autophagy control. Here we showed for the first time, the role of a MITF-specific axis, the MITF-MIR211 axis, in the control of starva-tion- and MTOR-inhibistarva-tion-mediated autophagy. Considering the co-existence of MITF and MIR211 in various cell lines and tissues, our results suggest that the MITF-MIR211 axis is a universal determinant of autophagy amplitude under stress conditions.
Materials and methods Plasmid constructs
The plasmid encoding the control human telomerase (HTR) genomic region (a nontranslated RNA coding for HTR RNA) was used as control for (MIR-CNT) [41]. pEGFP-1-N1-MITF-A (38132) [42], pEGFP-N1-TFEB (38119) [42], pRK-5-MYC-RICTOR (11367) [8], pLKO.1-RICTOR shRNA (1853) [34], and LAMP1-RFP (1817) [43] were purchased from Addgene. GFP-LC3 and RFP tan-demly tagged LC3 (tfLC3 or RFP-GFP-LC3) were also described [44,45].
For luciferase tests, 3ʹ UTR segments containing MRE sequences of RICTOR and mutant versions were synthesized as sense and antisense linkers. The linker primers were: RICTOR primers 5ʹ CTAGACCTGAAGCATAATCTTA TCAAAGGGATGTTAACT-3ʹ, 5ʹ-CTAGAGTTAACATCC CTTTGATAAGATTATGCTTCAGGT-3ʹ. Mutant RICTOR primers 5ʹ-CTAGACCTCTACCAAAATCTTATGTTACCC ATGTTAACT-3ʹ,5ʹ-CTAGAGTTAACATGGGTAACATAAG ATTTTGGTAGAGGT-3ʹ. Double-stranded DNA linkers with added sticky XbaI sites were created by annealing comple-mentary strands following incubation at 95°C and slow cool-ing at RT. Linkers were cloned into the luciferase reporter pGL3-control vector (Promega, E1741) in the 3ʹ UTR region of the luciferase gene into XbaI sites between the stop codon and the polyadenylation signal.
Cell culture and transfection
HeLa cervix cancer cells, HEK293T human embryonic kidney cells and MCF-7 breast cancer cells were cultured in Dulbecco’s modified Eagle’s medium (DMEM; Biological Industries, BI01-050-1A) supplemented with 10% (v:v) fetal bovine serum (PAN, P30-3302), antibiotics (penicillin/streptomycin; Biological Industries, BI03-031-1B) and L-glutamine (Biological Industries, BI03-020-BI03-031-1B) in a 5% CO2humidified incubator at 37°C. The melanoma
cell line SK-MEL-28 and breast cancer cell line MDA-MB-231 were cultured in DMEM medium additionally supple-mented with 1% non-essential amino acids (Gibco, 11140-035). SHSY-5Y neuroblastoma cells were cultured in fully supplemented DMEM low glucose (1000 mg/l) medium. HeLa and HEK293T cells were transiently trans-fected using the calcium phosphate method according to standard protocols [46]. SK-MEL-28 and MCF-7 cells were transiently transfected using the polyethylenimine (PolySciences Inc., 23966) transfection method according to Foley et al [47]. Stable RFP-GFP-LC3 HeLa monoclones were created by 4 weeks of G418 (Roche, 04727894001) selection following transfection of cells with the construct. For induction of autophagy, cells were incubated in cul-ture media containing torin1 (200 nM; Tocris, 4247) dis-solved in DMSO (Sigma, D2650), or cells were starved in Earle’s Balanced Salt solution (Biological Industries, BI02-010-1A) for 4 h. Autophagic flux experiments were per-formed in the presence or absence of lysosomal protease inhibitors E64D (10 μg/ml; Santa Cruz Biotechnology, SC201280A) and pepstatin A (10 μg/ml; Sigma, P5318) for 4 h.
Immunoblotting and antibodies
Cells were lysed at the indicated time points in RIPA buffer (50 mM TRIS-HCl, pH 7.4, 150 mM NaCl [Applichem, A2942], 1% NP40 [Sigma, 74385], 0.25% Na-deoxycholate [Sigma, 30970]) supplemented with a complete protease inhi-bitor cocktail (Sigma, P8340) and 1 mM phenylmethylsulfonyl fluoride (Sigma, P7626). Protein extracts (30 µg per well for autophagy assays, and 80 µg per well for MTOR pathway assays) were separated using 6–15% SDS-polyacrylamide gels, and then transferred onto nitrocellulose membranes (Millipore, IPVH00010). Membranes were blocked in 5% nonfat milk (Applichem, A0830) or in 3% BSA (Capricorn, BSA-1T) in PBS-T (3.2 mM Na2HPO4[Sigma, S5136], 0.5 mM
KH2PO4[Sigma, 4243], 1.3 mM KCl[Sigma, P9333], 135 mM
NaCl, 0.05% Tween 20[Sigma, P5927], pH 7.4) for 1 h, and then incubated with primary antibodies in a 3% BSA-PBS-T solution. Following PBS-T washes, membranes were incu-bated with horseradish peroxidase-coupled secondary anti-mouse (Jackson Immunoresearch Laboratories, 115035003) or anti-rabbit (Jackson Immunoresearch Laboratories, 111035144) antibodies. Anti-LC3B (Novus, 2331), anti-RICTOR (Cell Signaling Technology, 2114S), phospho-MTOR (Ser2448; Cell Signaling Technology, 5536), anti-MTOR (Cell Signaling Technology, 2972), anti-RPS6KB/ p70S6K (Cell Signaling Technology, 2708),
anti-phospho-RPS6KB/p70S6K (Thr389; Cell Signaling Technology, 9205), anti-AKT (Cell Signaling Technology, 9272S), anti-phospho-AKT (Ser473; Cell Signaling Technology, 587F11), anti-MITF clone 5 (Millipore, MAB3747-I), anti-TFEB (Cell Signaling Technology, 4240), GFP (Roche, 11814460001), anti-ACT/β-ACTIN (Sigma, A5441) or anti-VIM/vimentin (Sigma, V6630) antibodies were used. ImageJ software was used to quantify protein band intensities [48].
Immunofluorescence analyses
Cells were cultured on coverslides and fixed in an ice-cold 4% paraformaldehyde-PBS solution (pH 7.4). For indirect immu-nostaining experiments, following fixation, cells were permea-bilized in PBS containing 0.1% BSA (Sigma, A4503) and 0.1% saponin (Sigma, 84510). As primary antibodies, anti-MITF clone 5, and anti-TFEB were used. Anti-mouse Alexa Fluor 594 (Invitrogen, A11005) and anti-rabbit Alexa Fluor 594 (Invitrogen, A11002) were used as secondary antibodies. When indicated, nuclei were stained using Hoechst dye in 1x PBS. Coverslides were mounted onto glass slides, and samples were analyzed using a BX60 fluorescence microscope (Olympus, BX60).
For experiments with fluorescent protein fusions, cells stably expressing RFP-GFP-LC3 or cells transiently trans-fected with a plasmid encoding GFP-LC3, RFP-LAMP1, or GFP-MITF-A, GFP-TFEB or GFP-WIPI1 plasmids were used. After 48 h, cells were fixed in ice-cold 4% paraformaldehyde-PBS. Coverslides were then mounted onto glass slides, and samples were analyzed using a BX60 fluorescence microscope (Olympus, BX60) or a Carl Zeiss LSM 710 confocal micro-scope (Zeiss, Germany).
Quantitative GFP-LC3, GFP-WIPI1, GFP-LC3, RFP-LAMP1 analyses
Dot counts were performed in RFP-GFP-LC3 stable HeLa cells or LC3-transfected SK-MEL-28 cells or GFP-WIPI1-transfected HeLa cells. Basal autophagy threshold was determined as 15 GFP-LC3 dots per RFP-GFP-LC3 stable HeLa cell, and 5 GFP-LC3 dots per SK-MEL-28 cell. At least 150 GFP-positive cells per condition were analyzed, and results were expressed as percentage of GFP-LC3 dot-positive cells (above the thresholds) versus total number of transfected cells. For GFP-WIPI1 tests, at least 40 GFP-positive cells per condition were analyzed and quantified by ImageJ analyses, and results were expressed as number of GFP-WIPI1 puncta per cell.
For RFP-GFP-LC3 tests, at least 30 RFP-GFP-positive HeLa cells for each experimental condition were analyzed under a fluorescence microscope (Olympus BX60, Japan) using a 60x magnification. Autophagosomes gave both RFP and GFP signals, while autolysosomes were defined as RFP-positive dots. The number of autolysosomes was calculated by subtracting GFP-positive dot numbers from RFP-positive dot numbers. For GFP-LC3 and RFP-LAMP1 colocalization tests, at least 20 cells for each experimental condition were analyzed under a Carl Zeiss LSM 710 confocal microscope (Zeiss, Germany).
Bioinformatics analyses
miRNA targets were identified using publicly available bioin-formatics tools FindTar3 (http://bio.sz.tsinghua.edu.cn), TargetScan Human (www.targetscan.org/), miRanda (www.
microrna.org), miRDB (http://mirdb.org/) and RNA22 (cm.
jefferson.edu/rna22). Pearson correlation analysis of MITF and MIR211 expression across NCI-60 cell lines was per-formed using bioinformatic tools available on the CellMiner website (https://discover.nci.nih.gov/cellminer/analysis.do). Detailed information on multiple platform analysis tools were previously published [49]. For TCGA analyses (http://
cancergenome.nih.gov/), datasets of MITF and MIR211
expression were downloaded using FireBrowse RESTful API
(http://firebrowse.org/api-docs/). Datasets were selected
according to the following criteria: (i) the number of samples that have missing values for MIR211 expression less than 40% of all samples; and (ii) the number of samples with both MITF and MIR211 expression larger than 100. Pearson correlation analyses were performed using datasets meeting the criteria above: Skin Cutaneous Melanoma, Glioma, Pan-kidney Cohort, Testicular Germ Cell Tumors, and Ovarian Serous Cystadenocarcinoma.
RNA isolation and RT-PCR analyses
Total RNA was extracted using TRIzol reagent (Sigma, T9424) according to the manufacturer’s instructions. cDNA was reverse transcribed from DNase 1 (Thermo Fischer Scientific, EN0521)-treated total RNA using M-MuLV reverse transcriptase (Fermentas, EP0351) and random hexamers (Invitrogen, 48190-011). For real-time RT-PCR quantification of mRNA levels, the SYBR Green Quantitative RT-PCR kit (Roche, 04-913-914-001) and LightCycler 480 (Roche) were used. To activate the SYBR Green, an initial cycle of 95°C, 10 min was performed. PCR reactions were as follows: 95°C for 15 sec and 60°C for 1 min. (40 cycles). Then a thermal denaturation protocol was used to generate the dissociation curves for the verification of amplification specificity (a single cycle of 95°C for 60 sec, 55°C for 60 sec and 80 cycles of 55°C for 10 sec). Changes in mRNA levels were quantified using the 2−ΔΔCT method using GAPDH (glyceraldehyde-3-phos-phate dehydrogenase) mRNA as control. Primers used were: RICTOR primers 5ʹ-AGTGAATCTGTGCCATCGAGT −3ʹ, 5ʹ-AGTAGAGCTGCTGCCAAACC −3ʹ; Pan-MITF primers 5ʹ-TTCACGAGCGTCCTGTATGCAGAT-3ʹ, 5ʹ-TTGCAAA GCAGGATCCATCAAGCC-3ʹ; MITF-M primers 5ʹ-TCTAC CGTCTCTCACTGGATTGG-3ʹ, 5ʹ-GCTTTACCTGCTGC CGTTGG-3ʹ; MITF-A primers 5ʹ-GCAGTGGAAGGA CGGGAAG-3ʹ, 5ʹ-CAGGATGCTCGGCGGAAC-3ʹ; ATG10 primers 5ʹ- GTCACATCTAGGAGCATCTACCC-3ʹ, 5ʹ-CATCCAAGGGTAGCTCGAAA-3ʹ; LC3B primers 5 ʹ-GAGAAGCAGCTTCCTGTTCTGG-3ʹ, 5ʹ-GTGTCC GTTCACCAACAGGAAG-3ʹ; GAPDH primers 5 ʹ-AGCCACATCGCTCAGACAC-3ʹ, 5ʹ-GCCCAATACGACC AAATCC-3ʹ; MIR155 stem-loop primer, 5ʹ-GTCGTATCCAG TGCAGGGTCCGAGGTATTCGCACTGGATACGACACC-CCTA-3ʹ, MIR155 forward primer, 5ʹ-GTTGGGTTAATG CTAATCGTGA-3ʹ; MIR15A stem-loop primer, 5
GTCGTATCCAGTGCAGGGTCCGAGGTATTCGCACT GGATACGACCACAAAC-3ʹ, MIR15A forward primer, 5ʹ-GGGTAGCAGCACATAATG-3ʹ; MIR16 stem-loop primer, 5ʹ-GTCGTATCCAGTGCAGGGTCCGAGGTATTCGCACT GGATACGACCGCCAAT-3ʹ, MIR16 forward primer, 5ʹ-GTTTGGTAGCAGCACGTAAAT-3ʹ; MIR185 stem-loop pri-mer, 5ʹ-GTCGTATCCAGTGCAGGGTCCGAGGTATTCGC ACTGGATACGACTCAGGAA-3ʹ, MIR185 forward primer, 5ʹ-GTGTGGAGAGAAAGGCAG-3ʹ; Universal reverse pri-mer, 5ʹ-GTGCAGGGTCCGAGGT-3ʹ. TaqMan RT-qPCR reactions were performed using FastStart Universal Probe Master kit (Roche, 04913957001) and LightCycler 480 accord-ing to previously described protocols [24]. Primers and the probe used during the study were: MIR211 stem-loop primer, 5ʹ- GTCGTATCCAGTGCAGGGTCCGAGGTATTCGCACT GGATACGACAGGCGA-3ʹ; MIR211 forward primer, 5ʹ-GGGTTCCCTTTGTCATCCT-3ʹ; Universal reverse primer, 5ʹ-GTGCAGGGTCCGAGGT-3ʹ; MIR211 TaqMan Probe, 5ʹ- (6-FAM)-CGCACTGGATACGACAGGCGAAG-(TAMRA-sp)-3ʹ.
Dual luciferase-reporter assay
Luciferase vectors containing wild-type or mutant MIR211 MREs from the RICTOR 3ʹ UTR were co-transfected with MIR211 or ANT211 and a Renilla luciferase construct into HeLa and SK-MEL-28 cells. HEK293T cells were co-trans-fected with MIR211 and a Renilla luciferase construct. After 48 h, cells were lysed. Firefly and Renilla luciferase activities were measured using a dual luciferase-reporter assay system (Promega, E1910) and a luminometer (Thermo Fischer Scientific, Fluoroskan Ascent FL). Results were calculated following normalization of the firefly luciferase activity to the renilla luciferase activity.
Antagomir and siRNA tests
miRIDIAN microRNA Hairpin Inhibitors (antagomirs) against MIR211 (hsa-MIR211, IH-300566-05-0005) and a con-trol antagomir (miRIDIAN microRNA hairpin inhibitor negative control, IN001005-01-05) were purchased from Dharmacon. The control antagomir sequence was based on miR-67 C. elegans microRNA which has minimal sequence similarity with known human miRNAs. Transfection of antagomirs (200 nM per point) was performed using either the polyethylenimine transfection or calcium phosphate pro-tocols as previously explained [23]. Pan-MITF siRNA (siGenome SMARTPool human MITF siRNA, M-008674– 00-0005) and control siRNA (D-001210–01-20) were pur-chased from Dharmacon, and 40 nM/well siRNA was transfected.
Chromatin immunoprecipitation (ChIP) and ChIP-qPCR
For ChIP, HeLa and SK-MEL-28 cells were cultured for 48 h and either incubated for 4 h with DMSO or torin1 (200 nM) and subsequently crosslinked in 1% formalde-hyde (Sigma, F8775) at room temperature for 10 min.
Fixation was stopped by adding 125 mM glycine (Applichem, A1067). Cells were then harvested and lysed in 2 ml of ChIP lysis buffer (50 mM HEPES [Sigma, 54457], 150 mM NaCl, 1% Triton X-100 [Applichem, A4975], 0.1% Na-deoxycholate, 1 mM EDTA [Calbiochem, 324503] containing 0.25% SDS [Applichem, A2572] and protease inhibitor cocktail [Sigma, P8340]). The lysates were subjected to sonication to shear DNA to the length of approximately 150–900 base pairs using a Q700 Sonicator (QSonica). An aliquot (20%) of the supernatant fraction from the chromatin was used as the ‘input sample’. For IP, MITF antibody (5 μg/sample; Millipore, MAB3747-I) was incubated with 50 μL of pro-tein-G Dynabeads (Invitrogen, 10003D) overnight at 4°C and washed 3 times with ChIP lysis buffer containing protease inhibitor cocktail. A fraction (500 µg) of the resulting sheared chromatin samples were incubated with MITF antibody-coupled magnetic beads or with beads only (for background control) for 2 h at room tempera-ture. Beads were washed 2x with ChIP lysis buffer, 2x with high salt wash buffer (ChIP lysis buffer containing 500 mM NaCl) and 2x with Tris-EDTA (10 mM Tris-Cl, 1 mM EDTA, pH 8). Immunocomplexes were eluted using 100 μL Tris-EDTA at 95°C for 10 min. After elution, crosslink was reversed by adding NaCl of 200 mM final concentration and incubated with proteinase K (Thermo Fisher Scientific, EO0491) overnight at 65°C. DNA frag-ments were purified by phenol-chloroform extraction, air-dried, and redissolved in H2O. Quantitative real-time PCR
was performed using a SYBR Green Quantitative RT-PCR kit (Roche, 04-913-914-001) and a LightCycler 480. Primers used were: MIR211 promoter-specific primers, 5ʹ-CATCGCTTCACAGCAATCATGAGG-3ʹ, 5ʹ-ATCTGAGCTTACCTGCCACAGCA-3ʹ;LC3B promoter-specific primers, 5ʹ-CATGCC TTGGGACACCAGAT-3ʹ, 5ʹ-ACCTTCTTCAAGTGCTGTTTGT-3ʹ; HSPA/HSP70 promoter-specific primers, 5ʹ-CCTCCAGTGA ATCCCAGAAGACTCT-3ʹ, 5ʹ-TGGGACAACGG GAGTCACTCTC-3ʹ. The results are presented as percen-tage of input.
Human tissue samples
Human tissue sample collection and experiments were con-ducted in accordance with the guidelines set by the Turkish Republic Ministry of Health, and approved by the Ethics Committee of Dr. Sadi Konuk Research and Training Hospital and Sabanci University. Samples were drop frozen in liquid nitrogen shortly after admission of cadavers to the Council of Forensic Medicine. RNA isolation and protein analyses were performed from frozen tissue powders according to the protocols above.
Statistical analyses
Statistical analyses were performed using Student’s two-tailed t-test. Data were represented as means of ± SD of n
independent experiments (biological replicates). Values of p < 0.05 were considered as significant.
Acknowledgments
This work was supported by the Scientific and Technological Research Council of Turkey (TUBITAK) 1001 grant number 112T272 and Sabanci University. D.G. is a recipient of an EMBO Strategical Development and Installation Grant (EMBO-SDIG), Turkish Academy of Sciences (TUBA) GEBIP Award, IKU Prof. Dr. Onder Oztunali Science Award, TGC Sedat Simavi Health Sciences Award and Elginkan Foundation Technology Award. shRICTOR (Addgene, 1853) and MYC-RICTOR (Addgene, 11367) plasmids were kindly provided by David Sabatini. pEGFP-N1-TFEB (Addgene, 38119), pEGFP-N1-MITF-A (Addgene, 38132) con-structs were kindly provided by Shawn Ferguson. RFP-LAMP1 (Addgene, 1817) was kindly provided by Walther Mothes. The SK-MEL-28 cell line was a kind gift of N.C. Tolga Emre, Bogazici University. We also thank N. C. Tolga Emre for providing us ChIP protocol. We thank Nur M. Kocaturk who kindly helped and assisted with the confocal microscopy analysis. The authors declare that they have no conflict of interest.
Disclosure statement
No potential conflict of interest was reported by the authors.
Funding
This work was supported by the TUBITAK [112T272].
ORCID
Devrim Gozuacik http://orcid.org/0000-0001-7739-2346
References
[1] Mizushima N. Autophagy: process and function. Genes Dev.2007
Nov 15;21(22):2861–2873. PubMed PMID: 18006683.
[2] Gozuacik D, Kimchi A. Autophagy as a cell death and tumor suppressor mechanism. Oncogene. 2004 Apr 12;23(16):2891– 2906. PubMed PMID: 15077152.
[3] Oral O, Akkoc Y, Bayraktar O, et al. Physiological and patholo-gical significance of the molecular cross-talk between autophagy and apoptosis. Histol Histopathol. 2016 May;31(5):479–498. PubMed PMID: 26680630.
[4] Hosokawa N, Hara T, Kaizuka T, et al. Nutrient-dependent MTORC1 association with the ULK1-Atg13-FIP200 complex required for autop-hagy. Mol Biol Cell. 2009 Apr;20(7):1981–1991. PubMed PMID: 19211835; PubMed Central PMCID: PMCPMC2663915.
[5] Erbil S, Oral O, Mitou G, et al. RACK1 is an interaction partner of ATG5 and a novel regulator of autophagy. J Biol Chem.2016Aug 5;291(32):16753–16765. PubMed PMID: 27325703; PubMed Central PMCID: PMCPMC4974388.
[6] Hara K, Maruki Y, Long X, et al. Raptor, a binding partner of target of rapamycin (TOR), mediates TOR action. Cell.2002Jul 26;110(2):177–189. PubMed PMID: 12150926.
[7] Saxton RA, Sabatini DM. MTOR signaling in growth, metabolism, and disease. Cell.2017Apr 6;169(2):361–371. PubMed PMID: 28388417. [8] Sarbassov DD, Ali SM, Kim DH, et al. Rictor, a novel binding
partner of MTOR, defines a rapamycin-insensitive and raptor-independent pathway that regulates the cytoskeleton. Curr Biol.
2004Jul 27;14(14):1296–1302. PubMed PMID: 15268862. [9] Oh WJ, Jacinto E. MTOR complex 2 signaling and functions. Cell
Cycle. 2011 Jul 15;10(14):2305–2316. PubMed PMID: 21670596; PubMed Central PMCID: PMCPMC3322468.
[10] Liu P, Gan W, Chin YR, et al. PtdIns(3,4,5)P3-dependent activa-tion of the MTORC2 kinase complex. Cancer Discov.2015Nov;5 (11):1194–1209. PubMed PMID: 26293922; PubMed Central PMCID: PMCPMC4631654.
[11] Inoki K, Ouyang H, Zhu T, et al. TSC2 integrates Wnt and energy signals via a coordinated phosphorylation by AMPK and GSK3 to regulate cell growth. Cell. 2006Sep 08;126(5):955–968. PubMed PMID: 16959574.
[12] Sancak Y, Peterson TR, Shaul YD, et al. The Rag GTPases bind raptor and mediate amino acid signaling to MTORC1. Science.
2008 Jun 13;320(5882):1496–1501. PubMed PMID: 18497260; PubMed Central PMCID: PMCPMC2475333.
[13] Laplante M, Sabatini DM. MTOR signaling at a glance. J Cell Sci.
2009 Oct 15;122(Pt 20):3589–3594. PubMed PMID: 19812304; PubMed Central PMCID: PMCPMC2758797.
[14] Kim E, Goraksha-Hicks P, Li L, et al. Regulation of TORC1 by Rag GTPases in nutrient response. Nat Cell Biol. 2008 Aug;10 (8):935–945. PubMed PMID: 18604198; PubMed Central PMCID: PMCPMC2711503.
[15] Martina JA, Puertollano R. Rag GTPases mediate amino acid-dependent recruitment of TFEB and MITF to lysosomes. J Cell Biol. 2013 Feb 18;200(4):475–491. PubMed PMID: 23401004; PubMed Central PMCID: PMCPMC3575543.
[16] Perera RM, Stoykova S, Nicolay BN, et al. Transcriptional control of autophagy-lysosome function drives pancreatic can-cer metabolism. Nature. 2015 Aug 20;524(7565):361–365.
PubMed PMID: 26168401; PubMed Central PMCID:
PMCPMC5086585.
[17] Palmieri M, Impey S, Kang H, et al. Characterization of the CLEAR network reveals an integrated control of cellular clearance pathways. Hum Mol Genet. 2011 Oct 01;20(19):3852–3866. PubMed PMID: 21752829.
[18] Ploper D, Taelman VF, Robert L, et al. MITF drives endolysoso-mal biogenesis and potentiates Wnt signaling in melanoma cells. Proc Natl Acad Sci U S A.2015 Feb 03;112(5):E420–9. PubMed PMID: 25605940; PubMed Central PMCID: PMCPMC4321275. [19] Martina JA, Diab HI, Lishu L, et al. The nutrient-responsive
transcription factor TFE3 promotes autophagy, lysosomal biogen-esis, and clearance of cellular debris. Sci Signal. 2014 Jan 21;7 (309):ra9. PubMed PMID: 24448649; PubMed Central PMCID: PMCPMC4696865.
[20] Settembre C, Di Malta C, Polito VA, et al. TFEB links autophagy to lysosomal biogenesis. Science. 2011 Jun 17;332(6036):1429– 1433. PubMed PMID: 21617040; PubMed Central PMCID: PMCPMC3638014.
[21] Ozturk DG, Kocak M, Gozuacik D. Cloning of autophagy-related MicroRNAs. Methods Mol Biol.2017 Oct 12. PubMed PMID: 29022289. DOI:10.1007/7651_2017_83.
[22] Gozuacik D, Akkoc Y, Ozturk DG, et al. Autophagy-regulating microRNAs and cancer. Front Oncol.2017;7:65. PubMed PMID: 28459042; PubMed Central PMCID: PMCPMC5394422. [23] Korkmaz G, le Sage C, Tekirdag KA, et al. miR-376b controls
starvation and MTOR inhibition-related autophagy by targeting ATG4C and BECN1. Autophagy. 2012 Feb 1;8(2):165–176. PubMed PMID: 22248718.
[24] Korkmaz G, Tekirdag KA, Ozturk DG, et al. MIR376A is a regulator of starvation-induced autophagy. PLoS One. 2013;8 (12):e82556. PubMed PMID: 24358205; PubMed Central PMCID: PMCPMC3864973.
[25] Tekirdag KA, Akkoc Y, Kosar A, et al. MIR376 family and cancer. Histol Histopathol. 2016 Aug;31(8):841–855. PubMed PMID: 26940843.
[26] Sardiello M, Palmieri M, di Ronza A, et al. A gene network regulating lysosomal biogenesis and function. Science.2009 Jul 24;325(5939):473–477. PubMed PMID: 19556463.
[27] Napolitano G, Ballabio A. TFEB at a glance. J Cell Sci.2016Jul 01;129(13):2475–2481. PubMed PMID: 27252382; PubMed Central PMCID: PMCPMC4958300.
[28] Bouche V, Espinosa AP, Leone L, et al. Drosophila Mitf regulates the V-ATPase and the lysosomal-autophagic pathway. Autophagy.