An Investigation on Airflow Simulation Study on Urban Scale for Passive
Ventilation Strategies
Ramazan Sarı1, Hülya Aybek2
1Antalya Bilim University, Department of Architecture, Antalya, Turkey; [email protected] 2Antalya Bilim University, Department of Architecture, Antalya, Turkey; [email protected]
Abstract
Energy efficient building design has emerged by an active contribution of simulation and analysis tools on design stages. Especially in recent years, the concept of Building Information Modelling (BIM) has introduced a platform that incorporates the entire building lifecycle into the designers during the design phase. The program delivers an opportunity to acquire and manage the building in different design scenarios that have more efficient and more optimized solutions. The oil embargo imposed by OPEC countries in the 1970s emphasized the importance of going for energy consumption, and after these dates, the buildings were forced to be more conservative regarding both heating and cooling costs. To reduce energy consumption reduction of cooling and heating needs and to design more efficient HVAC devices has become a priority. The use of passive ventilation systems is also one of the essential inputs to energy expenditure in structure. In this respect, the obstruction of air flow is considered a critical factor as much as the design of the structure. The condition of surroundings and relations of prevailing wind in a layout of neighboring buildings are curial factors in passive ventilation design. The aim of the research presented here is that passive ventilation must initiate at the urban scale and then be introduced to building scale. Therefore, to be able to use passive ventilation in a building, it is first necessary to layout a city that respects the prevailing wind directions, and speeds then consider the calculation for a structure that can efficiently utilize the winds as natural ventilation element. As a case study, two different textured neighborhoods of Antalya that is a hot and humid city is selected for analyses on building height and the solid-void ratio of city context. The methodology of the research is first, created the mass models in the existing buildings and then, airflow simulation utilized to study the prevailing wind directions and speed derived from national meteorology database. The result of air circulation simulation maps in two neighborhoods in different urban contexts are evaluated and discussed in the paper. The study argue that running any passive design or a green design on only a building scale will underestimate the situation; it needs to be handled on the urban scale. The research aims to contribute to the work that will be done in this direction.
Keywords: Passive Design, Natural Ventilation, Simulation, Urban Design
1. INTRODUCTION
flow around and inside the building are installed. However, it takes too much time and effort to construct the hard model. Furthermore, hard models cannot be so small for enabling instalment of sensors [4]. Generally, 1:200 or 1:300 scale hard models are used for these tests [4, 7]. Nevertheless, there is no opportunity for having adequate wind tunnel test laboratory for making wind tunnel test for each cities in each countries. Active participation of computer aided design and drafting tools enable usage of digital simulation tools in last decades. Computational Fluid Dynamics (CFD) programs are such kind of tools produced for this aim [4, 8]. It is a question for this study for examining Turkish cities by using CFD tools regarding their wind diagrams and city context in terms of potential natural ventilation opportunities of existing city context.
2. RESEARCH METHOD
It has been regarded in this study that evaluation of natural ventilation opportunities of buildings should start from city context. Thus, the following research steps are proceeded in this study as stated in Figure 1. Antalya city is selected for examination. The existing city is categorized regarding the building settlement condition and total floor height of the building as shown in Figure 2 and Table 1. Then digital models representing the exterior volume of the buildings are produced by using Autodesk Revit Architecture. To be accurate, in-use maps provided by metropolitan municipality are used as base and upon these drawings, the mass models are produced as demonstrated in Figure 3. To examine and compare the differences, two area having distinct building settlement type and building height conditions are selected and applied as represented in Figure 4 & 5. Later, regarding the annual wind condition, wind flow is simulated for both of the case areas by using Autodesk Flow Design.
Figure 1. Research steps
Table 1. Comparison of building settlement and height attributes in selected case areas Total Building Footprint
Area in the Island
Voids in the Island
Building Footprint Area Ratio to Void in the Island
Floor Numbers of Buildings
Case Area - I 1516 3574 %42.4 6 to 9
Strategies
Figure 2. Categorization map of Antalya city in terms of differences in building settlement and building
height attributes and demonstration of location of case area – I & II.
Figure 3. Case area – I building mass volume creation upon in – use maps delivered from Antalya
metropolitan municipality
Case Area - I
Figure 5. Annual wind speed and direction maps of the case areas
When two information overlapped in Figure 5, it was resulted that, case areas take an average of 8 m/s airflow. Therefore, in the simulation, airflow is provided from South-Southeast direction with 8 m/s velocity.
3. FINDINGS
By implementing average wind velocity to the case areas, the airflow maps that represented in Figure
5 & 7 for case area – I and Figure 8 & 9 for case area – II were resulted from the simulation. It is
illustrated in the figures that, the air is provided from south-southeast direction in 8 m/s velocity, which is shown in red colored lines. The change in colors of these red lines to yellow and blue means decrease on speed in velocity. By regarding these color range, the evaluation of the airflow maps represented in Figure 6, 7, 8 & 9 were studied.
Strategies
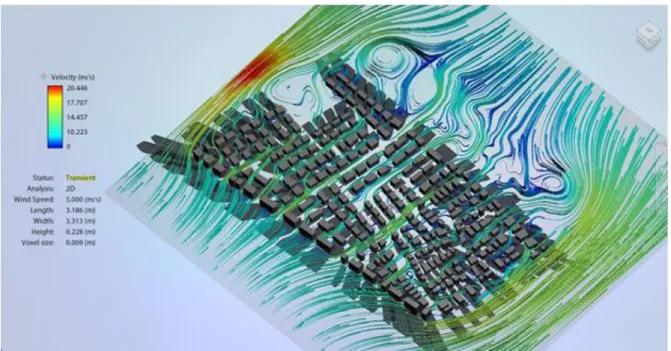
Figure 7. Top view of airflow simulation in case area – I
It is demonstrated in Figure 7 that almost each building have been affected by an equal wind flow due to having enough distance that enable wind penetration. However, in some areas the velocity has decreased due to settlement of building that prevent air movement as shown in areas pinned as number “1”.
Figure 8. Isometric view of airflow simulation in case area – II
1
1
1
1
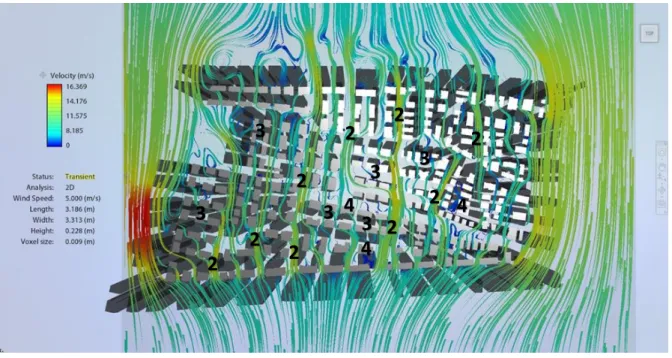
Figure 9. Top view of airflow simulation in case area – II
It is shown in Figure 9 that airflow provided form South-Southeast direction to the site were directed to the slots. This movement increased the velocity of the air in these slots as it is shown with number “2”. The velocity in these slots get increased from 8 m/s to 12 m/s. However, the perpendicular slots which are represented as number “3” takes almost no air flow due to the narrow and air-preventive building settlement. Furthermore, there are a significant number of blue airflow lines observed in these maps as shown in number “4”. Another important feature that affect airflow in case area – II is that the buildings looking at main streets are higher than the remaining buildings at backside. The effect of this situation in airflow map is shown in Figure 10. It is clear from the figure that enabling construction of higher building along street side prevent air penetration to backside of the building islands.
Figure 10. Airflow map showing the effect of constructing higher buildings along street line. The
buildings at backside of building island cannot take air as shown in blue lines.
4. DISCUSSION
When airflow simulation of two case area were compared with each other, it was observed that the buildings in case area – I takes more and homogenous airflow than the buildings in case area – II. In the settlement of case area – II, the buildings that first welcoming the air blockade the air and direct it to the voids in between buildings as it is illustrated in Figure 9 with pinned number “2”. Although this situation increase the velocity of air in these slots and provide benefits to these buildings, the air
2
2
2
2
2
2
3
3
4
3
3
3
4
4
Strategies
cannot penetrate at around these slots as it is shown in Figure 9 with pinned number 3. Therefore, the buildings at backside cannot take benefits from any wind. For the areas pinned with number “2” it is possible to provide strategies to take benefit from passive ventilation systems. However, due to not reaching of any air to these areas, there is not any taken benefit when the same strategies to be implemented in the buildings pinned with number “3”. Furthermore, construction of high rise buildings along street lines blockade the air entrance to the backside of the settlement which these kind of settlement is widely implemented in Turkish cities. The real pictures of both of these case areas are illustrated in Figure 11 & 12, which are typical housing units can be seen in any city of Turkey.
Figure 11. A street view derived from google map of case area – I showing higher buildings along street
line and lower buildings at backside of the building island
enable wind flow to the target building. As a result of this study, in order to take benefit from passive ventilation strategies which will be implemented inside the building, these strategies are required to start evaluation from city scale and neighboring buildings of the desired building. Furthermore, it will be better to be expanded of this study by applying the same simulation strategies in other locations and city and verifying the results derived from the simulations with real cases.
REFERENCES
[1] Omrani, S., et al., Effect of natural ventilation mode on thermal comfort and ventilation
performance: Full-scale measurement. Energy and Buildings, 2017. 156: p. 1-16.
[2] ASCE, The Wind Tunnel and Physical Modeling of the Wind, in Wind Issues in the Design of
Buildings.
[3] Cermak, J.E., et al., Wind Tunnel Investigations of Natural Ventilation. Journal of
Transportation Engineering, 1984. 110(1): p. 67-79.
[4] Su, B. and R. Aynsley, Natural Ventilation in Residential Subdivisions, in Earth & Space 2006.
2006, ASCE.
[5] ASCE, Wind-Tunnel Studies of Buildings and Structures. Journal of Aerospace Engineering,
1996. 9(1): p. 19-36.
[6] Vitruvius, Mimarlık Üzerine 10 Kitap. 6th ed.: Şevki Vanlı Mimarlık Vakfı.
[7] Sheng, R., et al., Wind tunnel study of wind effects on a high-rise building at a scale of 1:300.
Journal of Wind Engineering and Industrial Aerodynamics, 2018. 174: p. 391-403.
[8] Li, Y., Q.S. Li, and F. Chen, Wind tunnel study of wind-induced torques on L-shaped tall buildings.