O
RIGINAL
D
ATA
Association of Resistin Gene 3’-Untranslated Region
EX4-44G→A Polymorphism with Obesity- and Insulin-Related
Phenotypes in Turkish Type 2 Diabetes Patients
Belgin Süsleyici Duman
1, Penbe Cagatay
2, Hüsrev Hatemi
3and Melek Öztürk
41 Department of Medical Biology and Genetics, Faculty of Medicine, Istanbul Science University, Istanbul, Turkey. 2 Department of
Biostatistics, Cerrahpasa Faculty of Medicine, Istanbul University, Istanbul, Turkey. 3 Turkish Diabetes Hospital, Dr. Celal Oker
Street. No. 10, Harbiye, Turkey. 4 Department of Medical Biology, Cerrahpasa Faculty of Medicine, Istanbul University, Istanbul,
Turkey. Address correspondence to: Melek Öztürk, e-mail: [email protected]
■
Abstract
Resistin, an adipocyte-secreted hormone, has been associ-ated with obesity, insulin resistance and type 2 diabetes mel-litus (T2DM) in some, but not all, rodent models. In hu-mans, the exact function of resistin is unkown. Because 3’-untranslated region (3’-UTR) single nucleotide substitutions (SNPs) have been shown to affect gene expression, we ex-amined the EX4-44G→A SNP in the 3’-UTR of exon 3 within the resistin gene. The objective of this study was to investigate, for the first time in a Turkish study group, whether the 3’-UTR EX4-44G→A variation in the resistin gene influences the development of T2DM, obesity and in-sulin-related phenotypes. We analyzed the genotype fre-quencies of the EX4-44G→A polymorphism of the resistin gene in 116 type 2 diabetic and 102 normal subjects. Serum lipids, obesity-related and insulin-related phenotypes were analyzed. No significant difference for genotypic frequencies
were observed for the BseRI restriction site in type 2 dia-betic patients as compared to controls. Waist-to-hip ratio, BMI, body fat and apoAI levels were found to be affected by resistin genotype. In the control group, BMI (p < 0.01), HIS (p < 0.05) and BF (p < 0.05) levels were found to be elevated, whereas HOMA β-cell index (p < 0.01) and apo AI (p < 0.05) levels were found to be decreased in GG geno-type carriers. In the diabetic group, the GG genogeno-type carri-ers were found to have higher BMI levels (p<0.001), waist-to-hip ratio (p < 0.05), body fat (p < 0.01), HOMA (p < 0.001) and fasting insulin (p < 0.05), but lower HbA1c levels in comparison to GC + AA carriers. These data suggest that, in the Turkish study group, the EX4-44G→A poly-morphism of the resistin gene is associated with insulin and obesity-related phenotypes.
Keywords: EX4-44G→A polymorphism · type 2 diabetes
· resistin · obesity · insulin resistance · body fat
Introduction
nsulin resistance precedes and predicts the onset of type 2 diabetes (T2DM) [1, 2]. Although insu- lin resistance (IR) correlates with fat mass and obesity, the mechanism associated with elevated body fat which causes reduced insulin sensitivity (IS) is un-known. Resistin, as an insulin antagonist, modulates
several steps in the insulin signaling pathway and may play a role in the pathogenesis of IR. Resistin is over-expressed in the human adipose tissue of obese indi-viduals and is likely to modulate insulin sensitivity [3]. Resistin is, therefore, a candidate gene for IR and T2DM. Resistin gene variations in ethnic populations and its familial transmission suggest that IR is geneti-cally determined.
Adipocytes secrete a number of factors that might modulate IS, including resistin [3], free fatty acids (FFAs) [4], TNF-α [5], interleukin-6 (IL-6) [6] and adi-ponectin [7] among other probable factors. Resistin, a cysteine-rich, adipocyte-specific secretory factor, was first identified in mouse adipocytes. Resistin levels are increased in both genetically and diet-induced obese mice. It has been suggested that resistin links obesity to diabetes. Exogenous resistin was found to alter glu-cose tolerance and insulin action in mice, while thia-zolidinedione treatment greatly downregulates resistin expression. Resistin protein neutralization enhances blood glucose uptake and IS [8].
The EX4-44G→A single nucleotide polymorphism (SNP) of the resistin gene is present in the 3’-UTR of exon 3, 60 bp 3’ from the stop codon and 8 bp 5’ from the AATAAA polyadenylation signal. Published stud-ies of resistin gene expression in humans are contro-versial. Resistin mRNA is not detectable in the white adipose tissue (WAT) of lean subjects [9]. Although resistin transcript is found in the WAT of obese indi-viduals, no correlation has been found between body weight, adiposity, IR and resistin mRNA level [9, 10]. Resistin receptors and their mechanisms of action are unknown. Intraperitoneally administered resistin ele-vates blood glucose and insulin concentration in mice and impairs hypoglycemic response to insulin infusion. Additionally, anti-resistin antibodies decrease blood glucose and improve IS in obese mice [8]. Resistin may be an important link between increased fat mass and IR. The finding that the markedly increased serum lev-els of resistin in obese mice are reduced by rosiglita-zone and other thiazolidinediones that increase IS, in-dicate that resistin is a mediator of IR. Resistin may regulate fat mass through negative feedback: it is in-creased during adiposcyte differentiation, but also seems to inhibit adipogenesis. Since energy metabolism differs in mice and humans, it is probable that the physiology of resistin in mice is different from hu-mans. Mutations in the resistin gene may contribute to genetic susceptibility to IR and T2DM in humans.
We examined the resistin gene 3’-UTR EX4-44G→A polymorphism in type 2 diabetic and normal subjects, to establish whether this variation in the re-sistin gene might contribute to insulin and obesity-related traits.
Methods
Population sample
We studied 116 (age: 57.41 ± 9.14 years) unrelated type 2 diabetic patients (48 men and 68 women), who were outpatients of the Turkish Diabetes Hospital (İs-tanbul, Turkey). Age at diabetes onset was 43.91 ±
11.25 years. Type 2 diabetic patients were selected ac-cording to WHO criteria [11]. Of the 116 type 2 dia-betic patients, 65 were treated with sulphonylurea drugs, 38 with metformin and 13 with sulphonylurea drugs in combination with metformin. The study pro-tocol was approved by the Ethics Committee of the Istanbul University, Cerrahpasa Faculty of Medicine and informed consent was obtained from each partici-pant. The control group consisted of 102 (age: 55.15 ±
11.58 years) unrelated healthy individuals (31 men, 71 women) without medication, who either attended a routine health check at a general practice or were staff of the Cerrahpasa Faculty of Medicine (Istanbul Uni-versity, Turkey). The hepatic and endocrine functions of the patients were normal and all were relatively well controlled with glycosylated hemoglobin (HbA1c) <6-7% (normal range <<6-7%). Patients with macro- and mi-croangiopathic complications were excluded from this study. No member of the sample populations admitted to alcohol intake and none had a history of smoking.
Clinical and biochemical evaluation
Blood samples were collected after overnight (>12 h) fasting. Serum was obtained after leaving the blood tubes for 30 minutes at room temperature, followed by 10 minutes centrifugation. Body mass index (BMI) was calculated and overweight was defined as a value of
≥25 kg/m2 [12]. The biochemical analyses included de-termination of fasting plasma glucose, triacylglycerol (TAG), total cholesterol (T-Chol), apolipoprotein E (apo E), apolipoprotein AI (apo AI) and apolipopro-tein B (apo B). Serum TAG and T-Chol levels were measured using standard enzymatic methods (Merck, Darmstadt, Germany), automated on an AU5021 (Olympus, Merck). Serum apo E was determined by turbidimetry automated on a Cobas Mira analyzer (Roche, Meylan, France). Serum apo AI and apo B were determined by immunonephelometry on a
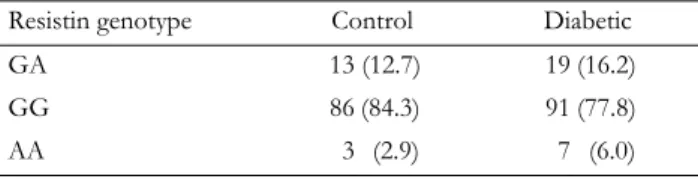
Table 1. Resistin genotype frequencies in type 2 diabetic patients
and control subjects
Resistin genotype Control Diabetic
GA 13 (12.7) 19(16.2)
GG 86(84.3) 91(77.8)
AA 3 (2.9) 7 (6.0)
Legend: Results are expressed as numbers (percentages). The resistin
geno-type frequencies of the control and diabetic groups were compared using
Behring Nephelometer analyzer with Behring reagents (Behringwerke, Marburg, Germany). Sera were ana-lyzed without pretreatment and diluted in double-distilled water when lipid or apolipoprotein levels ex-ceeded reference values. Pooled sera were included in each series of measurements for apo E. Between assays the coefficient of variation of these methods was 2.14%, 4.66%, 0.95%, 1.52%, 2.92%, 4.34%, 1.53% respectively for T-Chol, TAG, glucose, apo E, apo AI and apo B.
Waist-to-hip ratio
Waist circumference was measured at the level of umbilicus while the subject was standing and breathing normally. Hip circumference was measured at the level of greatest hip girth.
The quantification of body fat
At first, lean body mass (LBM) was calculated by the formulas described by Hume [13]. For males the
LBM is calculated as fol-lows: LBM (kg) = 0.32810 × weight (in kg) + 0.33929 × height (in cm) - 29.5336 and for females: LBM (kg) = 0.29569 × weight (in kg) + 0.41893 × height (in cm) - 43.2933. Body fat was calculated by sub-tracting lean body mass from present body weight (PBW).
Pancreatic β-cell secretory ca-pacity
Pancreatic β-cell sec-retory capacity was esti-mated by the β-cell index (index of β-cell secretory force, HOMA β-cell in-dex) using the formula proposed by Hosker et al. [14]: HOMA β-cell index = 20 × IF / (GF - 3.5) where IF = fasting insulin (in µU/ml) and GF = fasting plasma glucose (in mg/dl).
The rate of insulin resistance
The rate of insulin resistance was evaluated by the homeostatic model assessment devised by Matthews et
al. [15] and calculated by the formula described by
Bonora et al. [16]: Insulin resistance (IR) = fasting se-rum insulin (in µU/ml) × fasting plasma glucose (in
mmol/l) / 22.5.
Hepatic insulin sensitivity
Hepatic insulin sensitivity was assessed using the following formula devised by Matsuda and DeFronzo [17]: hepatic insulin sensitivity (HIS) = k / GF (in mg/dl) × IF (in µU/ml) where k = 22.5 × 18 = 405.
Molecular analysis
Genomic DNA was extracted from leukocytes by a salting out procedure [18]. The 3’-UTR of exon 3 (EX4-44G→A), was amplified by PCR using the re-sistin BseRI protocol with the relevant primers (Gibco BRL, Rockville, MD, USA): RE1:5’-AGAGTCCAC
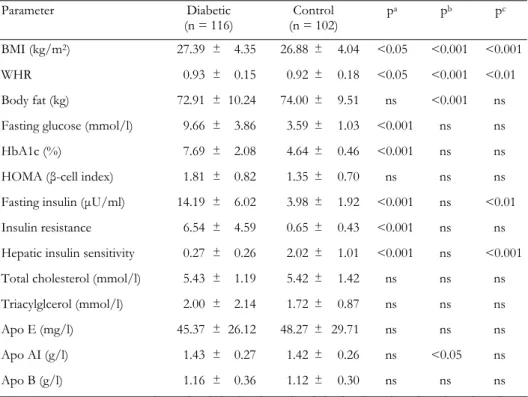
Table 2. Clinical and biochemical characteristics of type 2 diabetic patients and control subjects
Parameter Diabetic (n = 116) Control (n = 102) pa pb pc BMI (kg/m2) 27.39 ± 4.35 26.88± 4.04 <0.05 <0.001 <0.001 WHR 0.93 ± 0.15 0.92± 0.18 <0.05 <0.001 <0.01 Body fat (kg) 72.91 ± 10.24 74.00± 9.51 ns <0.001 ns Fasting glucose (mmol/l) 9.66 ± 3.86 3.59± 1.03 <0.001 ns ns HbA1c (%) 7.69 ± 2.08 4.64± 0.46 <0.001 ns ns HOMA (β-cell index) 1.81 ± 0.82 1.35± 0.70 ns ns ns Fasting insulin (µU/ml) 14.19 ± 6.02 3.98± 1.92 <0.001 ns <0.01 Insulin resistance 6.54 ± 4.59 0.65± 0.43 <0.001 ns ns Hepatic insulin sensitivity 0.27 ± 0.26 2.02± 1.01 <0.001 ns <0.001 Total cholesterol (mmol/l) 5.43 ± 1.19 5.42± 1.42 ns ns ns Triacylglcerol (mmol/l) 2.00 ± 2.14 1.72± 0.87 ns ns ns Apo E (mg/l) 45.37 ± 26.12 48.27± 29.71 ns ns ns Apo AI (g/l) 1.43 ± 0.27 1.42± 0.26 ns <0.05 ns Apo B (g/l) 1.16 ± 0.36 1.12± 0.30 ns ns ns
Legend: Values represent mean ± SD. ns: not significant. p values are corrected for multiple comparisons
(Bon-ferroni). a: control vs. diabetes. b: resistin genotype effect (GA + AA vs. GG). c: difference of resistin genotypes between diabetic and control groups. BMI: body mass index. WHR: waist-to-hip ratio. HOMA: homeostasis mo-del assessment (= 20 × fasting insulin / (fasting plasma glucose - 3.5)). Apo: Apolipoprotein. Insulin resistance = fasting serum insulin (in µU/ml) × fasting plasma glucose (in mmol/l) / 22.5. Hepatic insulin sensitivity = k /
GCTCCTGTGTT- 3’ and RE2:5’-TCATCATCATCA TCTCCAGGTT- 3’ [19]. The final amplification products were submitted to digestion with the restric-tion BseRI and visualized on 1.5% agarose gel. The re-sistin allele with the restriction sites present for the en-zyme BseRI is designated as A and the allele lacking the restriction site as G.
Statistical analysis
Statistical analyses were conducted using Unistat 5.1 software. Data are expressed as numbers and per-centages for discrete variables and as mean ± standard deviation (SD) for continuous variables. Serum TAG were logarithmically transformed before the analysis to obtain normal distribution of data. Bonferroni correc-tion for multiple testing has been applied (Table 2). Hardy-Weinberg equilibrium for genotype frequencies was estimated by the Chi-square test. p values less than 0.05 were considered significant.
Results
The genotype frequency dis-tributions for the type 2 dia-betic and control groups with respect to BseRI polymorphism are compared in Table 1. The sequence variant was found in 26 of 116 diabetic subjects (7 homozygous and 19 heterozy-gous) and in 16 of the control subjects (3 homozygous and 13 heterozygous). The frequency of the EX4-44G→A allele was not significantly different among groups (χ2 = 1.818, p = 0.397). The clinical characteris-tics of the study subjects and the effects of resistin EX4-44G→A polymorphism are shown in Table 2.
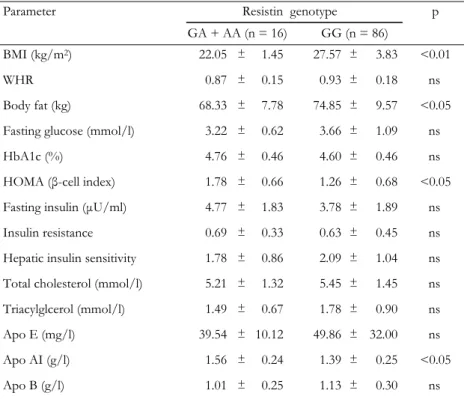
No significant difference was observed for the analyzed lipid and lipoprotein levels when the diabetic and control groups were compared. Waist-to-hip ratio (WHR) (p < 0.05), fasting glucose (p < 0.001), in-sulin (p < 0.001), HbA1c (p < 0.001), IR (p < 0.001) and HOMA β-cell index (p < 0.001) were significantly higher in dia-betic patients compared to controls, whereas HIS (p < 0.001) was higher in controls. ApoAI (p < 0.05), WHR (p < 0.001), BF (p < 0.001) and BMI (p < 0.001) measures differed as a function of resistin genotypes. To test whether the EX4-44G→A SNP could be asso-ciated with any of the obesity, insulin or diabetes-related phenotypes, we compared clinical and meta-bolic parameters (BMI, blood glucose, insulin, HOMA β-cell index, BF, IR, HIS and lipid profile) between re-sistin EX4-44G→A SNP genotypes for control sub-jects (Table 3) and type 2 diabetic patients (Table 4). The AA genotype carriers were combined with GA genotype carriers because of the low sample number. In the control group, BMI (p < 0.01) and body fat (p < 0.05) levels were found to be elevated, while HOMA (p < 0.05) and apo AI (p < 0.05) levels were found to be decreased in GG genotype carriers when compared to GA + AA genotype carriers (Table 3). In the dia-betic group, the GG genotype carriers were found to have higher BMI (p < 0.001), waist-to-hip ratio (p <
Table 3. Clinical and biochemical characteristics by resistin genotypes in the control
group
Parameter Resistin genotype
GA + AA (n = 16) GG (n = 86)
p
BMI (kg/m2) 22.05 ± 1.45 27.57 ± 3.83 <0.01 WHR 0.87 ± 0.15 0.93 ± 0.18 ns Body fat (kg) 68.33 ± 7.78 74.85 ± 9.57 <0.05 Fasting glucose (mmol/l) 3.22 ± 0.62 3.66 ± 1.09 ns HbA1c (%) 4.76 ± 0.46 4.60 ± 0.46 ns HOMA (β-cell index) 1.78 ± 0.66 1.26 ± 0.68 <0.05 Fasting insulin (µU/ml) 4.77 ± 1.83 3.78 ± 1.89 ns Insulin resistance 0.69 ± 0.33 0.63 ± 0.45 ns Hepatic insulin sensitivity 1.78 ± 0.86 2.09 ± 1.04 ns Total cholesterol (mmol/l) 5.21 ± 1.32 5.45 ± 1.45 ns Triacylglcerol (mmol/l) 1.49 ± 0.67 1.78 ± 0.90 ns Apo E (mg/l) 39.54 ± 10.12 49.86 ± 32.00 ns Apo AI (g/l) 1.56 ± 0.24 1.39 ± 0.25 <0.05 Apo B (g/l) 1.01 ± 0.25 1.13 ± 0.30 ns
Legend: Values are expressed as mean ± SD. p: value of resistin genotype effect (GA + AA vs.
GG). Groups were compared using Student’s t-test for the variables. ns: not significant. BMI: body mass index. WHR: waist-to-hip ratio. HOMA: homeostasis model assessment (= 20 × fasting insu-lin / (fasting plasma glucose - 3.5)). Apo: Apolipoprotein. Insuinsu-lin resistance = fasting serum insuinsu-lin (in µU/ml) × fasting plasma glucose (in mmol/l) / 22.5. Hepatic insulin sensitivity = k / fasting
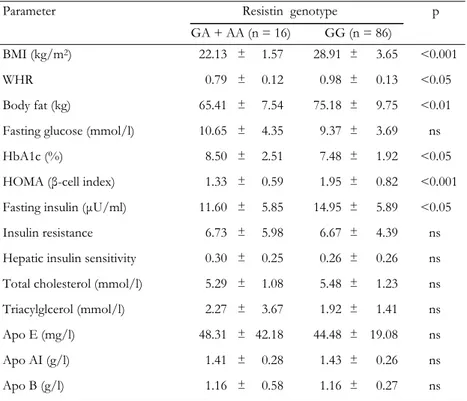
0.05), body fat (p < 0.01), HOMA (p < 0.001) and fasting insulin (p < 0.05) but lower HbA1c levels (p < 0.05) in comparison to GC + AA genotype carriers (Table 4).
Discussion
Possible relationships between resistin gene poly-morphisms and T2DM have been investigated in various studies [20-27]. Specifically, the analysis of a Japanese population consisting of 99 T2DM patients and 99 controls did not find any associations between three intronic SNPs and T2DM [23]. In another study, the coding region SNP (EX4-44G→A) was examined in 198 obese, 207 diabetic and 186 control subjects in an Italian population and was not found to be associ-ated with obesity and T2DM [19]. Another study from Italy including 203 nondiabetic subjects from Sicily and 456 nondiabetic subjects from the Gargano region identified an ATG repeat in the 3’-UTR of the human
resistin gene asociated with in-creased insulin sensitivity [20]. Wang et al. [28] examined re-sistin variants located in the promoter, intron 2, intron 3, 3’-UTR and 3’-flanking regions in a population of Northern European ancestry consisting of 68 patients with T2DM, 61 nondiabetic individuals with a family history of diabetes melli-tus and 118 nondiabetic con-trols with no family history of diabetes mellitus. They found no association between the eight SNPs and one GAT mi-crosatellite examined and either T2DM or BMI. Two 5’-flanking variants were associ-ated with BMI but not with T2DM in a Canadian popula-tion. Interestingly, the same variants had no association with BMI or T2DM in a population from Scandinavia [21]. Ma et al. [22] showed that the 181G-A resistin gene variant is not asso-ciated with T2DM. Further-more, Urbanek et al. [29] found no association between an SNP in the promoter region of the resistin gene and obesity or IR. Only two studies have found an association be-tween a resistin gene polymorphism and T2DM, one in a Chinese [25] and one in a Japanese [26] popula-tion. Specifically, Tan et al. [25] found an association between the 3’-UTR +62G-A polymorphism and a de-cresed risk for T2DM as well as a lower prevalence of hypertension in the A allele carriers in the diabetic but not in the control group. Osawa et al. [26] found that the -420G/G resistin genotype is associated with an increased promoter activity through specific Sp1/3 binding, which, in turn, leads to increased resistin lev-els and to an increased risk of T2DM. In general, it has been observed that the pattern of traits associated with resistin polymorphisms has been highly contradictory. In the present study we found an association between the presence of the 3’UTR EX4-44G→A polymor-phism of the resistin gene and BMI, HOMA, body fat and apo AI levels in the control group and BMI, HOMA, body fat, and fasting insulin in the T2DM group.
Table 4. Clinical and biochemical characteristics by resistin genotypes in the type 2
dia-betic group
Parameter Resistin genotype
GA + AA (n = 16) GG (n = 86) p
BMI (kg/m2) 22.13 ± 1.57 28.91 ± 3.65 <0.001 WHR 0.79 ± 0.12 0.98 ± 0.13 <0.05 Body fat (kg) 65.41 ± 7.54 75.18 ± 9.75 <0.01 Fasting glucose (mmol/l) 10.65 ± 4.35 9.37 ± 3.69 ns HbA1c (%) 8.50 ± 2.51 7.48 ± 1.92 <0.05 HOMA (β-cell index) 1.33 ± 0.59 1.95 ± 0.82 <0.001 Fasting insulin (µU/ml) 11.60 ± 5.85 14.95 ± 5.89 <0.05 Insulin resistance 6.73 ± 5.98 6.67 ± 4.39 ns Hepatic insulin sensitivity 0.30 ± 0.25 0.26 ± 0.26 ns Total cholesterol (mmol/l) 5.29 ± 1.08 5.48 ± 1.23 ns Triacylglcerol (mmol/l) 2.27 ± 3.67 1.92 ± 1.41 ns Apo E (mg/l) 48.31 ± 42.18 44.48 ± 19.08 ns Apo AI (g/l) 1.41 ± 0.28 1.43 ± 0.26 ns Apo B (g/l) 1.16 ± 0.58 1.16 ± 0.27 ns
Legend: Values are expressed as mean ± SD. p: value of resistin genotype effect (GA + AA vs.
GG). Groups were compared using Student’s t-test for the variables. ns: not significant. BMI: body mass index. WHR: waist-to-hip ratio. HOMA: homeostasis model assessment (= 20 × fasting insu-lin / (fasting plasma glucose - 3.5)). Apo: Apolipoprotein. Insuinsu-lin resistance = fasting serum insuinsu-lin (in µU/ml) × fasting plasma glucose (in mmol/l) / 22.5. Hepatic insulin sensitivity = k / fasting
Patients with T2DM have, as a group, higher IR than nondiabetics. It is known that IR is virtually uni-versal and maximal when BMI exceeds 30 kg m-2 [30]. Studies in humans support the hypothesis that resistin has a potential role in insulin resistance [31-33]. How-ever, the role of resistin in insulin resistance in humans is controversial. In the present study, no significant re-lationship was found between EX4-44G→A polymor-phism and IR. Sentinelli et al. [19] have analyzed the frequency of EX4-44G→A SNP of the resistin gene and found no significant association between this vari-ant and diabetes and obesity. Regarding BMI, only one, namely the -420C→G polymorphism, has been shown to be associated with BMI in Brazilian women but not in men [34]. Interestingly, Engert et al. also found an association between the -420C→G as well as the -537A→C polymorphims and BMI in a Canadian but not in a Scandinavian population [21]. In our study, the EX4-44G→A variant of the resistin gene was found to be associated with BMI, BF and WHCR levels and thus with obesity. In agreement with the genotype frequency found by Sentinelli et al. [19], we did not find any significant difference among the T2DM and control groups, when the frequency of re-sistin genotypes were compared. Sentinelli et al. could not show any significant differences in clinical and metabolic parameters between EX4-44G→A carriers and noncarriers [19]. In contrast, we observed signifi-cant differences in the levels of apoAI, body fat, HOMA and BMI between GC and GG genotypes of the resistin gene in the controls, while body fat, HOMA, insulin and BMI levels were found to differ among genotypes of the T2DM group. Ethnic differ-ences as well as variable gene-environment interactions influencing the phenotypic expression of the variant could be possible explanations for the discordant re-sults between the Turkish subjects in the present study and the Italian subjects [19]. Furthermore, it cannot be ruled out that the associations found in the present study may be due to another polymorphism in linkage disequilibrium with the variant studied.
To date, among the resistin variants investigated, only one has been associated with HDL cholesterol levels, namely +1084G→A [35], and one with TAG levels, namely an ATG repeat [20]. Both are located in the 3’-UTR. Associations have been published be-tween various resistin gene SNPs and serum TAG and fasting blood glucose concentrations [23] as well as HDL cholesterol levels [35]. Interestingly, plasma re-sistin levels per se have also been shown not to be as-sociated with LDL cholesterol, HDL cholesterol and TAG levels [36]. In the present study we found an as-sociation of EX4-44G→A polymorphism only with apo AI. Apo AI levels were higher in controls with the GC genotype when compared to the GG phenotype. Although the exact role of resistin in the pathogenesis of T2DM has not been established, the allele and genotype frequencies of several SNPs of the resistin gene have been compared between T2DM patients and controls. In concordance with our results, associa-tions between T2DM and resistin gene polymorphisms were not found in most of the studies [20, 21-24, 28], while only in a few studies was an association between 3’-UTR 62G-A variant and a decreased risk of T2DM observed [25, 26].
In conclusion, the present study suggests that, in a Turkish population, the EX4-44G→A polymorphism of the resistin gene is associated with obesity and insu-lin-related phenotypes. Altough our data would sup-port a functional role of resistin in human HIS, addi-tional work is needed to explore the role of resistin in IS, IR and obesity. Further studies and the functional analysis of this variant are required to clarify the role of the resistin gene polymorphism in the pathophysiology of T2DM. The hypothesis proposed by this study must be replicated in other populations with a higher num-ber of subjects in order to confirm the significance of this variant in the relationship of obesity and insulin-related traits.
Acknowledgments: This study was funded by the Research
Fund of the University of Istanbul, project number: BYP-468/09092004.
■
References
1. Martin BC, Warram JH, Rosner B, Rich SS, Soeldner JS,
Krolewski AS. Familial clustering of insulin sensitivity. Diabetes
1992. 41:850-854.
2. Warram JH, Martin BC, Krolewski AS, Soeldner JS, Kahn
CR. Slow glucose removal rate and hyperinsulinemia precede
the development of type II diabetes in the offspring of diabetic parents. Ann Intern Med 1990. 113:909-915.
3. Kim KH, Lee K, Moon YS, Sul HS. A Cysteine-rich Adipose Tissue-specific Secretory Factor Inhibits Adipocyte Differen-tiation. J Biol Chem 2001. 276: 11252-11256.
4. Boden G. Role of fatty acids in the pathogenesis of insulin resistance and NIDDM. Diabetes 1997. 46:3-10.
5. Moller DE. Potential role of TNF-alpha in the pathogenesis of insulin resistance and type 2 diabetes. Trends Endocrinol Metab 2000. 11:212-217.
6. Fernandez-Real JM, Broch M, Vendrell J, Gutierrez C,
Casamitjana R, Pugeat M, Richart C, Ricart W.
Inter-leukin-6 gene polymorphism and insulin sensitivity. Diabetes 2000. 49:517-520.
7. Weyer C, Funahashi T, Tanaka S, Hotta K, Matsuzawa Y,
Pratley RE, Tataranni PA. Hypoadiponectinemia in obesity
and hyperinsulinemia. J Clin Endocrinol Metab 2001. 86:1930-1935.
8. Steppan CM, Bailey ST, Bhat S, Brown EJ, Banerjee RR,
Wright CM, Patel HR, Ahima RS, Lazar MA. The
hor-mone resistin links obesity to diabetes. Nature 2001. 409:307-312.
9. Savage DB, Sewter CP, Klenk ES, Segal DG, Vidal-Puig
A, Considine RV, O’Rahilly S. Resistin / Fizz3 expression in
relation to obesity and peroxisome proliferator-activated recep-tor-gamma action in humans. Diabetes 2001. 50:2199-2202. 10. Janke J, Engeli S, Gorzelniak K, Luft FC, Sharma AM.
Resistin gene expression in human adipocytes is not related to insulin resistance. Obes Res 2002. 10:1-5.
11. World Health Organization. Definition, Diagnosis and Clas-sification of Diabetes Mellitus and Its Complications. Geneva, World Health Organization, 1999.
12. Arroyo P, Pardio J, Fernandez V, Vargas-Ancona L, Canul
G, Loria A. Obesity and cultural environment in the Yucatan
region. Nutr Rev 1999. 57(5 Pt 2):S78-S82.
13. Hume R. Prediction of lean body mass from height and weight. J Clin Path 1966. 19:389-395.
14. Hosker JP, Matthews DR, Rudenski AS, Burnett MA,
Darling P, Bown EG, Turner RC. Continuous infusion of
glucose with model assessment: measurement of insulin and beta-cell function in man. Diabetologia 1985. 28:401-411. 15. Matthews DR, Hosker JP, Rudenski AS, Naylor BA,
Treacher DF, Turner RC. Homeostasis model assessment:
insulin resistance and beta-cell function from fasting plasma glucose and insulin concentrations in man. Diabetologia 1985. 28:412-419.
16. Bonora E, Targher G, Alberiche M, Bonadonna RC,
Saggiani F, Zenere MB, Monauni T, Muggeo M.
Homeo-stasis model assessment closely mirrors the glucose clamp technique in the assessment of insulin sensitivity: Studies in subjects with various degrees of glucose tolerance and insulin sensitivity. Diabetes Care 2000. 23:57-63.
17. Matsuda M, DeFronzo RA. Insulin sensitivity indices ob-tained from oral glucose tolerance testing. Diabetes Care 1999. 22:1462-1470.
18. Miller SA, Dykes DD, Polesky HF. A simple salting out procedure for extracting DNA from nucleated cells. Nucleic
Ac-ids Research 1988. 16(3):1215.
19. Sentinelli F, Romeo S, Arca M, Filippi E, Leonetti F,
Banchieri M, Di Mario U, Baroni MG. Human resistin
gene, obesity, and type 2 diabetes: mutation analysis and popu-lation study. Diabetes 2002. 51:860-862.
20. Pizzuti A, Argiolas A, Di Paola R, Baratta R, Rauseo A,
Bozzali M, Vigneri R, Dallapiccola B, Trischitta V, Frittitta L. An ATG repeat in the 3’-untranslated region of the
human resistin gene is associated with a decreased risk of insu-lin resistance. J Cinsu-lin Endocrinol Metab 2002. 87:4403-4406. 21. Engert JC, Vohl MC, Williams SM, Lepage P,
Loredo-Osti JC, Faith J, Dore C, Renaud Y, Burtt NP, Villeneuve A, et al. 5’ flanking variants of resistin are associated with
obe-sity. Diabetes 2002. 51:1629-1634.
22. Ma X, Warram JH, Trischitta V, Doria A. Genetic variants at the resistin locus and risk of type 2 diabetes in Caucasians. J
Clin Endocrinol Metab 2002. 87:4407-4410.
23. Osawa H, Onuma H, Murakami A, Ochi M, Nishimiya
T, Kato K, Shimizu I, Fujii Y, Ohashi J, Makino H.
Sys-tematic search for single nucleotide polymorphisms in the re-sistin gene: the absence of evidence for the association of three identified single nucleotide polymorphisms with Japanese type 2 diabetes. Diabetes 2002. 51:863-866.
24. Ochi M, Osawa H, Onuma H, Murakami A, Nishimiya
T, Shimada F, Kato K, Shimizu I, Shishino K, Murase M, et al. The absence of evidence for major effects of the
fre-quent SNP +299G>A in the resistin gene on susceptibility to insulin resistance syndrome associated with Japanese type 2 diabetes. Diabetes Res Clin Pract 2003. 61(3):191-198.
25. Tan MS, Chang SY, Chang DM, Tsai JC, Lee YJ. Associa-tion of resistin gene 3’-untranslated region +62G-->A poly-morphism with type 2 diabetes and hypertension in a Chinese population. J Clin Endocrinol Metab 2003. 88(3):1258-1263. 26. Osawa H, Yamada K, Onuma H, Murakami A, Ochi M,
Kawata H, Nishimiya T, Niiya T, Shimizu I, Nishida W, et al. The G/G genotype of a resistin single-nucleotide
poly-morphism at -420 increases type 2 diabetes mellitus susceptibil-ity by inducing promoter activsusceptibil-ity through specific binding of Sp1/3. Am J Hum Genet 2004. 75:678-686.
27. Kunnari A, Ukkola O, Kesaniemi YA. Resistin polymor-phisms are associated with cerebrovascular disease in Finnish Type 2 diabetic patients. Diabet Med 2005. 22:583-589.
28. Wang H, Chu WS, Hemphill C, Elbein SC. Human resistin gene: molecular scanning and evaluation of association with in-sulin sensitivity and type 2 diabetes in Caucasians. J Clin
Endo-crinol Metab 2002. 87:2520-2524.
29. Urbanek M, Du Y, Silander K, Collins FS, Steppan CM,
Strauss JF 3rd, Dunaif A, Spielman RS, Legro RS.
Varia-tion in resistin gene promoter not associated with polycystic ovary syndrome. Diabetes 2003. 52:214-217.
30. Kahn SE, Prigeon RL, McCulloch DK, Boyko EJ,
Bergman RN, Schwartz MW, Neifing JL, Ward WK, Beard JC, Palmer JP, et al. Quantification of the relationship
between insulin sensitivity and beta-cell function in human subjects. Evidence for a hyperbolic function. Diabetes 1993. 42:1663-1672.
31. McTernan CL, McTernan PG, Harte AL, Levick PL,
Barnett AH, Kumar S. Resistin, central obesity, and type 2
diabetes. Lancet 2002. 359:46-47.
32. McTernan CL, McTernan PG, Harte AL, Levick PL,
Barnett AH, Kumar S. Increased resistin gene and protein
expression in human abdominal adipose tissue. J Clin Endocrinol
Metab 2002. 87:2407.
33. Yannakoulia M, Yiannakouris N, Bluher S, Matalas AL,
Klimis-Zacas D, Mantzoros CS. Body fat mass and
macro-nutrient intake in relation to circulating soluble leptin receptor, free leptin index, adiponectin, and resistin concentrations in healthy humans. J Clin Endocrinol Metab 2003. 88:1730-1736. 34. Mattevi VS, Zembrzuski VM, Hutz MH. A resistin gene
polymorphism is associated with body mass index in women.
Hum Genet 2004. 115:208-212.
35. Conneely KN, Silander K, Scott LJ, Mohlke KL, Lazaridis
KN, Valle TT, Tuomilehto J, Bergman RN, Watanabe RM, Buchanan TA, et al. Variation in the resistin gene is
as-sociated with obesity and insulin-related phenotypes in Finnish subjects. Diabetologia 2004. 47:1782-1788.
36. Reilly MP, Lehrke M, Wolfe ML, Rohatgi A, Lazar MA,
Rader DJ. Resistin is an inflammatory marker of