Türkiye’de Adalet Harcamaları ve
Uluslararası Karşılaş9rmalar
Hazırlayan: Hande Özhabeş
Katkıda Bulunanlar: Nurhan Yentürk
Yakup Kadri Karabacak
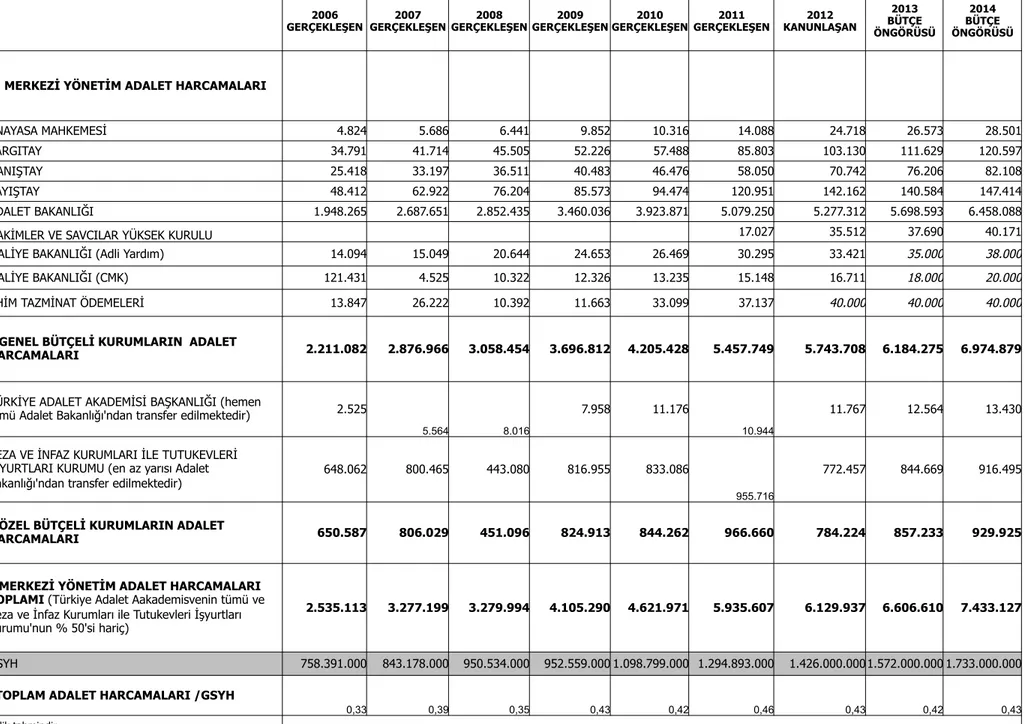
TABLO 1: 2006-2014, ADALET HARCAMALARINI İZLEME TABLOSU, BİN TL GERÇEKLEŞEN 2006 GERÇEKLEŞEN 2007 GERÇEKLEŞEN 2008 GERÇEKLEŞEN 2009 GERÇEKLEŞEN 2010 GERÇEKLEŞEN 2011 KANUNLAŞAN 2012 BÜTÇE 2013
ÖNGÖRÜSÜ
2014 BÜTÇE ÖNGÖRÜSÜ
A: MERKEZİ YÖNETİM ADALET HARCAMALARI
ANAYASA MAHKEMESİ 4.824 5.686 6.441 9.852 10.316 14.088 24.718 26.573 28.501 YARGITAY 34.791 41.714 45.505 52.226 57.488 85.803 103.130 111.629 120.597 DANIŞTAY 25.418 33.197 36.511 40.483 46.476 58.050 70.742 76.206 82.108 SAYIŞTAY 48.412 62.922 76.204 85.573 94.474 120.951 142.162 140.584 147.414 ADALET BAKANLIĞI 1.948.265 2.687.651 2.852.435 3.460.036 3.923.871 5.079.250 5.277.312 5.698.593 6.458.088
HAKİMLER VE SAVCILAR YÜKSEK KURULU 17.027 35.512 37.690 40.171
MALİYE BAKANLIĞI (Adli Yardım) 14.094 15.049 20.644 24.653 26.469 30.295 33.421 35.000 38.000
MALİYE BAKANLIĞI (CMK) 121.431 4.525 10.322 12.326 13.235 15.148 16.711 18.000 20.000
AHİM TAZMİNAT ÖDEMELERİ 13.847 26.222 10.392 11.663 33.099 37.137 40.000 40.000 40.000
GENEL BÜTÇELİ KURUMLARIN ADALET
HARCAMALARI 2.211.082 2.876.966 3.058.454 3.696.812 4.205.428 5.457.749 5.743.708 6.184.275 6.974.879
TÜRKİYE ADALET AKADEMİSİ BAŞKANLIĞI (hemen
tümü Adalet Bakanlığı'ndan transfer edilmektedir) 2.525
5.564 8.016
7.958 11.176
10.944
11.767 12.564 13.430
CEZA VE İNFAZ KURUMLARI İLE TUTUKEVLERİ İŞYURTLARI KURUMU (en az yarısı Adalet Bakanlığı'ndan transfer edilmektedir)
648.062 800.465 443.080 816.955 833.086
955.716
772.457 844.669 916.495
ÖZEL BÜTÇELİ KURUMLARIN ADALET
HARCAMALARI 650.587 806.029 451.096 824.913 844.262 966.660 784.224 857.233 929.925
MERKEZİ YÖNETİM ADALET HARCAMALARI TOPLAMI (Türkiye Adalet Aakademisvenin tümü ve
Ceza ve İnfaz Kurumları ile Tutukevleri İşyurtları Kurumu'nun % 50'si hariç)
2.535.113 3.277.199 3.279.994 4.105.290 4.621.971 5.935.607 6.129.937 6.606.610 7.433.127
GSYH 758.391.000 843.178.000 950.534.000 952.559.000 1.098.799.000 1.294.893.000 1.426.000.000 1.572.000.000 1.733.000.000
TOPLAM ADALET HARCAMALARI /GSYH
0,33 0,39 0,35 0,43 0,42 0,46 0,43 0,42 0,43
ADALET HARCAMALARINI İZLEMEKTE KULLANILAN VERİ KAYNAKLARI
ANAYASA MAHKEMESİ, YARGITAY, DANIŞTAY, SAYIŞTAY, ADALET BAKANLIĞI, HAKİMLER VE SAVCILAR
YÜKSEK KURULU :
2006-‐2011 gerçekleşmiş harcamaları:
İdarelerin gerçekleşmiş harcamalarına yıllık olarak
hOp://stk.bilgi.edu.tr/stkButce.asp
adresinden
ulaşılabilmektedir. Verilerin orijinal kaynağı Maliye Bakanlığı Muhasebat Genel Müdürlüğü’dür.
2012-‐2014 arası kanunlaşan ve öngörülen harcamalar: İdarelerin kanunlaşan ve iki yıllık öngörülen
harcamalarına www.bumko.gov.tr , bütçe gerekçeleri ve bütçe kanunu ve eklerinden ulaşılabilmektedir.
ADLİ YARDIM VE CMUK :
2006-‐2012 için hOp://www.barobirlik.org.tr/Detay.aspx?ID=5429&Tip=Menu
2013-‐2014 arası tahmindir.
AHİM’E YAPILAN ÖDEMELER :
18/04/2012 tarihli Mllitvekili Gürkut Acar’ın yazılı soru önergesine Adalet Bakanıl Sadullah Ergin’in yazılı
cevabı,
TÜRKİYE ADALET AKADEMİSİ BAŞKANLIĞI ve CEZA VE İNFAZ KURUMLARI İLE TUTUKEVLERİ
İŞYURTLARI KURUMU :
2006-‐2011 gerçekleşmiş harcamaları:
İdarelerin gerçekleşmiş harcamalarına yıllık olarak
hOp://stk.bilgi.edu.tr/stkButce.asp
adresinden
ulaşılabilmektedir. Verilerin orijinal kaynağı Maliye Bakanlığı Muhasebat Genel Müdürlüğü’dür.
2012-‐2014 arası kanunlaşan ve öngörülen harcamalar: İdarelerin kanunlaşan ve iki yıllık öngörülen
harcamalarına www.bumko.gov.tr , bütçe gerekçeleri ve bütçe kanunu ve eklerinden ulaşılabilmektedir.
İki kurumun ödenekleri ile Adalet Bakanlğının ödenekleri arasındaki transferler için bkz. Ödenek
cetvelleri,
Türkiye’nin Adalet Harcamalarının GSYH’ya Oranı (Yıllar
İçinde)
Tutuklu/Hükümlü Oranları
2010 yılı ijbariyle çeşitli jplerdeki ceza infaz kurumlarını gösterir
tablo (Kaynak: Adalet Bakanlığı 2010 Faaliyet Raporu Syf 74)
74
Sistem Merkezlerini kullanması
sağlanmıştır.
kullanması sağlanmıştır.
Yüksek Seçim Kurulu (YSK) (SEÇSİS) YSK ile 11.04.2006 tarihinde protokol imzalanmıştır. SEÇSİS’in UYAP bilişim ağını kullanması sağlanmıştır.
SEÇSİS’in UYAP bilişim ağını kullanması sağlanarak seçmen kütüklerinin UYAP üzerinden güncellenmesi ve seçim sonuçlarının UYAP üzerinden kısa sürede alınması sağlanmıştır.
1.7. Ceza İnfaz Sistemine Yönelik Faaliyetler
2010 yılı itibariyle çeşitli tiplerdeki ceza infaz kurumlarını gösterir tablo aşağıda
bulunmaktadır.
CEZA İNFAZ KURUMLARI BİNA DAĞILIM TABLOSU
S.NO
TİPİ
ADET
KAPASİTE
1
A
10
490
2
A1
9
284
3
A2
13
564
4
A3
30
2.275
5
B
16
1.068
6
C
7
1.902
7
D
2
1.732
8
E
45
33.613
9
F
14
4.976
10
H
5
2.882
11
K1
77
3.359
12
K2
22
1.371
13
L
19
22.699
14
M
24
10.173
15
T
9
8.958
16
KAPALI
24
7.282
18
ÇOCUK EĞİTİMEVİ
3
360
19
ÇOCUK VE GENÇLİK
3
1.334
20
KADIN AÇIK
1
350
21
KADIN KAPALI
4
1.596
22
AÇIK
34
8.563
TOPLAM
371
114.831
Adalet Bakanlığı Ceza ve Tevkif Evleri Genel Müdürlüğü
internet sayfasından istajsjkler:
Tutuklu - Hükmen Tutuklu - Hükümlü Dağılımı
( Ekim 2011 İtibarıyla )
Tutuklu
Hükmen Tutuklu
Hükümlü
Genel Toplam
Ç
Y
T
Ç
Y
T
Ç
Y
T
Ç
Y
T
Kadın
46
1474 1520
6
648
654
7
2335
2342
59
4457 4516
Erkek 1577 31333 32910 185 17113 17298
200
72118
72318 1962 120564 122526
Toplam 1623 32807 34430 191 17761 17952
207
74453
74660 2021 125021 127042
Ç=Çoçuk, Y=Yejşkin, T=Toplam
Bu tablo, 19/04/2008 tarihli ve 26852 sayılı Resmi Gazete'de yayımlanan 2008/13472 sayılı Bakanlar Kurulu Kararı
ile yürürlüğe giren Resmi İstajsjk Programı kapsamında olmayıp, hizmete özel olarak hazırlanmış9r
Toplam Hükümlü &
Tutuklu Sayısı
Toplam Cezaevi
Yatak Sayısı
Kapasite Eksikliği
127,042
114,831
12,211
Adalet Bakanlığı 2010 Faaliyet Raporu s. 35
Ceza ve Tevkif evleri Genel
Müdürlüğü 2010 harcaması
7,040,156 TL
Ceza İnfaz Kurumları, Tutukevleri Ve
Eğijm Merkezleri 2010 harcaması
1,501,501,803 TL
Toplam Hükümlü&Tutuklu Sayısı
127,042
Tutuklu ve hükümlü başına bütçe
Yıllık 11,819 TL
Aylık 985 TL
Kaynak: Adalet Bakanlığı Ödenek Cetveli, 2012, www.bumko.gov.tr
2012 Ödenek Cetveli, bin TL
Ceza ve Tevkifevleri Genel Müdürlüğü ve Ceza ve
İnfaz Kurumları, Tutukevleri ve Eğitim Merkezleri
2.030.956
Personel Giderleri
7.372
Sosyal Güvenlik Kurumlarına Devlet Primleri
1.198
Mal ve Hizmet Alımı
840
Cari Transferler
1.070
Ceza ve Tevkifevleri Genel Müdürlüğü
10.480
Ceza ve İnfaz kurumları ile Tutukevleri
İşyurtları Kurumu'na transfer
603.000
Cezaevi İdaresi hizmetleri
1.417.476
Ceza İnfaz Kurumları, Tutukevleri ve Eğitim
Merkezleri
2.020.476
Ceza ve Tevkifevleri Genel Müdürlüğü (Merkez)
10.480
Ceza İnfaz Kurumları, Tutukevleri ve Eğitim
2011
2010
2009
2008
Hukuk Davaları İçin
Ayrılan Adli Yardım
Ödeneği
27.265.867,94 23.822.443,15 22.187.306,79 18.579.272,35
Ceza Davaları İçin Ayrılan
CMK Ödeneği
15.147.704,40
13.234.690,63
12.326.281,56
10.321.817,95
TOPLAM
42.413.572,34 37.057.133,78 34.513.588,35 28.901.090,30
Yıllar İçinde Maliye Bakanlığı’ndan Barolara Gönderilen
Toplam Adli Yardım Ödeneği
Uluslararası Karşılaş9rmalar
•
Avrupa İnsan Hakları Mahkemesi
–
2010 İhlal İstajsjkleri
hOp://www.echr.coe.int/NR/rdonlyres/8ED60DCD-‐FA01-‐41C4-‐
A660-‐9D31F23DD08F/0/TABLEAU_VIOLATIONS_2010_EN.pdf
–
2011 İhlal İstajsjkleri
hOp://www.echr.coe.int/NR/rdonlyres/596C7B5C-‐3FFB-‐4874-‐85D8-‐
F12E8F67C136/0/TABLEAU_VIOLATIONS_EN_2011.pdf
•
CEPEJ-‐ Avrupa Konseyi Etkin Yargı Komisyonu
–
Avrupa Yargı Sistemleri Raporu 2010
hOps://wcd.coe.int/ViewDoc.jsp?
Ref=CEPEJ(2010)Evaluajon&Language=lanEnglish&Ver=original&BackColorIn
ternet=DBDCF2&BackColorIntranet=FDC864&BackColorLogged=FDC864
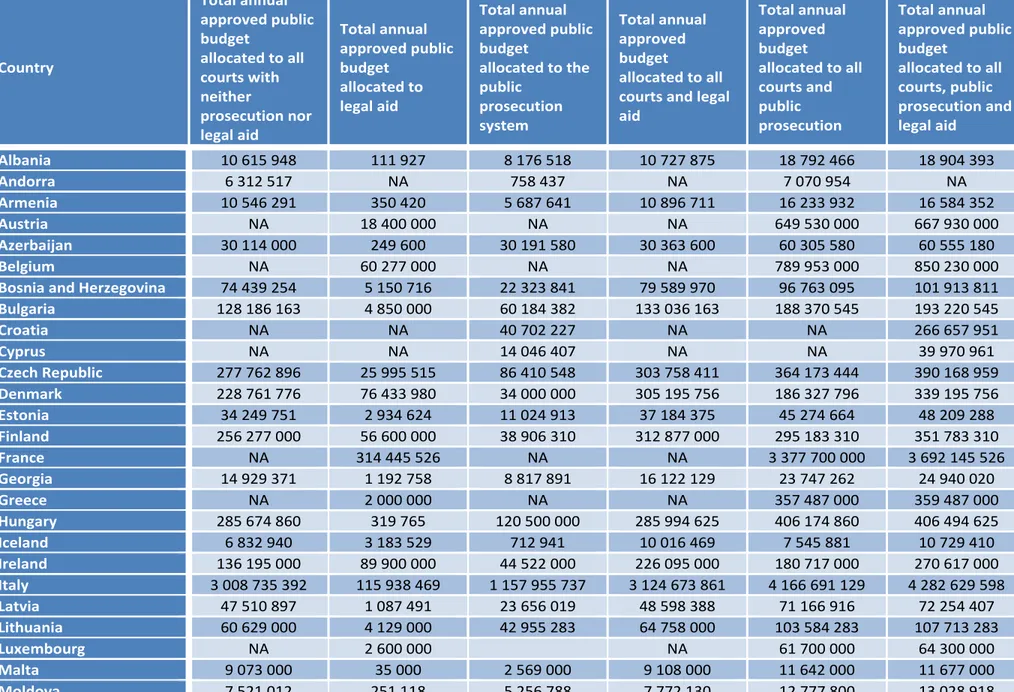
2008 yılında mahkemelere, savcılıklara ve adli yardıma ayrılan bütçe (Euro)
Kaynak: CEPEJ 2010 Raporı
As a result, any state or entity will be able to compare itself to other states or entities deemed as similar. It
will then, in the same way, be able to refer to the results on activity.
In order to contribute to a better understanding of these reasoned comparisons, all the reported and studied
figures have been made available. Ratios have been highlighted, in order to allow comparisons between
comparable categories, by connecting the budgetary figures to the number of inhabitant and the GDP per
capita, in the form of figures.
Following the main table, figures are presented with the ratio of the budget per inhabitant and the ratio as a
percentage of the GDP per capita, to compare realistically comparable categories.
For the first time, the CEPEJ report aims at highlighting a few statistical series, showing the evolution of
indicators over the years, by referring to the data of previous evaluation cycles (see Figure 3).
Note for the reader: The budgets indicated correspond in principle (unless specifically mentioned
otherwise) to the amounts as voted and not as effectively spent.
All the amounts are given in Euros. For the countries which are not part of the Euro zone, the CEPEJ was
very attentive to variations in exchange rates between the national currency and the Euro (unless stated
otherwise, the value is taken on 1 January 2008). The rapid development of some national economies (for
instance revenues coming from oil exploitation in Azerbaijan), or the inflation, may also explain a few
significant budgetary evolutions. This fact must fully be taken into account while interpreting variations in
states or entities outside the Euro zone.
For a more in-depth analysis of the specificities in the budgets of the various member states or entities, the
reader is invited to examine the detailed answers given by each state or entity which appear on the CEPEJ's
website:
www.coe.int/cepej
.
Table 2.1 Public budget allocated to courts, legal aid and public prosecution in 2008, in € (Q6, Q13,
Q16)
Country Total annual approved public budget allocated to all courts with neither prosecution nor legal aid Total annual approved public budget allocated to legal aid Total annual approved public budget allocated to the public prosecution system Total annual approved budget allocated to all courts and legal aid Total annual approved budget allocated to all courts and public prosecution Total annual approved public budget allocated to all courts, public prosecution and legal aid Albania 10 615 948 111 927 8 176 518 10 727 875 18 792 466 18 904 393 Andorra 6 312 517 NA 758 437 NA 7 070 954 NA Armenia 10 546 291 350 420 5 687 641 10 896 711 16 233 932 16 584 352 Austria NA 18 400 000 NA NA 649 530 000 667 930 000 Azerbaijan 30 114 000 249 600 30 191 580 30 363 600 60 305 580 60 555 180 Belgium NA 60 277 000 NA NA 789 953 000 850 230 000Bosnia and Herzegovina 74 439 254 5 150 716 22 323 841 79 589 970 96 763 095 101 913 811
Bulgaria 128 186 163 4 850 000 60 184 382 133 036 163 188 370 545 193 220 545 Croatia NA NA 40 702 227 NA NA 266 657 951 Cyprus NA NA 14 046 407 NA NA 39 970 961 Czech Republic 277 762 896 25 995 515 86 410 548 303 758 411 364 173 444 390 168 959 Denmark 228 761 776 76 433 980 34 000 000 305 195 756 186 327 796 339 195 756 Estonia 34 249 751 2 934 624 11 024 913 37 184 375 45 274 664 48 209 288 Finland 256 277 000 56 600 000 38 906 310 312 877 000 295 183 310 351 783 310 France NA 314 445 526 NA NA 3 377 700 000 3 692 145 526 Georgia 14 929 371 1 192 758 8 817 891 16 122 129 23 747 262 24 940 020 Greece NA 2 000 000 NA NA 357 487 000 359 487 000 Hungary 285 674 860 319 765 120 500 000 285 994 625 406 174 860 406 494 625 Iceland 6 832 940 3 183 529 712 941 10 016 469 7 545 881 10 729 410 Ireland 136 195 000 89 900 000 44 522 000 226 095 000 180 717 000 270 617 000 Italy 3 008 735 392 115 938 469 1 157 955 737 3 124 673 861 4 166 691 129 4 282 629 598 Latvia 47 510 897 1 087 491 23 656 019 48 598 388 71 166 916 72 254 407 Lithuania 60 629 000 4 129 000 42 955 283 64 758 000 103 584 283 107 713 283 Luxembourg NA 2 600 000 NA 61 700 000 64 300 000 Malta 9 073 000 35 000 2 569 000 9 108 000 11 642 000 11 677 000 Moldova 7 521 012 251 118 5 256 788 7 772 130 12 777 800 13 028 918
16
Total annual
Total annual
Total annual
Total annual
approved public
Total annual
Total annual
approved public
approved
approved public
budget
approved
approved public
budget
budget
budget
allocated to all
budget
Country
budget
allocated to the
allocated to all
allocated to all
courts with
allocated to all
allocated to
public
courts and
courts, public
neither
courts and legal
legal aid
prosecution
public
prosecution and
prosecution nor
aid
system
prosecution
legal aid
legal aid
Monaco
4 786 100
220 000
1 330 900
5 006 100
6 117 000
6 337 000
Montenegro
19 625 944
153 427
4 998 279
19 779 371
24 624 223
24 777 650
Netherlands
889 208 000
419 248 000
570 903 000
1 308 456 000
1 460 111 000
1 879 359 000
Norway
161 163 043
153 230 000
13 364 000
314 393 043
174 527 043
327 757 043
Poland
1 204 202 000
22 403 000
333 489 000
1 226 605 000
1 537 691 000
1 560 094 000
Portugal
513 513 518
36 432 072
NA
549 945 590
NA
NA
Romania
380 932 306
4 376 694
160 389 216
385 309 000
541 321 522
545 698 216
Russian Federation
2 406 286 197
53 543 496
846 018 639
2 459 829 693
3 252 304 836
3 305 848 332
San Marino
4 573 250
Serbia
NA
NA
26 845 371
195 863 391
NA
222 708 762
Slovakia
144 682 786
901 547
59 017 760
145 584 333
203 700 546
204 602 093
Slovenia
159 461 409
2 821 428
17 811 140
162 282 837
177 272 549
180 093 977
Spain
NA
219 707 018
NA
NA
3 686 381 622
3 906 088 640
Sweden
399 825 654
142 633 089
128 301 090
542 458 743
528 126 744
670 759 833
Switzerland
800 725 712
61 524 211
220 168 990
862 249 923
1 020 894 702
1 082 418 913
FYROMacedonia
25 287 606
1 772 655
4 899 022
27 060 261
30 186 628
31 959 283
Turkey
736 932 152
49 570 981
NA
NA
736 932 152
786 503 133
Ukraine
144 954 555
178 264
103 562 627
145 132 819
248 517 182
248 695 446
UK England and Wales
1 437 326 465
1 878 704 340
771 190 551
3 316 030 805
2 208 517 016
4 087 221 356
UK Northern Ireland
74 600 000
87 000 000
161 600 000
NA
NA
UK Scotland
151 940 889
150 000 000
129 300 000
301 940 889
281 240 889
431 240 889
Average
376 168 280
96 925 159
139 214 812
476 286 007
673 594 624
747 988 485
Median
140 438 893
5 000 358
34 000 000
161 941 419
188 370 545
266 657 951
Minimum
4 573 250
35 000
712 941
5 006 100
6 117 000
6 337 000
Maximum
3 008 735 392
1 878 704 340
1 157 955 737
3 316 030 805
4 166 691 129
4 282 629 598
Comments
Belgium: the budget for constructing new courts or maintaining existing buildings is excluded from the budget of the
Federal Justice Public Service. Real property of the Belgium State is managed by the Régie des Bâtiments which does
not hold separate a specific part for justice.
Bulgaria: public budgets allocated to legal aid and to investment in (new) court buildings are part of the budget of the
Ministry of Justice.
Croatia: the budgets indicated include loans from the World Bank.
Denmark: the figure on the “prosecution budget” includes the central part of the public prosecution system. Therefore,
the sums calculated should be interpreted with caution as the budget allocated to 12 police districts are not available,
being part of the local prosecution system.
France: the total annual budget allocated to all courts amounts to € 3377,7 millions which break down into 3088,7
millions (2822,7 millions for judicial justice + 266 millions for administrative justice) + cost estimation for transportation of
defendants under escort (117 millions) + cost evaluation of prosecuting officers (31 millions) + cost estimation of
guarding courtrooms (81 millions) + the amount of the rental value of court buildings made available for free to the state
by local authorities as part of the shift in costs following decentralisation (60 millions).
Hungary: the court budget includes the budget of the Council of Justice.
Moldova: does not include the budget allocated to military courts.
Netherlands: the given budgets do not include those of the Supreme Court. These budgets were calculated in a different
manner than in the 2008 Edition of the report.
Norway: the specialised courts’ budgets are not included. The annual public budget devoted to court fees was excluded
from the courts’ budget.
Portugal: the given budget excludes major investments such as the construction of new buildings.
Russian Federation: the budget of legal aid indicated covers only the participation of lawyers in criminal proceedings.
The budget allocated to public prosecution does not include the budget of Investigation Committee under the Prosecution
Service (this specialized body was introduced within the prosecution system on 7 September 2007, primarily for
investigating certain types of crimes).
Spain: the given budgets correspond with the budgetary plan within the political programme for justice. There are other
budgetary lines regarding the operation of justice, such as those on social security for personnel of the justice
administration, included within other policies.
Total budget of the General Council of the Judiciary: € 72.863.890. Budget of the Ministry of Justice and other bodies: €
1.491.165.640. Budget of the Autonomous Communities: € 2.342.059.110.
Sweden: a new accounting pattern has emerged since the 2008 Edition of the report, which makes it difficult to compare
budgetary data.
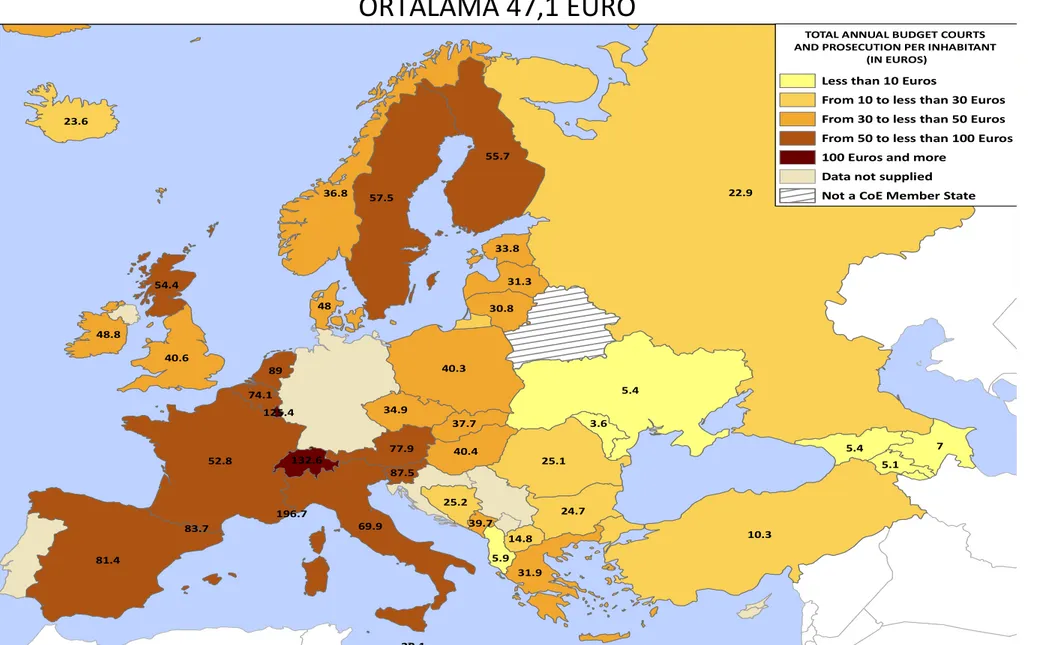
2008 yılında ülke sakini başına bütün mahkemelere, savcılığa ve adli
yardıma tahsis edilen yıllık bütçe, Avro cinsinden
Kaynak: CEPEJ 2010 Raporı
ORTALAMA 47,1 EURO
Figure 2.18 Total annual budget allocated to all courts and public prosecution (without legal aid) per
inhabitant in 2008, in € (Q6, Q16)
22.9 5.4 10.3 52.8 81.4 57.5 55.7 36.8 40.3 7 69.9 25.1 40.6 24.7 31.9 23.6 5.4 40.4 77.9 34.9 48.8 54.4 31.3 30.8 89 25.2 48 37.7 3.6 5.1 33.8 5.9 132.6 74.1 14.8 87.5 39.7 125.4 83.7 28.1 196.7TOTAL ANNUAL BUDGET COURTS AND PROSECUTION PER INHABITANT
(IN EUROS)
Less than 10 Euros
From 10 to less than 30 Euros From 30 to less than 50 Euros From 50 to less than 100 Euros 100 Euros and more
Data not supplied Not a CoE Member State
Three zones can be identified from the geographical distribution of sums allocated to court and prosecution
services’ budgets: given their transitional economic systems, Eastern European states report the lowest
budgets; Central European states, much of which have recently joined the European Union, stand at an
intermediate level; Western European states spend the largest budgets per capita in accordance with the
state of their economy.
In Europe, the average budget allocated to courts and prosecution services is 47,1 € per capita. The median
level is 37,3 €.
Of the 40 states or entities, Monaco, Switzerland and Luxembourg spend the largest amounts (more than
100 € per capita) for courts and public prosecution services. It must be borne in mind that sums per
inhabitant in small states should always be put into perspective regarding the small number of inhabitants.
Azerbaijan, Albania, Georgia, Ukraine, Armenia and Moldova spend less than 10 € per inhabitant on this
system. A ratio including the GDP per capita must be analysed in order to compare these sums to the state’s
prosperity. One can observe that efforts of public authorities are higher than what the raw data suggest in
these countries. According to the previous analysis, the relative commitments of public authorities (supported
by European and international funds) in the judicial system remain high in Montenegro, Bosnia and
Herzegovina, Bulgaria, Poland.
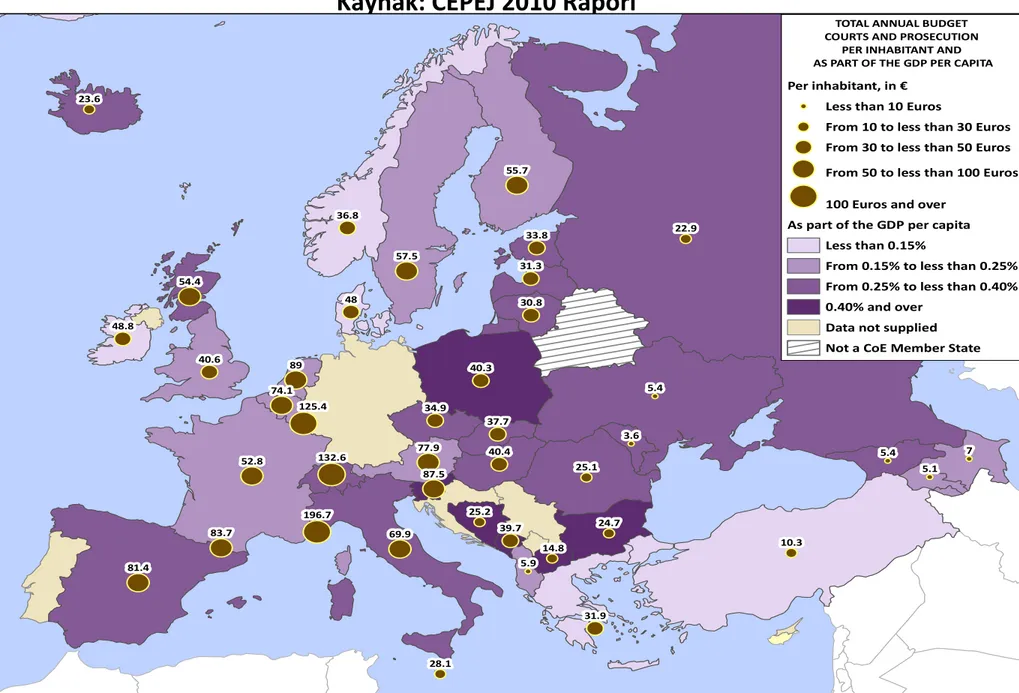
2008 yılında tüm mahkemelere, savcılık hizmetlerine ve adli yardıma kişi başına
GSYH bağlamında tahsis edilen kamu bütçesi (%)
Kaynak: CEPEJ 2010 Raporı
Figure 2.19 Annual public budget allocated to all courts and prosecution service (without legal aid)
as part (in %) of the GDP per capita, in 2008 (Q6, Q16)
7 89 48 5.4 3.6 5.4 5.1 5.9 40.6 54.4 10.3 57.5 87.5 37.7 22.9 25.1 40.3 36.8 39.7 28.1 14.8 31.3 30.8 69.9 23.6 48.8 40.4 31.9 52.8 55.7 33.8 81.4 34.9 25.2 24.7 74.1 77.9 83.7 196.7 125.4 132.6
TOTAL ANNUAL BUDGET COURTS AND PROSECUTION
PER INHABITANT AND AS PART OF THE GDP PER CAPITA Per inhabitant, in €
Less than 10 Euros
From 10 to less than 30 Euros From 30 to less than 50 Euros From 50 to less than 100 Euros 100 Euros and over
As part of the GDP per capita Less than 0.15%
From 0.15% to less than 0.25% From 0.25% to less than 0.40% 0.40% and over
Data not supplied Not a CoE Member State
2008’de mahkemelere ayrılan bütçenin bileşenleri (Euro)
Kaynak: CEPEJ 2010 Raporu
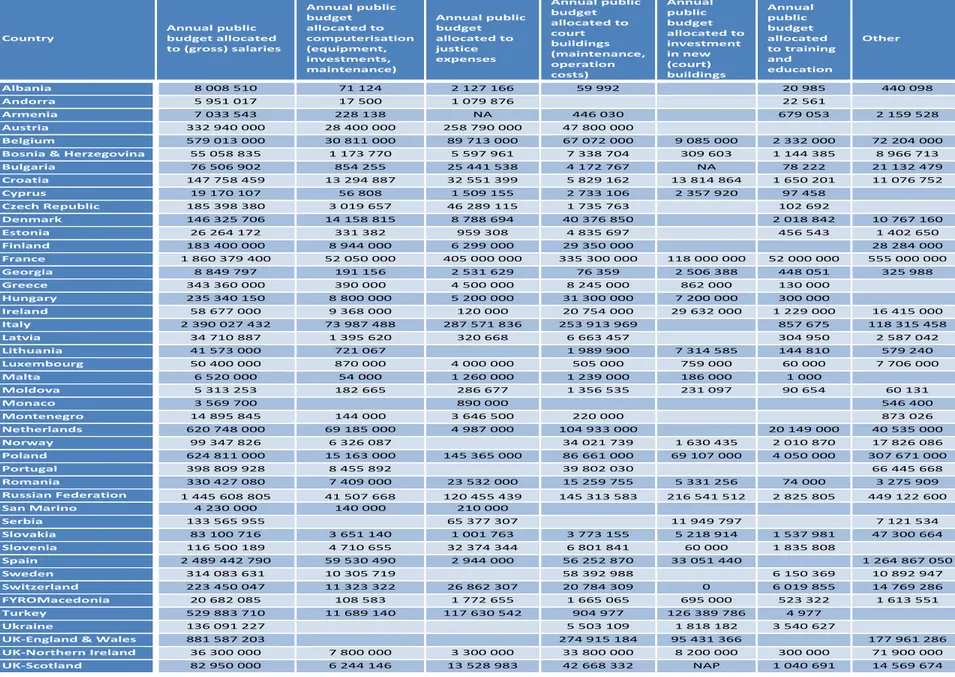
Table 2.6 Break-down by component of court budgets in 2008, in € (Q8)
Country Annual public budget allocated to (gross) salaries Annual public budget allocated to computerisation (equipment, investments, maintenance) Annual public budget allocated to justice expenses Annual public budget allocated to court buildings (maintenance, operation costs) Annual public budget allocated to investment in new (court) buildings Annual public budget allocated to training and education Other Albania 8 008 510 71 124 2 127 166 59 992 20 985 440 098 Andorra 5 951 017 17 500 1 079 876 22 561 Armenia 7 033 543 228 138 NA 446 030 679 053 2 159 528 Austria 332 940 000 28 400 000 258 790 000 47 800 000 Belgium 579 013 000 30 811 000 89 713 000 67 072 000 9 085 000 2 332 000 72 204 000 Bosnia & Herzegovina 55 058 835 1 173 770 5 597 961 7 338 704 309 603 1 144 385 8 966 713
Bulgaria 76 506 902 854 255 25 441 538 4 172 767 NA 78 222 21 132 479 Croatia 147 758 459 13 294 887 32 551 399 5 829 162 13 814 864 1 650 201 11 076 752 Cyprus 19 170 107 56 808 1 509 155 2 733 106 2 357 920 97 458 Czech Republic 185 398 380 3 019 657 46 289 115 1 735 763 102 692 Denmark 146 325 706 14 158 815 8 788 694 40 376 850 2 018 842 10 767 160 Estonia 26 264 172 331 382 959 308 4 835 697 456 543 1 402 650 Finland 183 400 000 8 944 000 6 299 000 29 350 000 28 284 000 France 1 860 379 400 52 050 000 405 000 000 335 300 000 118 000 000 52 000 000 555 000 000 Georgia 8 849 797 191 156 2 531 629 76 359 2 506 388 448 051 325 988 Greece 343 360 000 390 000 4 500 000 8 245 000 862 000 130 000 Hungary 235 340 150 8 800 000 5 200 000 31 300 000 7 200 000 300 000 Ireland 58 677 000 9 368 000 120 000 20 754 000 29 632 000 1 229 000 16 415 000 Italy 2 390 027 432 73 987 488 287 571 836 253 913 969 857 675 118 315 458 Latvia 34 710 887 1 395 620 320 668 6 663 457 304 950 2 587 042 Lithuania 41 573 000 721 067 1 989 900 7 314 585 144 810 579 240 Luxembourg 50 400 000 870 000 4 000 000 505 000 759 000 60 000 7 706 000 Malta 6 520 000 54 000 1 260 000 1 239 000 186 000 1 000 Moldova 5 313 253 182 665 286 677 1 356 535 231 097 90 654 60 131 Monaco 3 569 700 890 000 546 400 Montenegro 14 895 845 144 000 3 646 500 220 000 873 026 Netherlands 620 748 000 69 185 000 4 987 000 104 933 000 20 149 000 40 535 000 Norway 99 347 826 6 326 087 34 021 739 1 630 435 2 010 870 17 826 086 Poland 624 811 000 15 163 000 145 365 000 86 661 000 69 107 000 4 050 000 307 671 000 Portugal 398 809 928 8 455 892 39 802 030 66 445 668 Romania 330 427 080 7 409 000 23 532 000 15 259 755 5 331 256 74 000 3 275 909 Russian Federation 1 445 608 805 41 507 668 120 455 439 145 313 583 216 541 512 2 825 805 449 122 600 San Marino 4 230 000 140 000 210 000 Serbia 133 565 955 65 377 307 11 949 797 7 121 534 Slovakia 83 100 716 3 651 140 1 001 763 3 773 155 5 218 914 1 537 981 47 300 664 Slovenia 116 500 189 4 710 655 32 374 344 6 801 841 60 000 1 835 808 Spain 2 489 442 790 59 530 490 2 944 000 56 252 870 33 051 440 1 264 867 050 Sweden 314 083 631 10 305 719 58 392 988 6 150 369 10 892 947 Switzerland 223 450 047 11 323 322 26 862 307 20 784 309 0 6 019 855 14 769 286 FYROMacedonia 20 682 085 108 583 1 772 655 1 665 065 695 000 523 322 1 613 551 Turkey 529 883 710 11 689 140 117 630 542 904 977 126 389 786 4 977 Ukraine 136 091 227 5 503 109 1 818 182 3 540 627
UK England & Wales 881 587 203 274 915 184 95 431 366 177 961 286
UK Northern Ireland 36 300 000 7 800 000 3 300 000 33 800 000 8 200 000 300 000 71 900 000
UK Scotland 82 950 000 6 244 146 13 528 983 42 668 332 NAP 1 040 691 14 569 674
Comments
Belgium: the budget for constructing new courts or maintaining existing buildings is excluded from the budget of the
Federal Justice Public Service. Real property of the Belgium State is managed by the Régie des Bâtiments which does not hold separate a specific part for justice.
France: the sum reported for the budget devoted to salaries includes € 475.206.175 for contributions allocated to a
special “pensions” account aimed to fund retirements. The given salaries are those of all court staff, including members
2008 verilerinden çıkarılabilecek bazı
yorumlar…
•
Mahkeme bütçelerinin ortalama en büyük gider kalemi
(%70) hakimlerin ve mahkeme çalışanlarının maaşıdır.
Türkiye’de bu oran yaklaşık % 74’tür.
•
Avrupa ülkelerinde bütçenin bir diğer önemli yüzdesi
adliyelerin işletme ve yeni adliye yapım masraflarına
harcanmaktadır. (% 14) Türkiye’de ise bu oran, tüm
ülkeler arasında en düşük seviyededir. (% 0,1)
•
Mahkemelere ayrılan bütçenin ortalama yüzde 3’ü
bilişim teknolojilerine harcanmaktadır. Türkiye’de bu
oran yüzde 1 civarındadır.
CEPEJ 2010 Raporu (2008 verileri)
Kaynak: CEPEJ 2010 Raporı
(sadece profesyonel hakimlik olan ülkeler arası kıyaslama)
Toplam hakim sayısı
her 100,000 kişi başına düşen hakim sayısı
Arnavutluk
391
12,3
Andorra
23
27,2
Ermenistan
216
6,8
Avusturya
1,658
19,9
Azerbaycan
494
5,7
Kıbrıs
100
12,5
Hırvajstan
1,883
42,5
Gürcistan
282
6,4
Yunanistan
3,739
33,3
İrlanda
145
3,3
İzlanda
47
14,7
Malta
36
8,7
Moldovya
460
12,9
Karadağ
246
39,7
Hollanda
2,176
13,3
Romanya
4,142
19,2
Rusya
34,390
24,2
Sırbistan
2,506
34,1
Türkiye
7,198
10,1
Ukrayna
7,205
15,5
Ortalama
20
Hakim maaşları (2008 verileri) Kaynak: CEPEJ 2010 Raporı
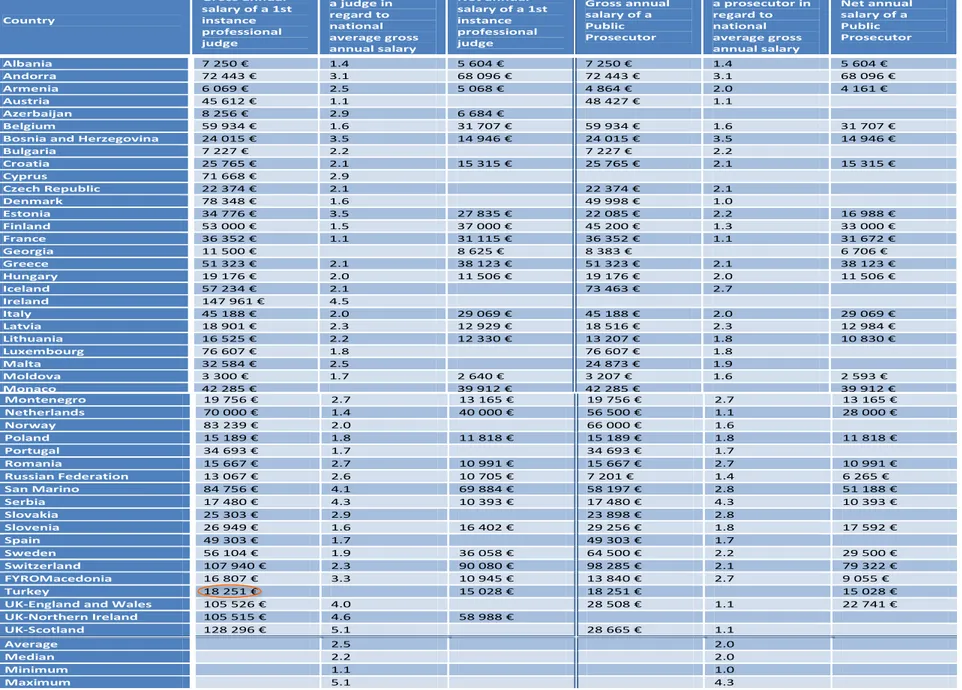
205 Recommendation R(94)12, on the independence, efficiency and the role of judges, provides that the judges’ remuneration should be guaranteed by law and “commensurate with the dignity of their profession and burden of responsibilities”. The CCJE’s Opinion N°1 (2001) par. 61 confirms that an adequate level of remuneration is necessary to guarantee that judges can work freely and shield “from pressures aimed at influencing their decisions and more generally their behaviour”.
Two different indicators are further analysed. The first concerns the judge’s salary at the beginning of her or his career. Differences are evident between states recruiting (young) judges graduating from a school for judicial studies and states recruiting judges among legal professionals who benefit from long working experiences often as lawyers. The second indicator is related to the judge’s salary at the Supreme Court or at the Highest Appellate Court, at the end of the career. At this level, differences between states may be more significant as they aren’t attributed to the kind of recruitment or a previous career. A comparison between the salaries at the beginning and at the end of the career allows to measure a judge’s possible progression within a state and to evaluate the consideration attributed to her/his social position. The ratio of the judge’s salary to the national average salary deepens the analyses and removes any biases inflicted by the exchange rate or GDP.
In any case, data which are presented in the next table must be interpreted with caution. The allocated salaries depend on several factors which are connected to the exchange rate for non-euro states but also to the living standards, modalities of recruitment, seniority etc. It is important to take into account the special features for each state presented in the comments.
Similar reserves to those made to the salary of judges should be made for prosecutors. The salaries of prosecutors are composed of a basic salary that can be supplemented with bonuses and/or other benefits (see the following title 11.4). Paragraph 5 d. of Recommendation R(2000)19 provides that: “reasonable
conditions of service should be governed by law, such as remuneration, tenure and pension commensurate with the crucial role of prosecutors as well as an appropriate age of retirement.”
11.3.1 Salaries at the beginning of the career
Table 11.11 Gross and net annual salaries of judges and prosecutors at the beginning of the career, in 2008 (Q118) Country Gross annual salary of a 1st instance professional judge Gross salary of a judge in regard to national average gross annual salary Net annual salary of a 1st instance professional judge Gross annual salary of a Public Prosecutor Gross salary of a prosecutor in regard to national average gross annual salary Net annual salary of a Public Prosecutor Albania 7 250 € 1.4 5 604 € 7 250 € 1.4 5 604 € Andorra 72 443 € 3.1 68 096 € 72 443 € 3.1 68 096 € Armenia 6 069 € 2.5 5 068 € 4 864 € 2.0 4 161 € Austria 45 612 € 1.1 48 427 € 1.1 Azerbaijan 8 256 € 2.9 6 684 € Belgium 59 934 € 1.6 31 707 € 59 934 € 1.6 31 707 €
Bosnia and Herzegovina 24 015 € 3.5 14 946 € 24 015 € 3.5 14 946 €
Bulgaria 7 227 € 2.2 7 227 € 2.2 Croatia 25 765 € 2.1 15 315 € 25 765 € 2.1 15 315 € Cyprus 71 668 € 2.9 Czech Republic 22 374 € 2.1 22 374 € 2.1 Denmark 78 348 € 1.6 49 998 € 1.0 Estonia 34 776 € 3.5 27 835 € 22 085 € 2.2 16 988 € Finland 53 000 € 1.5 37 000 € 45 200 € 1.3 33 000 € France 36 352 € 1.1 31 115 € 36 352 € 1.1 31 672 € Georgia 11 500 € 8 625 € 8 383 € 6 706 € Greece 51 323 € 2.1 38 123 € 51 323 € 2.1 38 123 € Hungary 19 176 € 2.0 11 506 € 19 176 € 2.0 11 506 € Iceland 57 234 € 2.1 73 463 € 2.7 Ireland 147 961 € 4.5 Italy 45 188 € 2.0 29 069 € 45 188 € 2.0 29 069 € Latvia 18 901 € 2.3 12 929 € 18 516 € 2.3 12 984 € Lithuania 16 525 € 2.2 12 330 € 13 207 € 1.8 10 830 € Luxembourg 76 607 € 1.8 76 607 € 1.8 Malta 32 584 € 2.5 24 873 € 1.9 Moldova 3 300 € 1.7 2 640 € 3 207 € 1.6 2 593 € Monaco 42 285 € 39 912 € 42 285 € 39 912 € 206 Country Gross annual salary of a 1st instance professional judge Gross salary of a judge in regard to national average gross annual salary Net annual salary of a 1st instance professional judge Gross annual salary of a Public Prosecutor Gross salary of a prosecutor in regard to national average gross annual salary Net annual salary of a Public Prosecutor Montenegro 19 756 € 2.7 13 165 € 19 756 € 2.7 13 165 € Netherlands 70 000 € 1.4 40 000 € 56 500 € 1.1 28 000 € Norway 83 239 € 2.0 66 000 € 1.6 Poland 15 189 € 1.8 11 818 € 15 189 € 1.8 11 818 € Portugal 34 693 € 1.7 34 693 € 1.7 Romania 15 667 € 2.7 10 991 € 15 667 € 2.7 10 991 € Russian Federation 13 067 € 2.6 10 705 € 7 201 € 1.4 6 265 € San Marino 84 756 € 4.1 69 884 € 58 197 € 2.8 51 188 € Serbia 17 480 € 4.3 10 393 € 17 480 € 4.3 10 393 € Slovakia 25 303 € 2.9 23 898 € 2.8 Slovenia 26 949 € 1.6 16 402 € 29 256 € 1.8 17 592 € Spain 49 303 € 1.7 49 303 € 1.7 Sweden 56 104 € 1.9 36 058 € 64 500 € 2.2 29 500 € Switzerland 107 940 € 2.3 90 080 € 98 285 € 2.1 79 322 € FYROMacedonia 16 807 € 3.3 10 945 € 13 840 € 2.7 9 055 € Turkey 18 251 € 15 028 € 18 251 € 15 028 €
UK-England and Wales 105 526 € 4.0 28 508 € 1.1 22 741 €
UK-Northern Ireland 105 515 € 4.6 58 988 € UK-Scotland 128 296 € 5.1 28 665 € 1.1 Average 2.5 2.0 Median 2.2 2.0 Minimum 1.1 1.0 Maximum 5.1 4.3
Concerning Georgia, Monaco and Turkey it was impossible to report the gross salaries of judges and prosecutors in regard to the national average gross salary because of a lack of data on the national gross salary.
Comments
Albania: the figures provided do not include any benefits as bonuses or benefits for special working conditions.
Belgium: the gross annual salary of a judge is based on the salary after three years of work experience. The net salary corresponds to a married judge with two children.
Bosnia and Herzegovina: for the salary of a judge or a prosecutor, 3 years of work experience were taken into account. Czech Republic: salaries are increased after the first 5 years in service, after the 6th year of service and then every other 3 years of service.
Denmark: regarding judges, the gross annual salary excludes additional benefits.
Estonia: the judge’s salary does not include additional remuneration for added years of service (the additional remuneration for the 5th year of employment is 5% of the official salary, 10% for the 10th year of employment and 15% for
the 15th year of employment). For calculating the net annual salary, the income taxes were deducted from the gross annual salary.
Ireland: the figure provided as the judge’s salary corresponds to the salary of a judge of the District court. A judge of the Circuit court earns 177.554€ and the President of the District court earns 183.984€.
Italy: net annual salaries depend on subjective percentages of taxation.
Norway: since 1st October 2008, the gross annual salary of the judges was increased. This salary is indicated above. Slovakia: according to the law, the average monthly salary of a judge is equal to the monthly salary of a member of the parliament. The salary of the judge at the beginning of the career is 90% of the average monthly salary of the judge. The base salary of a prosecutor is 85% of the average salary of a judge. The gross annual salaries were calculated on a 14 -months basis as judges and prosecutors have the right to two additional monthly salaries paid in May and November. Slovenia: the figure given for the first instance court is the lowest possible salary.
Spain: it is not possible to give a single net annual salary as it varies according to the individually applicable tax. Switzerland: the judge’s and prosecutor’s salaries correspond to the average salary paid in 22 cantons.
"the former Yugoslav Republic of Macedonia": in 2009, the Parliament adopted a legislation in which public prosecutors are paid an equal salary to judges on the same instance level.
UK-England and Wales: the figure given is for judicial salary group 7. In 2008/2009 judicial salaries ranged from 93.870€ (which includes London weighting) for Asylum Support Tribunal Adjudicators, the only post below group 7), to 245.915€ for salary group 1 (Lord Chief Justice). The judge’s net annual salary can not be given as it depends on individual tax and national insurance. The gross and average net salary provided for the prosecutor is for a national based prosecutor. For a London based prosecutor, the salaries are higher (the gross salary was 33.610€, the average net salary 23.728€).
UK-Northern Ireland: averages have been provided. A net annual salary can not be given as it depends on individual national insurance code, tax code and rate of contribution to the pension scheme.
ADLİ YARDIM
•
Adli yardım bütçesi, bir ülkenin hukuk sistemini
erişebilir hale gejrme çabasını gösterir.
(Avrupa
Konseyi Etkin Yargı Komisyonu)
•
“Adli yardımın amacı, bireylerin hak arama
özgürlüklerinin önündeki engelleri aşmak ve hak
arama özgürlüğünün kullanımında eşitliği
sağlamak üzere, avukatlık ücrejni ve yargılama
giderlerini karşılama olanağı bulunmayanların
avukatlık hizmetlerinden yararlandırılmasıdır.”
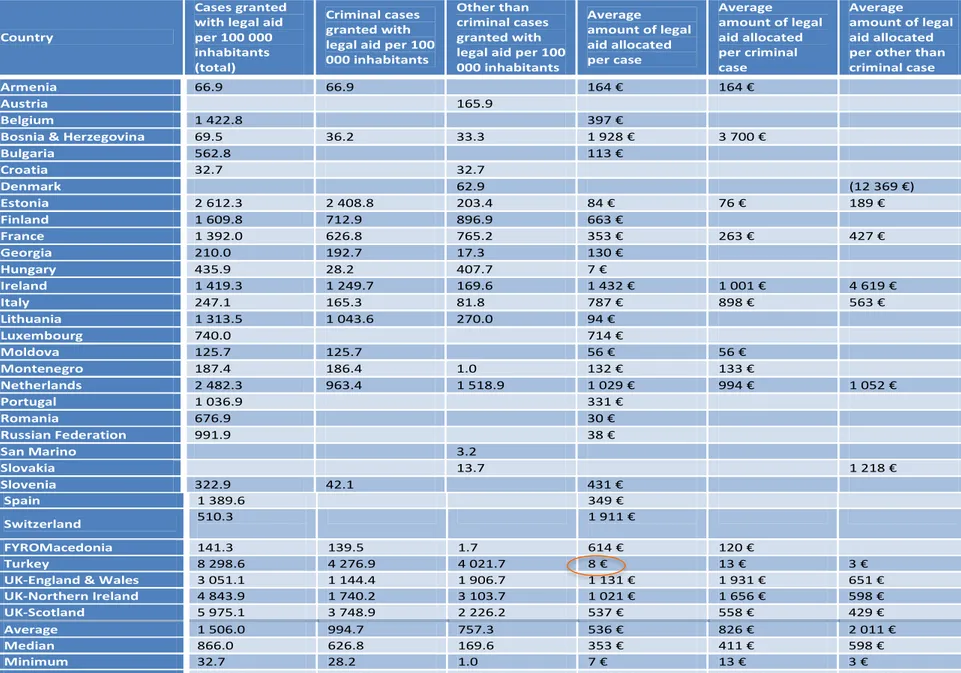
2008 yılında 100,000 ülke sakini başına adli yardım sağlanan davaların sayısı
ve kamu bütçesinden dava başına ayrılan adli yardımın ortalama miktarı
Kaynak: CEPEJ 2010 Raporı
52
Two thirds of the states or entities foresee the possibility of granting legal aid as regards the enforcement of judicial decisions.
Some systems enable to grant legal aid within the framework of Alternative Dispute Resolution (ADR) or transactional procedures (Bulgaria, France, Netherlands, Portugal, Slovakia)2.
Legal aid can also consist in bearing the fees of technical advisors or experts in the framework of judicial expertises (Belgium, Slovenia, Spain), preparing the documents that are needed to file a judicial proceeding (Bulgaria, Estonia, Latvia, Lithuania, UK-Scotland), or bearing (totally or partially) the cost of other legal professionals such as notaries, bailiffs (Greece, Turkey) or even private detectives (Italy). Travel costs can also be born by the legal aid system (Sweden).
Finally, it is worth stressing that only 5 member states have allowed a free access to all courts: France,
Iceland, Luxembourg, Monaco and Spain. This generalised access to court must be born in mind when
comparing the legal aid budgets of these states with the budgets of other states which also draw revenues from court fees.
3.2 The budget for legal aid
In chapter 2, budgetary data are given on the budget for legal aid in the member states in absolute numbers, per inhabitant and as a percentage of per capita GDP. In addition to this information, it is useful to identify the number of cases (criminal and other than criminal cases) that are supported through legal aid. On this basis, a calculation can be made on the average amount of legal aid allocated per case.
27 states or entities were able to provide data on the number of cases granted with legal aid. Therefore, it is possible to calculate the average amount of legal aid per case.
Table 3.3 Number of legal aid cases per 100.000 inhabitants and average amount allocated in the public budget for legal aid per case in 2008 (Q24, Q13, Q14)
Country
Cases granted with legal aid per 100 000 inhabitants (total)
Criminal cases granted with legal aid per 100 000 inhabitants
Other than criminal cases granted with legal aid per 100 000 inhabitants Average amount of legal aid allocated per case Average amount of legal aid allocated per criminal case Average amount of legal aid allocated per other than criminal case
Armenia 66.9 66.9 164 € 164 €
Austria 165.9
Belgium 1 422.8 397 €
Bosnia & Herzegovina 69.5 36.2 33.3 1 928 € 3 700 €
Bulgaria 562.8 113 € Croatia 32.7 32.7 Denmark 62.9 (12 369 €) Estonia 2 612.3 2 408.8 203.4 84 € 76 € 189 € Finland 1 609.8 712.9 896.9 663 € France 1 392.0 626.8 765.2 353 € 263 € 427 € Georgia 210.0 192.7 17.3 130 € Hungary 435.9 28.2 407.7 7 € Ireland 1 419.3 1 249.7 169.6 1 432 € 1 001 € 4 619 € Italy 247.1 165.3 81.8 787 € 898 € 563 € Lithuania 1 313.5 1 043.6 270.0 94 € Luxembourg 740.0 714 € Moldova 125.7 125.7 56 € 56 € Montenegro 187.4 186.4 1.0 132 € 133 € Netherlands 2 482.3 963.4 1 518.9 1 029 € 994 € 1 052 € Portugal 1 036.9 331 € Romania 676.9 30 € Russian Federation 991.9 38 € San Marino 3.2 Slovakia 13.7 1 218 € Slovenia 322.9 42.1 431 € 2
See Chapter 6.1.3 below.
53
Country
Cases granted with legal aid per 100 000 inhabitants (total)
Criminal cases granted with legal aid per 100 000 inhabitants
Other than criminal cases granted with legal aid per 100 000 inhabitants Average amount of legal aid allocated per case Average amount of legal aid allocated per criminal case Average amount of legal aid allocated per other than criminal case
Spain 1 389.6 349 €
Switzerland 510.3 1 911 €
FYROMacedonia 141.3 139.5 1.7 614 € 120 €
Turkey 8 298.6 4 276.9 4 021.7 8 € 13 € 3 €
UK-England & Wales 3 051.1 1 144.4 1 906.7 1 131 € 1 931 € 651 €
UK-Northern Ireland 4 843.9 1 740.2 3 103.7 1 021 € 1 656 € 598 € UK-Scotland 5 975.1 3 748.9 2 226.2 537 € 558 € 429 € Average 1 506.0 994.7 757.3 536 € 826 € 2 011 € Median 866.0 626.8 169.6 353 € 411 € 598 € Minimum 32.7 28.2 1.0 7 € 13 € 3 € Maximum 8 298.6 4 276.9 4 021.7 1 928 € 3 700 € 12 369 € Comments
Albania: legal aid for non-criminal matters has been developed since 2010.
France: since 2008, the annual public budget for legal aid has not only been fed through funds authorized by the law on
finances but has also been completed by the amount of the legal aid spending recovered by the state against the convicted parties condemned to pay court fees and who are not subject to legal aid. This amount is directly allocated to the Ministry of Justice. In 2008, an amount of 8,9 million Euros has then been transferred to the Ministry of Justice by the Ministry entrusted with the budget which enables to spend more than the amount authorized by the law on finances. Are not taken into account here, the cases which have not been addressed by the Legal Aid Offices and for which legal aid is granted automatically under the following circumstances: investigation custody, disciplinary procedure, prison isolation.
Hungary: only litigious cases are taken into account here. In non-litigious matters, 9.621 persons have been granted, in
addition, legal advice and assistance for the drafting of legal documents and 29.941 persons have been given advice by the staff of the legal assistance service.
Italy: the 2006 data which appears in the previous report regarding the amount allocated to legal aid for non criminal
cases must be corrected (23.481.012 €).
Moldova: the figures only take into account the cases from 1 July 2008 from which date the law on legal assistance was
enforced.
Montenegro: the legal framework of the legal aid system is being drafted.
Slovakia: the number of legal aid cases represents only those handled by the Legal Aid Centre. The number of cases
where lawyers are appointed free of charge by the judge in civil proceedings is not available. The number of criminal cases where an ex officio counsel is appointed for free to the defendant is not available.
Slovenia: the two legal aid systems (which covered, on the one hand, all legal fields and, on the other hand, only
criminal law cases) were merged on 1 September 2008. This evolution has had a significant impact on the 2008 data.