A CASE STUDY:
WIND CHARACTERISTICS OF IGDIR PROVINCE IN
TERMS OF WIND EROSION AND INTRODUCTION OF
SECOND WIND EROSION AREA
Mucahit Karaoglu*, Ugur Simsek, Erhan Erdel, Faruk TohumcuIgdir University, Faculty of Agriculture, Department of Soil Science and Plant Nutrition, Igdir, Turkey
ABSTRACT
Wind, temperature, humidity, and precipita-tion data of 2014-2017 taken from 5 automatic weather stations established in Igdir province and its surrounding area were evaluated in terms of wind erosion. Wind frequency, monthly mean wind speed, and prevailing wind direction along with wind speeds of 8 m.sec-1 (10 m height), which is accepted as the threshold value in terms of wind erosion, and above were determined. For each sta-tion, monthly strongest wind, monthly average relative humidity, monthly average temperature, and average of monthly total precipitation were shown on the same graph and interpreted. As a result of processing and interpretation of the men-tioned meteorological parameters; physical and chemical analyses and dry sieving processes were carried out by taking five different samples in five regions in the area, where the airport is located between Igdir and Tuzluca, and appears as a second potential wind erosion area. In the sampled sections of the second wind erosion area, sandy loam and loamy sand textures, 0.07-1.61 organic matter, neutral and alkaline pH values, and particle suscep-tible to wind erosion of 44.23-92.06% (<840 µ) were found.
KEYWORDS:
Wind, wind erosion, analysis, dry sieving, second wind erosion area
INTRODUCTION
Wind erosion is described as separation, transport, and accumulation of soils with the effect of wind. This is a dynamic physical event and loose, dry and bare soils are carried with strong winds. Wind erosion is a specific sub-topic of the wind activities (=Aeolian or eolian) [1]. Wind ero-sion is seen in different areas as coastal sand dunes [2], cultivated lands [3], scrubs and bushes [4], forests [5], and deserts [6].
The rate of aggregates at the top layer of the
soil (0-2.54 cm) is defined as wind-erodible fraction (EF). Erodible Fraction (EF) is the percentage of particles smaller than 0.84 mm and they are accept-ed as soil materials that are susceptible to be carriaccept-ed with the wind [7]. The grain-size study is a primary and widespread method used to specify the charac-teristics of sediment, the dynamics, deposition mechanism, and the aeolian landforms as well as the removing and grading of aeolian particles [8, 9, 10, 11, 12, 13, 14].
Dry sieving is a standard method for determin-ing some parameters concerndetermin-ing aggregation of soil and susceptibility to wind erosion [15]. Aggregates with a diameter larger than 0.84 mm are resistant to wind erosion [16]. The most important event in the wind erosion phases is the saltation movement. Saltation is the bouncing of soil particles having diameters larger than 106 µm. It erodes the immo-bile surface clods and crusts form the suspended particles (<106 µm) and the saltating and creep materials. Saltating aggregates break up and join into other particles depending on their sizes [17, 18].
A study was conducted to determine surface soil properties on an area of 12 ha in Turkey's sec-ond largest wind erosion area located in the Aralik-Igdir region. According to dry sieving experiments performed in this study, the rate of materials bigger than 0.84 mm was 0.48–30.47%, the rate of materi-als bigger than 0.106 mm was 47.17–87.73%, and the rate of materials smaller than 0.02 mm was 0.40–6.79% [19].
In a study conducted to determine the rate of sand transportation for fixed and semi-fixed dunes, the rate of sand transportation was determined as 4.56 kg.cm-1.y-1 and 57.38 kg.cm-1.y-1, respectively. It was reported that in the study area, annual aver-age wind speed was 3.4 m.s-1, strong windy (>17 m.s-1) occurred on 54 days per year, and the average wind speed playing an important role in sand trans-portation was 6 m.s-1 [20].
Dynamic soil properties are volume density and dry aggregate size distribution. These proper-ties change quickly due to the effect of meteorolog-ical events, ploughing and other cultural processes. The original soil properties are soil textures,
organ-ic matter, and mineralogy [1]. One of the primary soil properties that affect soil’s susceptibility to wind erosion or wind corrosion is soil texture. Ac-cording to sand, silt, clay and calcium carbonate (CaCO3) percentages of the soils; soil texture clas-ses, soil erodibility groups and soil erodibility indi-ces have been explained [21].
Studies on aeolian sediment transfer have stat-ed that spestat-ed, duration, and direction of wind are the three most important parameters affecting sedi-ment transport [22, 23] but average hourly wind speeds cannot be sufficient to predict the potential of sediment transport in some regions, and the wind data collected at high altitudes at weather stations such as 10 m above the ground should be converted into data obtained at 2 m height [24, 22].
Aggregates become separated with the lift force applied by the wind which is powerful than the creep as well as the gravity and binding forces holding the surface soil particles [25]. Separation continues with the effect of the rolling or bouncing particles on other particles to be released due to the impact and eroding effects. The wind speed at the moment when soil particles begin to move is called as "threshold wind speed", and the wind speed at 30 cm above the ground is 6 m.sec-1 or 20 km.h-1. This value is 8 m.sec-1 or 28 km.h-1 at 9 m above the ground [26]. Instead of the threshold wind speed, the expression of "critical friction velocity" is also used [27].
In this study, a new wind erosion field (around Igdir airport) was determined by examining the wind, temperature, precipitation, and moisture val-ues of five automatic weather stations where the measurements have just started to be made in Igdir province having the second largest wind erosion field (Aralik district) of Turkey and the amount of
erodible soil was determined by using the analyses conducted on the surface soil samples taken from this region and the dry sieving results and these values were commented and the region has been introduced as the second wind erosion site.
MATERIALS AND METHODS
Meteorological data. The wind (10 m height), temperature, precipitation and humidity data of 2014-2017 used in the study were obtained from automatic weather stations established by Turkish Meteorology Service in Igdir, Igdir airport, Tuzlu-ca, Karakoyunlu and Aralik regions (Figure 1). Daily data of the strongest winds and monthly data of the prevailing wind and the average wind were obtained. While monthly average of temperature and relative humidity data was obtained, precipita-tion data were collected monthly and annually in total.
By performing the monthly counts of 8 m.sec-1 and higher values of the strongest winds [25] ob-tained daily, wind potentials of the stations for the 2014-2017 period were determined in terms of erosion. With the help of monthly prevailing wind and average wind values for each station, annual prevailing wind and the strongest wind average values and their months and effects were explained. By offering the highest wind values with the monthly average temperature, monthly average relative humidity and total precipitation values for each month in the same graph, the critical periods were determined and interpreted in terms of wind erosion.
FIGURE 1
Field studies and taking of soil samples. 5 surface soil samples (0-2.5 cm) were collected [7] from each of 5 different points randomly selected [14] over the field located in the area where the airport is located between Igdir province and Tu-zluca district and which is evaluated as the second wind erosion area. The coordinates of the area in-cluded in the sample and the height of the sampled points from the sea level were determined by using Magellan eXplorist XL brand GPS device.
Laboratory studies. Soil samples were sifted through 2 and 0.5 mm sieves, their texture [28], soil reaction [29], lime [30], organic matter [31] and electrical conductivity [32] analyses were conduct-ed, and surface soil properties of the study area were determined. Soil sample of 1000 g was used for each sample in the dry sieving. The vibrating dry sieving device used in dry sieving processes [19] was Retsch brand and AS 200 basic model. sieve openings of 4 mm; 2 mm; 1 mm; 0.840 mm; 0.420 mm; 0.106 mm and 0.020 mm, vibration intensity of 50 Hz, and sieve duration of 5 minutes were applied. In order to make statistical interpreta-tion for the analysis and dry sieving results, one-way analysis of variance was applied.
Equations. Many factors such as long-term climate changes [33], seasonal climate changes [34], products [35], plowing techniques [36], water amount during plowing [37] and some soil charac-teristics [38] affect the EF amount. Organic carbon (OC) and clay scope are the main soil properties affecting the EF amount [39, 40].
Two equations were used to determine and compare the amount of erodible fraction (EF). First the equation (1) developed by Zobeck et al., [41] was used.
(1) Where; EF is the amount of erodible fraction (gr); W<0,84 is the amount of material less than 084 mm (gr) and TW is the total weight of the soil sam-ple. Secondly, the equation (2) developed by Fry-rear et al., [40] based on the physical properties of the soil was used.
(2) Where; OM is the organic material (%) and CaCO3 is lime (%).
RESULTS
Evaluation of meteorological data. The most important meteorological factors in the sediment transport of wind erosion were accepted as tempera-ture, precipitation, and wind. In addition, the monthly, seasonal, and annual condition of wind speed had an effect on the sediment transport direc-tion [42].
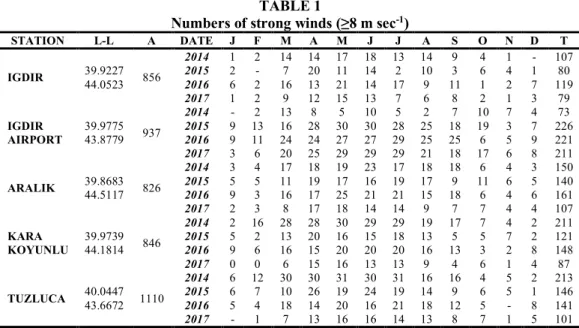
Table 1 shows monthly wind frequencies of 2014-2017 for the strongest winds with 8 m.sec-1 and higher values recorded in automatic stations operated in five different regions. The wind fre-quencies of the strongest winds (≥8 m.sec-1) were the highest in March-October. In this period, the temperature values were high and the relative hu-midity values were low. Igdir and its surrounding are the area having the least precipitation in Turkey with the annual precipitation average of 198.3-282.7 mm in 2014-2017 (Figure 2-6). According to these meteorological data, Igdir province and its surrounding area are a very suitable region for wind erosion. All data are encouraging the wind erosion. TABLE 1
Numbers of strong winds (≥8 m sec-1)
STATION L-L A DATE J F M A M J J A S O N D T IGDIR 39.9227 44.0523 856 2014 1 2 14 14 17 18 13 14 9 4 1 - 107 2015 2 - 7 20 11 14 2 10 3 6 4 1 80 2016 6 2 16 13 21 14 17 9 11 1 2 7 119 2017 1 2 9 12 15 13 7 6 8 2 1 3 79 IGDIR AIRPORT 39.9775 43.8779 937 2014 - 2 13 8 5 10 5 2 7 10 7 4 73 2015 9 13 16 28 30 30 28 25 18 19 3 7 226 2016 9 11 24 24 27 27 29 25 25 6 5 9 221 2017 3 6 20 25 29 29 29 21 18 17 6 8 211 ARALIK 39.8683 44.5117 826 2014 3 4 17 18 19 23 17 18 18 6 4 3 150 2015 5 5 11 19 17 16 19 17 9 11 6 5 140 2016 9 3 16 17 25 21 21 15 18 6 4 6 161 2017 2 3 8 17 18 14 14 9 7 7 4 4 107 KARA KOYUNLU 39.9739 44.1814 846 2014 2 16 28 28 30 29 29 19 17 7 4 2 211 2015 5 2 13 20 16 15 18 13 5 5 7 2 121 2016 9 6 16 15 20 20 20 16 13 3 2 8 148 2017 0 0 6 15 16 13 13 9 4 6 1 4 87 TUZLUCA 40.0447 43.6672 1110 2014 6 12 30 30 31 30 31 16 16 4 5 2 213 2015 6 7 10 26 19 24 19 14 9 6 5 1 146 2016 5 4 18 14 20 16 21 18 12 5 - 8 141 2017 - 1 7 13 16 16 14 13 8 7 1 5 101
The strong wind frequency of Aralik district known as the second largest wind erosion area of Turkey is less than the strong wind frequencies of Igdir airport, Karakoyunlu and Tuzluca. Bare lands are not much and very rough in Tuzluca and Kara-koyunlu (Figure 1). However, the area where Igdir airport is located is evaluated as the second wind erosion area since it has both the wide bare lands and wind potential (Table 1).
As a result of the evaluations made about the monthly prevailing wind directions and monthly average wind speeds of the automatic weather sta-tions (2014-2017), the annual prevailing wind di-rections were recorded as N-WNW for Igdir, E-ENE for Igdir airport, NWNW for Aralik, W-WSW for Karakoyunlu and ESE for Tuzluca. Monthly average wind speeds were recorded as
0.5-1.7 for Igdir, 2.1-4.9 for Igdir airport, 1.0-2.5 for Aralik, 0.9-2.2 for Karakoyunlu, and 0.8-2.2 m.sec-1 for Tuzluca. The monthly average wind speeds of the Igdir airport station were recorded as two times higher than the other stations.
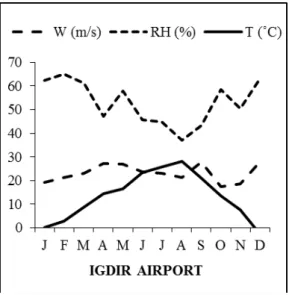
In Figures 2-6, monthly average relative hu-midity (RH), monthly mean temperature (T), total monthly precipitation (P) (except for Igdir airport) and the strongest wind monthly values of the sta-tions (W) for 2014-2017 are given with graphs. The fact that the humidity and precipitation values are low and the temperature is high during the months when the strongest wind values are seen is very important as an indicator of wind erosion. This period is seen as March-October for Igdir airport and March-September for Karakoyunlu, Aralik, and Tuzluca.
FIGURE 2 FIGURE 3
Meteorological parameters for Igdir Meteorological parameters for Igdir Airport
FIGURE 4 FIGURE 5
Meteorological parameters for Aralık Meteorological parameters Karakoyunlu -5 5 15 25 35 45 55 65 75 J F M A M J J A S O N D IGDIR STATION W (m/s) RH (%) T (˚C) P (mm) -5 5 15 25 35 45 55 65 75 85 J F M A M J J A S O N D ARALIK STATION W (m/s) RH (%) T (˚C) P (mm) 0 20 40 60 80 J F M A M J J A S O N D KARAKOYUNLU STATION W (m/s) RH (%) T (˚C) P (mm)
FIGURE 6
Meteorological parameters for Tuzluca TABLE 2
Results of analyses, dry sieving, and equations
Sample % µS/cm % gr
Sand Silt Clay TC OM CaCO3 pH EC >840 µ <840 µ >106 µ <106 µ EF1 EF2
1-1 59.2 24 16.8 SL 0.45 4.63 8.33 257 55.77 44.23 30.80 13.43 44.23 47.90 1-2 61.2 24 14.8 SL 0.90 4.55 8.19 195 47.20 52.80 36.16 16.64 52.80 47.66 1-3 62.2 28 9.8 SL 0.58 3.98 8.25 226 47.54 52.46 40.78 11.68 52.46 50.75 1-4 62.2 24 13.8 SL 0.71 3.82 8.19 274 40.20 59.80 48.38 11.42 59.80 52.30 1-5 63.2 25 11.8 SL 0.33 4.55 8.26 266 46.84 53.16 38.78 14.38 53.16 53.92 2-1 64.2 24 11.8 SL 0.97 4.46 8.2 435 43.45 56.55 41.60 14.95 56.55 52.57 2-2 59.2 27 13.8 SL 1.35 4.63 8.33 268 44.38 55.62 42.06 13.56 55.62 49.24 2-3 60.2 26 13.8 SL 1.35 5.11 8.28 245 40.10 59.90 41.01 18.89 59.90 48.99 2-4 58.2 25 16.8 SL 1.54 6.01 8.4 295 36.89 63.11 42.54 20.57 63.11 45.96 2-5 58.2 27 14.8 SL 1.48 5.76 8.3 400 40.74 59.26 41.36 17.9 59.26 44.52 3-1 59.2 24 16.8 SL 0.97 3.33 8.0 192 38.36 61.64 43.49 18.15 61.64 50.18 3-2 61.2 24 14.8 SL 1.16 2.44 7.97 267 37.03 62.97 49.40 13.57 62.97 51.76 3-3 64.2 22 13.8 SL 1.16 2.92 8.14 172 39.74 60.26 50.45 9.81 60.26 52.42 3-4 67.2 23 9.8 SL 1.03 2.68 8.14 174 43.52 56.48 47.96 8.52 56.48 56.28 3-5 62.9 27 10.1 SL 0.33 3.08 8.05 180 43.49 56.51 43.41 13.1 56.51 50.34 4-1 54.9 27 18.1 SL 1.29 9.50 8.25 221 54.02 45.98 39.47 6.51 45.98 42.18 4-2 54.9 26 19.1 SL 0.13 7.43 8.32 366 40.82 59.18 47.41 11.77 59.18 46.82 4-3 58.9 24 17.1 SL 0.77 7.31 8.6 239 35.62 64.38 51.12 13.26 64.38 46.74 4-4 59.9 24 16.1 SL 0.26 6.49 8.26 259 43.44 56.56 47.24 9.32 56.56 49.21 4-5 58.9 25 16.1 SL 1.61 7.47 8.36 241 39.96 60.04 49.76 10.28 60.04 44.80 5-1 80.9 13 6.1 LS 0.07 1.46 7.99 318 9.16 90.84 77.39 13.45 90.84 68.88 5-2 83.9 13 3.1 LS 0.13 1.83 8.0 1046 17.51 82.49 61.52 20.97 82.49 83.10 5-3 84.4 12 3.6 LS 0.07 1.22 8.21 259 14.19 85.81 48.04 17.77 85.81 80.21 5-4 84.9 12 3.1 LS 0.84 1.54 8.13 154 7.94 92.06 79.49 12.57 92.06 83.85 5-5 84.4 12 3.6 LS 0.13 1.62 7.97 1739 14.95 85.05 71.89 13.16 85.05 79.67 TC: Texture class; OM: Organic matter; EC: Electrical conductivity.
Evaluating the results of the analyses, dry sieving, and equations. Table 2 shows the results of Erodible Fraction (EF) determined for the analy-sis, dry sieving, and equations related to the 5 re-peated soil samples taken from 5 different points of the area, which is described as the second erosion area and where the Igdir airport is also located. While samples 1-4 had sandy loam texture, sample
5 had loamy sand texture. The sand components of the soil are very important as particles that trigger and sustain the wind erosion during the saltation phase.
It was found that organic matter (0.07-1.61) of all samples was at very low and low levels and the lime amounts (1.22-9.50) were lime and moderate lime [31]. It was reported that the organic matter
content of Turkish soils was generally low and the rate of lime soils was very high in terms of lime content, as a result of the assessment on approxi-mately 250 000 soil samples [32].According to the data, it was found that wind erodibility group (WEG) of the soil samples 1-4 was 3, soil erodibil-ity index (I) was 193 Mg.ha-1.yr-1, wind erodibility group (WEG) of soil sample 5 was 2 and soil erodi-bility index (I) was 300 Mg.ha-1.yr-1 [43].
The pH values (7.97-8.60) were measured as mild alkaline and strong alkaline [37, 34]. Since soil aeration and the water movement to the deeper level is less in arid climates, pH has neutral or alka-line values. The electrical conductivity values rep-resenting the amount of salt in the soil were meas-ured between 154-1739 µS/cm. According to these values, the sampled soils were determined as saline-free and very slightly saline [44].
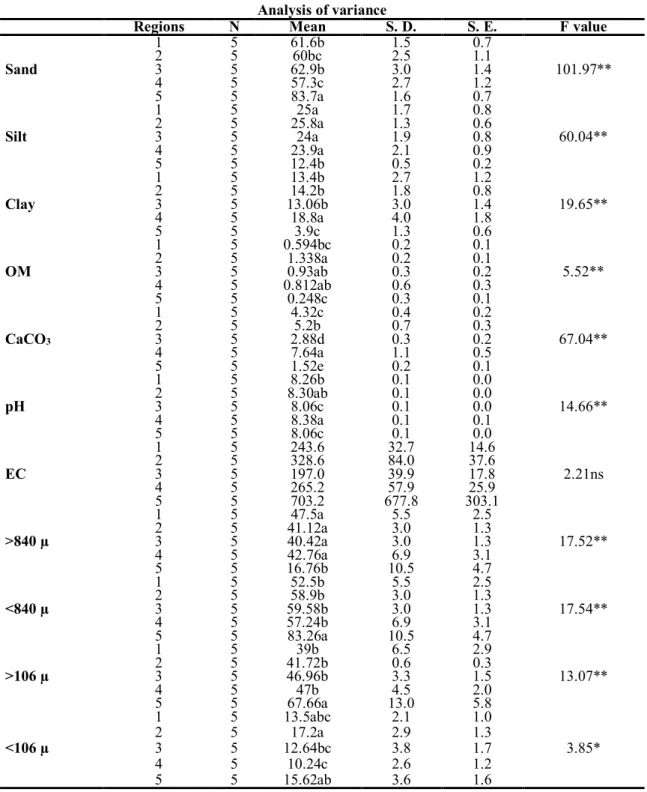
TABLE 3 Analysis of variance
Regions N Mean S. D. S. E. F value
Sand 1 5 61.6b 1.5 0.7 101.97** 2 5 60bc 2.5 1.1 3 5 62.9b 3.0 1.4 4 5 57.3c 2.7 1.2 5 5 83.7a 1.6 0.7 Silt 1 5 25a 1.7 0.8 60.04** 2 5 25.8a 1.3 0.6 3 5 24a 1.9 0.8 4 5 23.9a 2.1 0.9 5 5 12.4b 0.5 0.2 Clay 1 5 13.4b 2.7 1.2 19.65** 2 5 14.2b 1.8 0.8 3 5 13.06b 3.0 1.4 4 5 18.8a 4.0 1.8 5 5 3.9c 1.3 0.6 OM 1 5 0.594bc 0.2 0.1 5.52** 2 5 1.338a 0.2 0.1 3 5 0.93ab 0.3 0.2 4 5 0.812ab 0.6 0.3 5 5 0.248c 0.3 0.1 CaCO3 1 5 4.32c 0.4 0.2 67.04** 2 5 5.2b 0.7 0.3 3 5 2.88d 0.3 0.2 4 5 7.64a 1.1 0.5 5 5 1.52e 0.2 0.1 pH 1 5 8.26b 0.1 0.0 14.66** 2 5 8.30ab 0.1 0.0 3 5 8.06c 0.1 0.0 4 5 8.38a 0.1 0.1 5 5 8.06c 0.1 0.0 EC 1 5 243.6 32.7 14.6 2.21ns 2 5 328.6 84.0 37.6 3 5 197.0 39.9 17.8 4 5 265.2 57.9 25.9 5 5 703.2 677.8 303.1 >840 µ 1 5 47.5a 5.5 2.5 17.52** 2 5 41.12a 3.0 1.3 3 5 40.42a 3.0 1.3 4 5 42.76a 6.9 3.1 5 5 16.76b 10.5 4.7 <840 µ 1 5 52.5b 5.5 2.5 17.54** 2 5 58.9b 3.0 1.3 3 5 59.58b 3.0 1.3 4 5 57.24b 6.9 3.1 5 5 83.26a 10.5 4.7 >106 µ 1 5 39b 6.5 2.9 13.07** 2 5 41.72b 0.6 0.3 3 5 46.96b 3.3 1.5 4 5 47b 4.5 2.0 5 5 67.66a 13.0 5.8 <106 µ 1 5 13.5abc 2.1 1.0 3.85* 2 5 17.2a 2.9 1.3 3 5 12.64bc 3.8 1.7 4 5 10.24c 2.6 1.2 5 5 15.62ab 3.6 1.6
According to dry sieving results, the rate of soil particles larger than 840 µ was found between 35.62 and 55.77% for the soil samples 1-4 and between 6.94 and 17.51% for the soil sample 5. Percentage of soil particles larger than 106 µ signi-fies the amount of the soil particles that are dis-placed by saltating during wind erosion. It was found between 30.80 and 51.12% for the soil sam-ples 1-4 and between 48.04 and 79.49% for the soil sample 5. These results showed that all the soils sampled were susceptible to wind erosion and the soil sample 5 was more susceptible.
The erodible fractions (EF1 and EF2) obtained with the help of Equations 1 and 2 were found to be high for all samples and very high for sample num-ber 5. Soils around the Igdir airport are susceptible to wind erosion. During the arid climatic periods (March-October), wind erosion along with the strong winds is frequently seen.
Table 3 shows the variance analysis and mul-tiple comparison test results of the examined prop-erties of soils. Soil texture is one of primary proper-ties determining the soil’s character and significant-ly affects water movement and retention, aeration and temperature properties, development and stabil-ity of aggregates, resistance to erosion, and nutri-tional element reserve in the soil [45]. As seen in the table, while the highest sand percentage and the lowest clay percentage were observed in the fifth region, the lowest sand percentage and the highest clay percentage were determined in the fourth re-gion. It was determined that there was a significant difference (p <0.01) among the regions in terms of sand, clay and silt content determining the textural classification of soils.
Organic matter affects soil health by influenc-ing both chemical and physical properties of the soil [46]. The soil’s organic matter affects the soil structure, the water holding capacity of the soil, the activity of microorganisms and the usefulness of nutrients [47] and as the amount of organic matter in the soil increases, the aggregate stability also increases [48]. In this study, it was found that there was a significant difference (p <0.01) among the regions in terms of organic matter content, the low-est organic matter content was observed in the fifth region, and the highest organic matter content was observed in the third region.
The lime (CaCO3) content of soils is one of the factors influencing the aggregate stability. It was found that there was a significant difference (p <0.01) among the regions sampled in terms of lime content. The highest lime content was determined in the fourth region; whereas, the lowest lime con-tent was found in the fifth region.
Soil pH has an effect on soil factors such as soil bacteria, washing the nutrients, suitability, soil structure, and toxicity of various elements which are effective on plant development. Therefore, soil pH is one of the most important chemical soil
prop-erties controlling the nutrient bioavailability and microbial activity [49]. In this study, it was deter-mined that there was a difference (p <0.01) among the regions in terms of soil pH and while the high-est pH value was observed in the second region, the lowest pH value was observed in the third and fifth region soils. No statistically significant difference was found between the samples in terms of the electrical conductivity values.
It was revealed as a result of the variance analysis that the soil samples taken from different regions were significantly different (p<0.01) in terms of >840 µ, <840 µ, >106 µ, and <106 µ parti-cles as a result of dry sieving. As a result of com-paring the mean values, the highest mean value in terms of >840 µ particles was observed in the first region, the lowest mean value was determined in the fifth region. While the soil samples taken from the fifth region were in different group in terms of >840 µ particle content, there was no statistical difference between the other four regions and they were in the same group. In terms of <840 µ and >106 µ particle content, soil samples taken from the fifth region had the highest value and were involved in a group different from the other region soils. The first, second, third and fourth region soils had no difference in terms of <840 µ and >106 µ particle contents and were involved in the same group. In terms of the smallest particle content (<106 µ), it was found that the highest and the lowest values were observed in the second and fourth regions, respectively. There was no statistical difference between the soils of the first, second and fifth re-gions; on the other hand, the soils of the second region were different from the third and fourth regions and they were involved in a different group. Soils of the fifth region were in the same group with soil of third region but in different groups from the soil of fourth region in terms of <106 µ particle content. The first, third and fourth region soils were involved in the same group in terms of <106 µ particle content.
DISCUSSION
Wind erosion, which is known as an important soil erosion event in arid and sub-arid regions [50] is present as the second largest wind erosion area (13.600 ha) of Turkey in Aralik district, Igdir prov-ince. The airport area located between Tuzluca and Igdir has been featured as the second wind erosion area (10.000 ha) in Igdir province with its wind and soil characteristics. This area will be referred as "Igdir University Erosion Area" in our future stud-ies.
Igdir and its surrounding have strong wind po-tential. Aralik (1st Wind erosion area) and Igdir University Erosion Area (2nd Wind erosion area) having the strongest winds are the bare lands that
have lost their meadow quality. High temperatures, low humidity and precipitation, and naturally high evaporation values in Igdir and its surrounding trigger wind erosion.
Overgrazing, destruction of vegetation for its use as fuel, and insensitivity to soil protection measures are human-induced negative effects that promote wind erosion.
The above-mentioned negative effects reflect-ed on the results of analysis and dry sieving. The results were a large number of individual grains, sandy loam and loamy sand textures with weak aggregates, seldom organic matter; erosion-susceptible (<840 µ) particle amount in more than half of the sample weight or percentage and they were statistically verified.
CONCLUSION
Direct wind erosion measurements should be made immediately on both erosion areas. Direct wind erosion measurements provide more accurate and reliable results compared to the modellings although they are time consuming and costly stud-ies.
By forming sample fields surrounded by drought tolerant plant species, their effects reducing wind erosion should be determined. This study is necessary to change the incorrect habits of the local people. It is inevitable to get the support of local people in the result-oriented studies to be conducted and it will increase the success rate.
ACKNOWLEDGEMENTS
We as authors would like to the Turkish State Meteorology Service and Igdır Weather Station for the technical and data support.
The authors have declared no conflict of inter-est.
REFERENCES
[1] Zobeck, T.M., Van Pelt, R.S. (2014) Wind Erosion. Publications from USDA-ARS/UNL Faculty. Paper 1409.http://digitalcommons.unl. edu/usdaarsfacpub/1409.
[2] Cahill, T.A., Gill, T.E., Reid, J.S., Gearhart, E.A., Gillette, D.A. (1996) Saltating particles, playa crusts, and dust aerosols at Owens (Dry) Lake, California. Earth Surf. Process. Land-forms. 21, 621-639.
[3] Zobeck, T.M., Van Pelt, R.S. (2006) Wind-induced dust generation and transport mec-hanics on a bare agricultural field. J. Hazard. Mater. 132, 26-38.
[4] Whicker, J.J., Breshears, D.D., Wasiolek, P.T., Kirchner, T.B., Tavani, R.A., Schoep, D.A., Rodgers, J.C. (2002) Temporal and spatial var-iation of episodic wind erosion in unburned and burned semiarid shrubland. J. Environ. Qual. 31, 599-612.
[5] Whicker, J.J., Pinder III, J.E., Beshears, D.D., (2006) Increased wind erosion from forest fire: implications for contaminant-related risks. J. Environ. Qual. 35, 468-478.
[6] Honda, M., Shimizu, H. (1997) Study of transport mechanism of Aeolian sediments from the Taklimakan Desert: implication of grain-size distribution and major element com-position. J. Arid Land Stud. 7, 139-146. [7] Chepil, W.S. (1942) Measurement of wind
erosiveness of soils by the dry sieving proce-dure. Scientific Agriculture. 25, 154-160. [8] Sahu, B.K. (1964) Depositional mechanisms
from the size analysis of clastic sediments. J. Sediment. Petrol. 34(1), 73-78.
[9] Visher, G.S. (1969) Grain size distributions and depositional processes. Journal of Sedi-mentary Petrology. 39(3), 1074-1106.
[10] Barnorff-Nielsen, O.E., Christiansen, C. (1988) Erosion, deposition and size distributions of sand. Proc. R. Soc. London A Math. Phys. Sci. 417(1853), 335-352.
[11] Wang, X., Dong, Z., Zhang, J., Qu, J., Zhao, A. (2003) Grain size characteristics of dune sands in the central Taklimakan Sand Sea. Sediment. Geol. 161(1-2), 1-14.
[12] Farrell, E.J., Sherman D.J., Ellis, J.T., Li, B. (2012) Vertical distribution of grain size for wind blown sand. Aeolian Res. 7, 51-61. [13] Guan, Q., Zhang, J., Wang, L., Pan, B., Gui,
H., Zhang, C. (2013) Discussion of the rela-tionship between dustfall grain size and the de-sert border, taking the southern border of the Tengger Desert and the southern dust deposit area as an example. Palaeogeogr. Palaeocli-matol. Palaeoecol. 386, 1-7.
[14] Liu, B., Qua, J., Ning, D., Gao, Y., Zu, R., An, Z. (2014) Grain-size study of aeolian sedi-ments found east of Kumtagh Desert. Aeolian Research. 13, 1-6.
[15] Chepil, W.S. (1962) A compact rotary sieve and the importance of dry sieving in physical soil analysis. Soil Sci. Soc. Am. Proc. 26, 4-6. [16] Chepil, W.S. (1953) Factors that influence clod
structure and erodibility of soil by wind: I. Soil texture. Soil Sci. 75, 473-483.
[17] Mirzamostafa, N., Hagen, L.J., Stone, L.R., Skidmore, E.L. (1998) Soil and aggregate tex-ture effects on suspension components from wind erosion. Soil Sci. Soc. Am. J. 62, 1351-1361.
[18] Hagen, L.J. (2002) Processes of soil erosion by wind. Annals of Arid Zone. 40(3), 235-254.
[19] Karaoğlu, M., Şimşek, U., Tohumcu, F., Erdel, E. (2017) Determining surface soil properties of wind erosion area of Igdir-Aralik and esti-mating the soil loss. Fresen. Environ. Bull. 26, 3170-3175.
[20] Xia, H., Lian-You, L., Shun-Jiang, L., Bi-Lin, X., Mu-Xing, L. (2009) Estimation of Sand Transportation Rate for Fixed and Semi-Fixed Dunes Using Meteorological Wind Data. Pe-dosphere. 19(1), 129-136,
[21] USDA-NRCS. (2017) Soil survey manual. United States Department of Agriculture Handbook No. 18. Issued March 2017.
[22] Liu, L.Y., Shi, P.J., Gao, S.Y. (2004) Dustfall in China’s western loess plateau as influenced by dust storm and haze events. Atmos. Envi-ron. 38, 1699-1703.
[23] Barth, H.J. (2001) Characteristics of the wind regime north of Jubail, Saudi Arabia, based on high resolution wind data. J. Arid Environ. 47, 387-402.
[24] Toy, T.J., Foster, G.R., Renard, K.G. (2002) Soil erosion: Processes, prediction, measure-ment, and control. John Wiley and Sons, New York.
[25] Mezősi, G., Blanka, V., Bata, T., Kovács, F., Meyer, B. (2015) Estimation of regional diffe-rences in wind erosion sensitivity in Hungary. Nat. Hazards Earth Syst. Sci. 15, 97-107. [26] Gee, G.W., Bauder J.W. (1986) Particle-size
analysis. In: Klute, A. (ed.) Methods of soil analysis. Part 1. 2nd ed. Agron. Monogr. 9. ASA and SSSA, Madison, WI. 383–411. [27] McLean, E.O. (1982) Soil pH and lime
re-quirement. In: Page, A.L., Miller, R.H. and Keeney, D.R. (eds.) Methods of soil analysis. Part 2 - Chemical and microbiological proper-ties. 2nd Ed. Agronomy. 9, 199-223.
[28] Nelson, R.E. (1982) Carbonate and gypsum. In: Page, A.L. Miller, R.H. and Keeney, D.R. (eds). Methods of soil analysis. Part 2. 2nd ed. Agron. Monogr. 9. ASA and SSSA, Madison, WI., 181-197.
[29] Nelson, D.W., Sommer, L.E. (1982) Total carbon, organic carbon, and organic matter. In: Page, A.L. (ed.) Methods of Soil Analysis. 2nd Ed. ASA Monogr. 9(2). Amer. Soc. Agron. Madison, WI., 539-579.
[30] Demiralay, İ. (1993) The Physical Analysis of Soil. Atatürk University Agricultural Faculty Publications. Pub. No: 143. (In Turkish). [31] Ulgen, N., Yurtsever, N. (1974) Guide of
Tur-key Fertilizer and Fertilizing. Ministry of Vil-lage Works and Cooperatives, Research Inst. of Soil Fertilizer Publ. No: 28. Ankara. (In Turk-ish).
[32] Eyüpoğlu, F. (1999) The productivity potential of Turkey soils. The Prime Ministry of Turkey, General Directorate of Village Services, Soil and Fertilizer Research Institute Pub. General Pub. No: 220. Technical Pub. No: T-67. (Turk-ish).
[33] Merrill, S.D., Black, A.L., Fryrear, D.W., Saleh, A., Zobeck, T.M., Halvorson, A.D., Tanaka, D.L. (1999) Soil wind erosion hazard of spring wheat fallow as affected by long term climate and tillage. Soil Sci. Soc. Am. Journal. 63, 1768-1777.
[34] Layton, J.B., Skidmore, E.L., Thompson, C.A., (1993) Winter associated changes in dry soil aggregation as influenced by management. Soil Sci. Soc. Am. Journal, 57, 1568-1572.
[35] Skidmore, E.L., Layton, J.B., Armbrust, D.V., Hooker, M.L. (1986) Soil physical properties as influenced by of cropping and residue man-agement. Soil Sci. Soc. Am. J. 50, 415-419. [36] Hevia, G.G., Mendéz, M.J., Buschiazzo, D.E.,
(2007) Tillage affects soil aggregation parame-ters linked with wind erosion. Geoderma. 140, 90-96.
[37] Wagner, L.E., Ambe, N.E., Barnes, P. (1992) Tillage-induced soil aggregate status as influ-enced by water contents. Trans. ASAE. 35(2), 499-504.
[38] Zobeck, T.M. (1991) Soil properties affecting wind erosion. Journal of Soil and Water Con-servation. 46, 112-117.
[39] Skidmore, E.L., Layton, J.B. (1992) Dry-soil aggregate stability as influenced by selected soil properties. Soil Sci. Soc. Am. J. 56, 557-561.
[40] Fryrear, D.W., Krammes, C.A., Williamson, D.L., Zobeck, T.M. (1994) Computing the wind erosion fraction of soils. Soil Water Con-servation. 49, 183-188
[41] Zobeck, T.M., Popham, T.W., Skidmore, E.L., Lamb, J.A., Merril, S.D., Lindstrom, M.J., Mokma, D.L., Yoder, R.E. (2003) Aggregate-mean diameter and wind-erodible soil predic-tions using dry aggregate-size distribupredic-tions. Soil Sci. Soc. Am. J. 67, 425-436.
[42] Okur, M., Demiryürek, M., Taysun, A., Okur, O. (2008) Karapınar rüzgar erozyon sahasında toprak özellikleri kuru agregat yüzdeleri ve to-prak taşınımı üzerine mevsimsel etkinin belir-lenmesi. DSİ IV. Bölge müdürlüğü Konya ka-palı havzası yer altı suyu ve kuraklık kon-feransı, Konya.
[43] USDA-NRCS. (2011) National agronomy manual. 4th edition. Issued February 2011. [44] Soil Survey Staff. (1993) Soil survey manual.
United States Department of Agriculture. Handbook No. 18. U.S. Gov. Printing Office, Washington, DC.
[45] Brady, N.C., Weil, R.R. (2008) The Nature and Properties of Soils. 14 ed. Pearson-Prentice Hall, Upper Saddle River. NJ. ISBN: 13-978-0-13-227938-3. 990p.
[46] Bell, M.J., Moody, D.W., Connolly, R.D., Bridge, B.J. (1998) The role of active fractions of soil organic matter in physical and chemical fertility of fernasols. Aust. J. Soil Res. 36, 809-820.
[47] Brussoard, L. (1998) Soil fauna, guilds, func-tional groups and ecosystem process. Appl. Soil Ecol. 9, 127-139.
[48] Kemper, W.D., Koch, E.J. (1965) Aggregate stability. In: Black, C.A. (Ed.) Methods of soil analysis. Part I. American Society of Agricul-ture. Madison. Wisconsin. USA. 1, 511-519. [49] Liu, G., Hanlon, E. (2012) Soil pH range for
optimum commercial vegetable production. http://edis.ifas.ufl.edu/pdffiles/HS/HS120700.p df.
[50] Lal, R. (1990) Soil erosion and land degrada-tion: the global risks. In: Lal, R., Stewart, B.A. (Eds.) Soil Degradation. Adv. Soil Sci. 11, 129-172. Received: 19.03.2018 Accepted: 30.07.2018 CORRESPONDING AUTHOR Mucahit Karaoglu Igdir University, Faculty of Agriculture,
Department of Soil Science and Plant Nutrition, Igdir – Turkey