KADİR HAS UNIVERSITY
SCHOOL OF GRADUATE STUDIES
PROGRAM OF ECONOMICS
IMPACT ASSESMENT OF TURKEY 2023 TOURISM ACTION PLAN
CIGDEM ERTEKIN
MASTER’S THESIS
ISTANBUL, MAY, 2019
IMPACT ASSESMENT OF TURKEY 2023 TOURISM ACTION PLAN
CIGDEM ERTEKIN
MASTER’S THESIS
Submitted to the School of Graduate Studies of Kadir Has University in partial fulfillment of
the requirements for the degree of Master’s in the Program of Economics
iii
TABLE OF CONTENTS
ABSTRACT ... v
ÖZET ... vi
LIST OF TABLES ... vii
LIST OF FIGURES ... viii
LIST OF ABBREVIATIONS ... ix
1. INTRODUCTION
... 1
2. LITERATURE REVIEW ... 5
2.1. Demand Side Review ... 6
2.2. Supply Side Revivew ... 8
3. DATA AND VARIABLE SELECTION ... 12
3.1. Data Source ... 12
3.2. Variable Selection... 13
3.2.1. Dependent variable: revenue per Capita ... 15
3.2.2. Length of stay and group size (not included) ... 18
3.2.3. Time variable: quaterly analysis between 2006-2018 ... 18
3.2.4. Independent variables: tertiary share and high income share ... 19
3.2.5. Dummy variables ... 23
4.METHODOLOGY ... 26
4.1. Sample Size and Empirical Framework ... 26
4.2. Descriptive Statistics ... 30
5. RESULTS AND DISCUSSION ... 32
5.1. Initial Analysis ... 32
5.2. Regression Analysis ... 32
5.2.1. Ordinary Least Squares ... 33
5.2.2. Instrumental Variable Analysis……….34
5.2.3. Panel Data Analysis………..………36
5.2.4. Alternative Analysis with Policy Dummy 2010……….... .. 38
5.2.5 Robustness Analysis………...39
5.3. Discussion …..………..40
5.4. CONCLUSION………... 44
iv
CURRICULUM VITAE………49
APPENDIX A……….50
APPENDIX B……….77
EQUATION B.5.1………..77
EQUATION B.5.1………..77
v
IMPACT ASSESSMENT OF TURKEY 2023 TOURISM ACTION PLAN
ABSTRACT
Tourism Strategy of Turkey – 2023 and the Action Plan for 2013 [Tourism Strategy 2023] have
the target of making Turkey a top brand in the world with superior income and visitor figures
by 2023. One of the major aims of this new strategy is to increase revenue per tourist and it
emphasizes the role of cultural tourism in reaching this goal. In this thesis, I investigate the
impact of this strategy. I use both instrumental variable and panel data methods and find an
impact of $103-$192 per tourist depending on the empirical method for the 2011-2018 period
compared to the preceding period of 2006-2010. These results are statistically and economically
significant and robust to alternative assumptions.
Keywords: Education Level of Tourists; Foreign Tourist Profiles; High Income Tourists;
vi
TÜRKİYE 2023 TURİZM AKSİYON PLANI ETKİ ANALİZİ
ÖZET
Türkiye Turizm Stratejisi -2023 ve 2013 Aksiyon Planı (Turizm Stratejisi 2023), Türkiye’yi
2023’te dünyada üst seviyede gelir ve ziyaretçi rakamlarına sahip zirve bir marka haline
getirmeyi hedeflemektedir. Bu yeni stratejinin başlıca amaçlarından biri turist başı geliri
artırmak olup, bu amaca ulaşmak için kültür turizminin rolü üzerinde durmaktadır. Bu tezde
ben, bu stratejinin etki analizini araştırmaktayım. Araçsal değişken ve panel veri analizi
metotlarının her ikisini de kullanarak 2011-2018 döneminde, öncesindeki 2006-2010 dönemine
kıyasla, kullanılan ampirik metoda göre değişkenlik göstermekle beraber, turist başı $103-$192
etki bulunmaktadır. Bu sonuçlar istatistiksel ve ekonomik olarak anlamlı ve alternatif
varsayımlara karşı güçlüdür.
Anahtar Sözcükler: Turistlerin Eğitim Seviyesi, Yabancı Turist Profilleri, Yüksek Gelirli
vii
LIST OF TABLES
Table 3.1 – Expenditure Patterns in the reviewed literature………. 13
Table 3.2 – Consumption Patterns in the reviewed literature………... 13
Table 3.3 - Holiday Type and Tourist Profiles in the reviewed literature……… 15
Table 3.4- Descriptive Statistics for Tourism Income, Total Number of Visitors and Revenue
per Capita………... 16
Table 3.5- Descriptive Statistics for High Income and High Income Share………. 20
Table 3.6 - Descriptive Statistics for Tertiary Education, Other Education and Tertiary
Share………. 22
Table 5.1 All Estimation Comparisons (OLS & IV)……… 41
Table 5.2 All Estimation Comparisons (RDD)……….42
Table A3: Full Results of OLS and IV Estimates……… 63
Table A4: Full Results of Regression Discontinuity Design……… 66
Table A5- Robustness Analysis……… 68
Table A6- Alternative Instrumental Variables Analysis with Policy Dummy 2010…… 70
viii
LIST OF FIGURES
Figure 3.1- Revenue per capita by years (2006-2018)………. .17
Figure 3.2 – Mean of revenue per capita before and after year 2010………... 18
Figure 3.3- High income share by years (2006-2018)……….. 20
Figure 3.4 - Tertiary share by years (2006-2018)………. 22
Figure 3.5 – Mean of tertiary share before and after year 2010………... 23
ix
LIST OF ABBREVIATIONS
REV
c/ REVc: Revenue per capita of the countries /for each country
𝐸 : Expectation
HI
c:/ HIc: High Income of the countries /for each country
TS
c/ TSc: Tertiary Share of the countries /for each country
TSc
0/ TSc0: The cutoff tertiary share /for each country
Hic
0/ Hic0: The cutoff high income share /for each country
𝑦𝑐 / Yc: Outcome variable for the countries /for each country
Z
c/ Zc: The instrumental variable for the countries /for each country
P
c/ Pc: Policy variable for the countries /for each country
D
c/ Dc: The treatment variable for the countries /for each country
w
c/ wc: Western European Countries /for each country
n
c/ nc: Neighboring Countries /for each country
The Strategy / Tourism Strategy 2023: Tourism Strategy of Turkey-2023 and The Action Plan
2013
TURKSTAT: Turkish Statistical Institute
OLS: Ordinary Least Squares Analysis
IV: Instrumental Variable
1
1 INTRODUCTION
I analyze the impacts of the Tourism Strategy of Turkey-2023
1and The Action Plan 2013
released by the Ministry of Culture and Tourism in 2007, in line with the Strategic Plan
2010-2014 (hereafter Tourism Strategy 2023 for brevity). The Tourism Strategy 2023 aims to make
Turkey a top brand in the world with superior income and visitor figures by 2023 (T.R.Ministry
of Tourism and Culture, 2007a). In this sense, the Strategy provides short-term, medium-term
and long-term action plans (T.R.Ministry of Tourism and Culture, 2007a, p. 42). It is widely
accepted that tourism is a tool for development for some developing economies. However, most
of the time the question is whether per capita revenue is growing whilst the numbers of tourists
are growing. It is also another consideration whether the incoming tourists are value adding
(increasing revenue per capita) tourists or not. Tourist segmentation is very important for
increasing per capita tourism revenue – whether they are from the high income segment or not,
whether they are from a specific age segment, whether they belong to a specific education
segment. Additionally, which type of holiday these tourists prefer.
Turkey has been a major destination for sun, sea and sand tourism for many years due to the
abundance of its natural resources. However, Turkey also has many attractions for other holiday
types, with its under-used potential to be a cultural, heritage, sports, shopping, and conference
destination. As detailed in Tourism Strategy 2023, the policymakers in Turkey chose to focus
on cultural tourism to attain their specified goals (T.R.Ministry of Tourism and Culture, 2007a).
Kozak (2002) analyzed British and German tourists visiting Turkey and Mallorca; both on the
origin side and the destination side regarding their travel motivations in terms of destination
choice. His findings reveal four main motivations in the study. An important finding of this
study is that “German tourists’ reason for choosing Turkey but not Mallorca are generally due
to cultural and historical reasons whereas the British preferred more leisure.
When compared to Mallorca, other than destination characteristics the most important reason
1 “Tourism Strategy of Turkey -2023 and Activity Plan for Tourism Strategy of Turkey 2007-2013 dated 28/02/2007 and numbered 2007/4, was approved by the High (supreme) Planning Commission, and was put into action after its publication in ‘Official Journal’ dated 02/03/2007 and numbered 26450” (T.R.Ministry of Tourism and Culture, 2007a).
2
for personal motivation for Turkey turns out to be culture and nature” (Kozak, 2002, p. 230).
Kozak (2002) advises Turkish policymakers that: “the focus should be given to cultural
amenities because cultural tourism returns more income than sun, sea, sand type of tourism”
(Kozak, 2002).
In this context, it is important to underline what these natural and cultural resources include.
Most of the time, heritage tourism is one of these natural and cultural resources. Heritage
tourism includes the history and culture of the destination and can also be a tool of attraction
for tourists from other nations with a common history as well. Therefore, it can be expected
that this kind of tourism will bring such tourists who have a higher education level and earn
higher income, thereby spending more and bringing in more revenue.
In this sense, Silberberg analyzes the tourists who visit museums and heritage sites in Canada
and The United States. According to Silberberg’s definition, “these types of tourist are people
who earn more money and consume more when they are on holiday , have a tendency to make
more shopping, more literate than the average” (Silberberg, 1995, p. 363).
Concerning these basic traits, Silberberg remarks on the tendencies of these types of tourists
which correlate to their spending and travelling preferences. Based on the foundations on the
previous studies done, Silberberg (1995) analyzes the heritage visitors in Canada and The
United States and describes their features as “high income, heavy spenders, heavy shoppers,
high education” (Silberberg, 1995, p. 363).
The Executive Summary of Tourism Strategy 2023 states that mass tourism has brought
drawbacks as well (T.R.Ministry of Tourism and Culture, 2007b, p. 2). In this respect, the
Strategy lays down several actions to actualize the mentioned vision. Therefore, Turkey has to
use alternative resources by which it can grow while allocating the resources optimally.
My thesis mainly relates to analysis of two of the main ideas stated in the Strategy:
“Constructing tourism product in accordance with visitor profile and increasing the number of
value – adding tourist numbers and tourism revenues” (T.R.Ministry of Tourism and Culture,
2007b, p. 3). In this sense, the main strategies are delineated in the Strategy.
3
strategies referred to in this thesis can be listed as “marketing, promotion, strategy and city
branding tourism diversification, tourism developmental zones and corridors” (T.R.Ministry of
Tourism and Culture, 2007a).
The Tourism Strategy of Turkey is planned to reach its completion in 2023; however it has been
broken down into phases in order for it to be monitored and revised during the period. In this
respect, the first phase to evaluate the targets are planned for 2013 (T.R.Ministry of Tourism
and Culture, 2007a, p. 42). Therefore, Turkish Tourism Strategy Action Plan 2013 is prepared
including the action plans of the strategies mentioned above. The starting dates of the actions
for city branding strategy starts in 2007 and the duration is 6 years for the longest arrangements.
These actions include the basic preparations for a 6-years Action plan 2013. For the action plans
relating to cultural tourism, arrangements range from 3 to 4 years, hence I expect to observe the
results of these action plans after 2010 or 2011.
The starting dates of the actions for tourism diversification strategy are in 2007 for all the
arrangements except for marine tourism and one arrangement of eco-tourism. The duration of
each differs from each other - from 1 to 6 years. The main arrangements of the actions required
for the study are explained under actions for tourism developmental zones and tourism
developmental corridors starting in 2007 and their durations are 3 to 4 years (T.R.Ministry of
Tourism and Culture, 2007a, pp. 72-81). The details are available in the action plan in the
Appendix. These are discussed under the Strategy Section 3.13. Tourism Developmental Zones
and Section 3.14. Tourism Developmental Corridors headings of the document (T.R.Ministry
of Tourism and Culture, 2007a, pp. 72-81).
My contribution in this study is to evaluate whether the number of tourists interested in cultural
sites has increased. Due to data limitations, we cannot directly observe this. The purpose of
visit data are collected through face to face surveys at border gates on a quarterly basis
2but
total answers to this questions are much lower than the total number of visitors. In other words,
most tourists do not answer this purpose of visit question.
Alternatively, in this study I use the following empirical strategy. I hypothesize that more
educated tourists on average are more likely to respond to the new Turkish Tourism Strategy.
Education level information about the visitors is available by nationality. I calculate the tertiary
4
education level of each tourist supplying country for every quarter between the year 2006 and
the first quarter of 2018. In this respect, I calculate the tertiary share of each country by dividing
the total number of visitors with tertiary education by the total number of visitors from each
country. I use tertiary share as a proxy for tourists interested in cultural tourism. I then
empirically investigate the relationship between the increase in share of tourists with tertiary
education and revenue per capita with quarterly data for 30 countries.
I employ three alternative empirical studies. First, I use OLS analysis with pooled data from all
countries. Then I employ Instrumental Variable (IV) analysis. IV is a two stage regression
method wherein at the first stage tertiary share is regressed on policy and at the second stage
estimated tertiary share is used to investigate the relationship between revenue per capita and
education. The policy dummy variable was created for quarters 2011 and onwards, since the
first phase of the action plan 2013 for cultural tourism sites was expected to come to fruition
by 2010. I also investigate the same question with panel data methods because the IV method
is liable to be biased due to the path dependency in the number of visitors from each country.
Path dependency in tourist behavior may result in serial correlation problems in empirical
investigation.
My estimates from the empirical analysis suggest that in the post 2010 period, the share of
tourists with tertiary education has increased by seven and a half percent, ceteris paribus,
coinciding with the completion of the first phase of investments oriented towards cultural
tourism sites. The seven and a half percent increase in tertiary educated share resulted in
increase revenue per share by $103 to $192 depending on the estimation strategy.
5
2 LITERATURE REVIEW
In terms of applying the right strategy in the tourism sector, the literature provides different
ideas about the segmentation of tourist profiles and tourism types. Tourism strategy is a
combination of many aspects, therefore in order to apply the correct marketing strategy it is
necessary to analyze the tourists and what they pay for. In order to do this, it is necessary to
determine what the preferences of the specific types of tourists are, what the main
characteristics of those tourists with specific tastes are, what kind of tourism product attracts
what kind of tourists and who the higher spending or higher revenue bringing tourists are; the
tourism type should be focused on which earns more revenue as well as sustaining the resources.
Last but not least these questions require further examination on revenue, thereby on
expenditure and consumption patterns.
In this respect, the main idea in the literature is that it is crucial to segment the visitors and their
tastes in order to estimate the increase in revenue per tourist. The literature includes firstly
marketing segmentation strategies for specific tourist profiles, tourism products, ideas on the
destinations, origins, expenditure, alternative holiday types, and nationality based
segmentation, product based segmentation and so on. Since the analysis of this paper is on the
impacts of Turkey’s new tourism strategy, my focus is on the high income generating tourists
who are expected to have higher incomes and have higher socio-economic status. Secondly, it
is necessary to check whether alternative tourism types other than mass tourism attract higher
revenue generating tourist types. In sum, these will offer control as to whether the new
strategy’s focus on cultural tourism really affects the revenue generation per tourist.
In order to understand this three-step process, the patterns which affect demand side and supply
side should be understood at first. Therefore, I divided the reviewed literature into demand side
studies and supply side studies. The demand side focused studies are generally concerned with
price, income, expenditure, and elasticity matters.
6
The supply side focused studies are concerned with services, transportation and accommodation
facilities, and the tourism product and tourist’s country of origin, destination, tourist preferences
and related subjects. In the reviewed literature, supply side studies include the categories of
cultural tourism, rural tourism, medical tourism, sports tourism, culinary tourism, food tourism,
air transport, tourist attractions, tourist profile, tourist segments, wine tourism, health tourism,
urban tourism, and finally mass tourism.
There are also other categories which are influencing factors on both demand and supply. These
categories include many wider aspects such as economic growth, host perceptions,
sustainability, destination image, tourism growth, the multiplier effect, tourism segmentation,
travel motivations, purchasing decision, and tourism policies.
The categories mentioned above are not strict categorizations. The segregation is made
according to the main subjects they are under, however most of them can be discussed under
demand, supply or other categories as well. This categorization is made only in order to frame
the literature and the studied subject.
In analyzing these impacts, the literature concentrates on either destination or origin countries
and mostly uses time series analyses. The time variable is very important because, as Morley
(1998) also emphasizes, the importance of time variables is due to the accumulating effect of
past tourism numbers for correct estimations (Morley, 1998, p. 71). This is again due to the fact
that since tourism is a very complex combination of many ingredients, the analysis should be
based on the comparison of past values with the today’s values, in order to have a correct view
of the future. In general, tourism always targets for increasing total numbers of tourists.
Therefore, a general increase in numbers can cause the researcher to make mistakes during the
estimations (Morley, 1998, p. 71).
2.1 DEMAND SIDE REVIEW
The reviewed literature also includes expenditure patterns analyses. It is necessary to include
the expenditure patterns in the analysis, firstly to be able to apply a targeted market
segmentation and secondly because of the flexibility of demand (Jang, et al., 2004, pp.
331-332).
7
Nicolau and Mas (2005) studied tourist expenditure in Spain, and groups the expected
determiners for expenditure in three categories (Nicolau & Más, 2005, p. 273). In the study, the
determiners are tested both for their effects on expenditure and on trip decisions (Nicolau &
Más, 2005). The first group includes destination features, the second personal restraints and the
third group the socio-demographic attributes (Nicolau & Más, 2005, p. 273). Proximity was
found to be effective on expenditure. Likewise, place of stay, income, group size, and duration
of stay (Nicolau & Más, 2005, p. 287).
In another study on tourism in Spain, two of the findings are outstanding and supportive. The
results show that high income and highly educated tourists have a higher spending trend than
the poor and that highly educated tourists spend higher than the lower educated ones
(García-Sánchez, et al., 2013, pp. 627-628).
Another finding is from the work of Perez & Juaneda (2000), analyzing both the origin and the
destination according to the market segments. The study is based on the Balearic Islands, Spain.
They test the effect of elements related to both personal and travel on expenditure in their
models. The highest impacts on spending are found to be in origin and nationality (Perez &
Juaneda, 2000, pp. 630-633).
Louca (2006) addresses effect of the policy change on income and expenditure of tourism in
Cyprus, by researching whether the investments made in tourism in Cyprus has resulted in an
increase in the number of tourists and their expenditures (Louca, 2006, p. 605). The focus of
the investments was on building hotels and thereby on infrastructure, transportation and
promotional activities (Louca, 2006, p. 604). The policy’s effect however on the income
generated is not as high as it could have been (Louca, 2006, p. 614). Even more per capita
spending is likely to decrease it (Louca, 2006, p. 614).
Becken & Gnoth (2004) examine the consumption of tourists from the USA, Germany and
Australia in New Zealand, according to tourist types. In the study, the findings show that
nationality is the differentiating factor. However, not only is nationality the important factor
but also their traveling preferences do matter (Becken & Gnoth, 2004, p. 379). Another study
by Mykletun and Crotts (2011) also found the same result in their study on the Baltic States. In
the study of tourist spending as per segmented visitors, out of the included variable set, the most
prominent one is found out to be nationality (Mykletun, et al., 2001, p. 500).
8
does not not reflect whether this spending pattern provides an increase in revenue or not. Many
other variables affect the increase in revenue, such as length of stay or party size (accompanying
persons). Kozak (2001) analyzing tourist spending in Turkey, reports that duration of holiday
and the number of people in the group of visitors importantly affect expenditure. However, in
the study he also adds that despite the larger size in visitor groups, the rise in spending is not
large enough. He explains this by discussing sold package types, what these packages include
(Kozak, 2001).
Although most of the studies in the literature take either the origin side or destination side as
basis for analysis, Kozak (2002) introduces a study comparing tourists from the same two
countries to two different destinations (Mallorca and Turkey) with tourists from two different
countries (British and German) to the one same destination. Comparing these two countries,
finding Turkey’s competitive advantage to be its culture and nature, Kozak (2002) concludes
by advising Turkish policy-makers to focus on cultural and natural amenities (Kozak, 2002, pp.
230-231).
On the other hand, in examining the determinants of consumption, it is also necessary to take
types of tourism into account as well. For example, in the analysis of cultural tourism
expenditure determinants, Richards and Van der Ark, L. A. (2013) claim that the features of
cultural tourism are not clear cut (Richards & Van der Ark, 2013, p. 74). In their study they find
that the type of tourism affects the degree of consumption in cultural tourism to a very high
level. Additionally, there are also segmentations among the cultural tourists as well; for
example more educated tourists prefer museums but not festivals (Richards & Van der Ark,
2013, p. 74).
2.2 SUPPLY SIDE REVIEW
The literature also provides insight into the segmentation of the tourist profiles, either focusing
on the origin or destination in terms of nationality segregations or not, while also providing
insights into the drawbacks of mass tourism.
In this context, in the selected literature two concepts have mainly been covered: host
perceptions, and residents’ attitudes. Tosun (2002) analyzes host perceptions about mass
tourism attractions in Turkey, and Perez (2005) studies the expenditure levels of mass tourism.
Similarly, Harrill (2004) proposes a literature review on tourism planning and development and
9
finds many different arguments on the residents’ attitudes, some positive and some negative. In
general, however, he argues that the organizers among the planners should not only target the
attraction of more visitors to the destination but also developing the destination to be more
attractive, as well as sustaining the resources (Harrill, 2004, p. 264).
Another study carried out by Baysan (2001) studies the effects of mass tourism on the
environment in three nations – Germany, Russia and Turkey (Baysan, 2001, p. 218). In this
study, Baysan (2001) finds that education and nationality are significantly related to each other
(Baysan, 2001, p. 225). Conversely, Germans are more mindful about the natural and
environmental side of the subject, with a relatively lower education level (Baysan, 2001, p.
225). That’s why it is not possible to strictly relate these two variables to each other.
Another study, performed by Tosun (2002), asks about the negative effects of mass tourism in
Ürgüp. The destination is not a standard sun, sea, sand destination but it is also added to the
travel plans of sun tourists in their travel packages, as a local feature. Although the region has
aspects of a religious and historical tourism product for the tourists, it has gained a recreational
image. In this sense, both the resources are overused and a cultural tourism product has turned
out to become more of a leisure tourism product (Tosun, 2002, p. 235).
Kozak (2002)’s findings are very much in line with the Turkish Tourism Strategy and provided
a guide for which types of tourism and which type of tourist profile my study should focus on.
The literature in general supports the view by studies on profiles of those tourists who are the
consumers of cultural tourism.
In this respect, Hughes (2002) states that the term cultural tourism has different perceptions and
does not mean the same for everyone (Hughes, 2002, p. 165). In his study, he attempts to
segment these cultural tourists, but he emphasizes two sub-categories; the first group is those
visitors who are purposely taking a cultural trip and the second group are those who are taking
another type of trip but consuming cultural products as well (Hughes, 2002, pp. 170-172).
Hughes and Allen (2005) review the literature and reports from Holcomb (1999) profiling the
cultural tourists as having higher education, higher income level, travelling often, and upmarket
tourists (Hughes and Allen, 2005; p. 176).
There are other studies which support the above mentioned arguments. Kim, et al. (2007)
examine the preferences in cultural utilization of intellectual and non-intellectual cultural events
10
and conclude that high-class tourists prefer intellectual culture, while low class tourists enjoy
non-intellectual events (Kim, et al., 2007, p. 1367). It can be concluded through this study that
education and income are influencing variables to understand which kinds of cultural products
are preferred by the visitors, excluding local festivals and fairs (Kim, et al., 2007, p. 1370).
Heritage tourism is another sub-heading under the cultural and natural resources umbrella.
Silberberg (1995) analyzes the heritage visitors in Canada and the United States and depicts
their features as high income, heavy spenders, heavy shoppers, high education (Silberberg,
1995, p. 363). Nguyen (2014) also supports the findings of Silberberg and defines their features.
In this respect, Nguyen also mentions them as having a high education and higher income
(Nguyen & Cheung, 2014, p. 39). In another study made on authenticity in heritage tourism,
the results correspond to the above results: middle age and high income are the most important
features of these tourists (Chhabra, et al., 2003, p. 716).
In addition to the above findings, another component of cultural tourism is festival and Expo
visitors. Although in the literature, festival and Expo visitors are not as much parallel to heritage
ones as cultural tourists, in a study made by Lee et al. (2004), culture is found out to be the most
important source of motivation of festival and Expo visitors (Lee, et al., 2004, pp. 67,69).
Turkey is a country which has religious attractions for both Christianity and Islam. Some of
them can be discussed under heritage tourism as well. In a study of Manisa for developing it as
a religious tourism destination, Atli et al., (2015) list the necessary steps for a plan. Their
research is based on the monuments in Manisa (Atli, et al., 2015, p. 222). Yet they also
emphasize the relationship between heritage tourism and religious tourism (Atli, et al., 2015, p.
225). In this sense, the tourist profiles can be assumed to be similar to those of heritage tourists.
Another study of Indian Temples by Prasad and Rani (2015) gives an insight that the visitors
can be defined as repeat visitors and they stay in cheap places (Prasad & Rani, 2015, p. 123) .
Molera & Albaladejo (2007) segment the rural tourists into many categories and analyse them
deeply. The important finding of the study is that higher education level relates to likelihood to
be a rural tourist (Molera & Albaladejo, 2007, p. 763). Sharpley’s study on Cyprus is about the
development program of rural tourism in Cyprus, (Sharpley, 2002, p. 237). The main target of
this program was diversification; however revenue increase did not match the target. (Sharpley,
2002, p. 242). Data about medical tourism, also known as health and wellness tourism, is not
easy to find and therefore the literature in this context is very limited. There are other legal
11
barriers in this concept of tourism as well. However, for Turkey, there is a spa and thermal
tourism potential which cannot be underestimated. This natural resource, if it can be marketed
well and used sustainably, can provide high revenues to Turkey in line with the new Tourism
Strategy. An example study is on Kazakhstan to Turkey visitors for health tourism. According
to this study, a project between Turkey and Kazakhstan on thermal tourism is expected to
provide $3 billion direct revenue by 2030 (Yesilyurt, et al., 2018, p. 57).
Sports tourism is another type of tourism which can bring additional revenue. Barquet et al.
(2011) analyzing the winter sports events and tourist expenditure through the Biathlon World
Cup, find out that group size and income level have a great effect on revenue. If group size
increases, expenditures decrease, whereas visitors with a high income lead to higher income
levels in the results (Barquet, et al., 2011, pp. 1207-1209). Another important branch under
sports tourism is golf tourism. In terms of revenue generation, golf is one of the most striking
tools. Golf players spend considerably more and can be target visitors to increase revenue per
capita (Shani, et al., 2010).
12
3 DATA AND VARIABLE SELECTION
Findings from the literature led me to focus on tourists’ nationality, purpose of visit, income
and education levels, since the literature shows that these variables have significant effects on
the results. The data time variable starts as of year 2006, the earliest available quarterly data by
country (nationality). In order to measure the implications of the Strategy, total generated
income by country is included in the dataset along with expenditure by country. The number of
visitors is also grouped by country. The panel data haves been grouped by nationality (country)
variable.
3.1 DATA SOURCE
Data for the variable creation have been downloaded from TURKSTAT databases on the web.
On the website of TURKSTAT, under the title of Statistics by Theme, the Education, Culture,
Sport and Tourism tab provides the Tourism Statistics for the essential variables (TURKSTAT,
2018). On the website, the statistics for Tourism have been designated as Dynamic Search and
Statistical Tables. Statistical Tables comprise “Border Statistics”, “Departing Visitor
Statistics”, “Arriving Citizen Statistics” and “Household Tourism Statistics” (TURKSTAT,
2018). These tables and statistics include the numbers for demographics, occupation status,
education level, purpose of visit, nationality of the tourists, as well as accommodation types,
number of overnights, tourism income, type of expenditure, and expenses. However the above
mentioned statistics are all for general numbers in Turkey and are not broken down as per
nationality.
In order to constitute the panel for nationality, the data are collected from TURKSTAT on the
Dynamic Search tab. Under this tab, the statistics are divided as per years. The former statistics
are in between the years 2003-2012 and the latter are after 2012. The format of each group is
different. I derive the statistics from these different formats and assemble them in a data table.
This new data table is grouped as per country for each variable, either a dependent or
independent variable.
13
3.2 VARIABLE SELECTION
As per the literature, factors affecting the demand side can be grouped under expenditure and
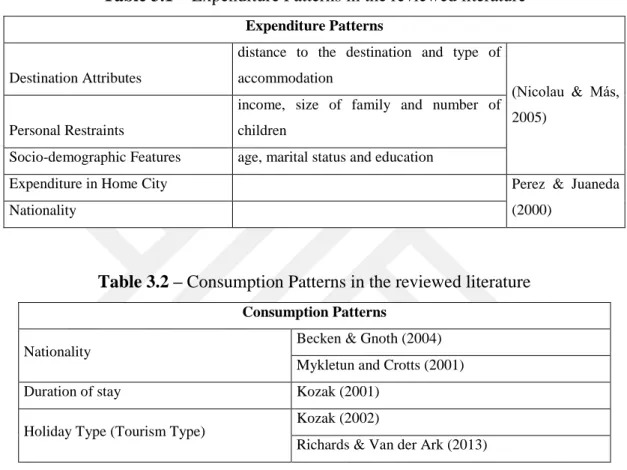
consumption patterns. Table 3.1 and Table 3.2 show the common determinants of expenditure
and consumption through the reviewed literature.
Table 3.1 – Expenditure Patterns in the reviewed literature
Expenditure Patterns
Destination Attributes
distance to the destination and type of accommodation
(Nicolau & Más, 2005)
Personal Restraints
income, size of family and number of children
Socio-demographic Features age, marital status and education
Expenditure in Home City Perez & Juaneda (2000)
Nationality
Table 3.2 – Consumption Patterns in the reviewed literature
Consumption Patterns
Nationality Becken & Gnoth (2004) Mykletun and Crotts (2001) Duration of stay Kozak (2001)
Holiday Type (Tourism Type) Kozak (2002)
Richards & Van der Ark (2013)
Nationality appears to be the most effective factor in determining consumption patterns. Both
Becken & Gnoth (2004) and Mykletun & Crotts (2001) define nationality as the most important
variable. Therefore, labeled as “country” I include nationality as the independent variable in
this thesis. However, I do not include length of stay or group size in the estimation because as
stated in the literature review, their estimations are complex due to the fact that they are very
much dependent on the holiday package type sold (Kozak, 2001, pp. 199-200).
As per the factors affecting expenditure patterns found in the literature, I include income level
in the variables since it affects the revenue per capita by affecting tourism revenue per capita.
Since the main quest of the thesis is revenue per visitor increase, income level of the visitors
should be included in the estimation. I do not include other factors like size of family and
14
number of children in the estimation due to the fact that they are not directly related to the main
question of this study. Additionally, details of the accompanying persons in the dataset are not
broken down by nationality, and are therefore excluded from the total numbers. Destination
distance characteristics are included in the data as country and region dummies, whereas type
of accommodation is not included because the main question in this study is based on the
destination country – Turkey – in general, not at a local level. In terms of socio-economic
characteristics, education level is included in the estimation as an independent variable. Because
the new strategy aims at creating tourism products based on tourist profile and as the literature
suggests that other than sun-sea-sand tourism Turkey should focus on its natural and cultural
amenities (Kozak, 2002, pp. 230-231) and cultural tourism, visitors are defined to be people
with higher education in many studies. Age and marital status are not included in the estimation.
Likewise, expenditure in the home city is not included in the estimation process.
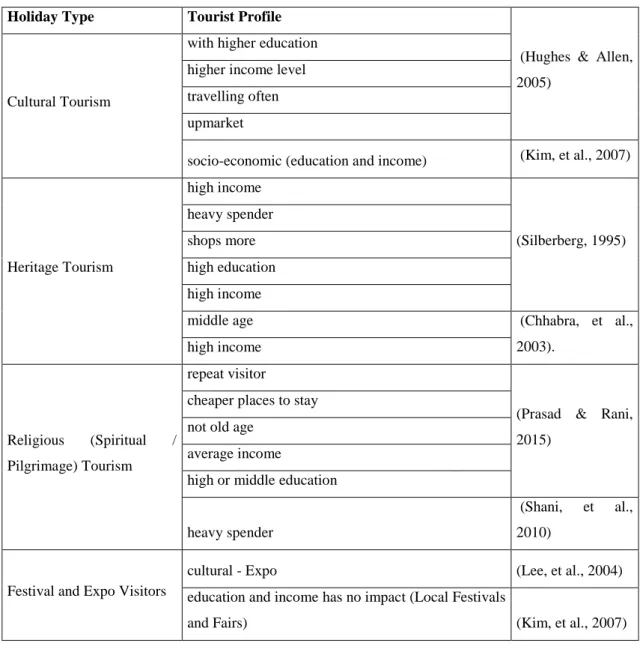
The supply side studies in the literature are reviewed in terms of holiday type, in order to find
the variables affecting the supply side (tourism product). As can be seen in Table 3.3, cultural
and heritage tourists are commonly defined as having higher income and education. Likewise,
special and alternative holiday types like golf tourism are also defined as those which attract
higher income visitors.
Tourism supply side is not limited to holiday type. However, since the new Tourism Strategy
of Turkey also concentrates on the question of tourist profiles for high income generation, in
this study the factors for attracting other holiday types than mass tourism are examined under
holiday type. In this respect, education level and income level are chosen to be the independent
variables of the estimation, since they are found to be the most outstanding characteristics of
cultural, heritage and alternative types of holiday.
15
Table 3.3 - Holiday Type and Tourist Profiles in the reviewed literature
Holiday Type Tourist Profile
(Hughes & Allen, 2005)
Cultural Tourism
with higher education higher income level travelling often upmarket
socio-economic (education and income) (Kim, et al., 2007)
Heritage Tourism high income (Silberberg, 1995) heavy spender shops more high education high income
middle age (Chhabra, et al., 2003).
high income
Religious (Spiritual / Pilgrimage) Tourism
repeat visitor
(Prasad & Rani, 2015)
cheaper places to stay not old age
average income
high or middle education
heavy spender
(Shani, et al., 2010)
Festival and Expo Visitors
cultural - Expo (Lee, et al., 2004) education and income has no impact (Local Festivals
and Fairs) (Kim, et al., 2007)
3.2.1 Dependent Variable: revenue per Capita
In order to estimate whether the new tourism strategy resulted in higher revenue per tourist as
per basic economic theories, firstly the revenue gathered after the policy change should be
greater than the revenue gathered before the policy change. Therefore, in an attempt to estimate
the per tourist revenue increase, the dependent variable in this study is selected to be “revenue
per capita”. The revenue data in this study are downloaded from the TURKSTAT website. In
16
the TURKSTAT data, the revenue is labeled as “tourism income”. Tourism Income values
3in
the data are defined in thousand US$. The data used are for departing foreign visitors. I excluded
the numbers for Accompanying People from the data due to the fact that accompanying people
data were not grouped by country but were given in total for each quarter. Therefore, the
available data include the tourism income for each country; however this income is the
generated total revenue for each country in general. In order to estimate the per visitor revenue,
the total number of visitors data are also downloaded from the TURKSTAT database for each
country and tourism income divided by total number of visitors in order to arrive at the “revenue
per capita” variable. The data are grouped by nationality
4.Dividing the tourism income by total
number of visitors, “revenue per capita” for each country is estimated. This study’s aim is to
estimate whether the implemented new Tourism Strategy has had a real causal impact on the
intended revenue increase. This fact is the reason why income per capita is selected to be the
dependent variable of this study.
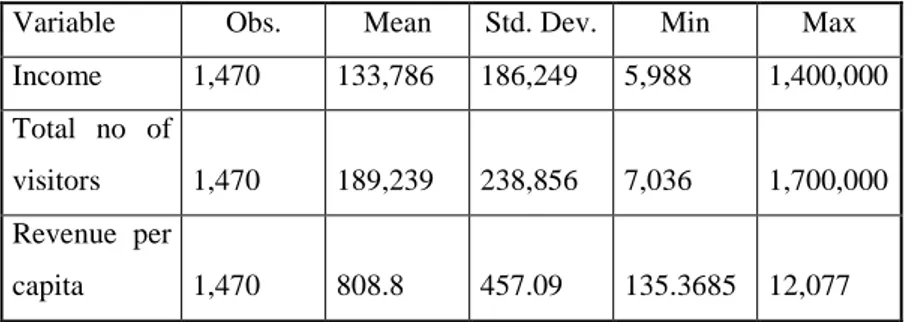
Table 3.4 provides the descriptive statistics for income, total number of visitors and revenue
per capita. A total of 1,470 observations obtained.
Table 3.4- Descriptive Statistics for Tourism Income, Total Number of Visitors and Revenue
per Capita
Variable Obs. Mean Std. Dev. Min Max Income 1,470 133,786 186,249 5,988 1,400,000 Total no of visitors 1,470 189,239 238,856 7,036 1,700,000 Revenue per capita 1,470 808.8 457.09 135.3685 12,077
3 includes food and beverage, accommodation, health, transportation in Turkey, sports, education, culture, international transportation with Turkish firms, mobile phone roaming expenditures, marina service expenditures, souvenirs etc. (TURKSTAT, 2018)
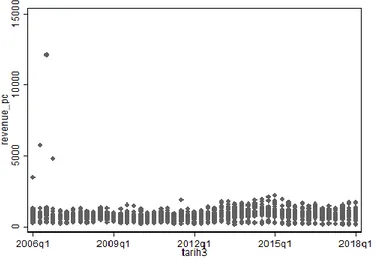
17
Figure 3.1- Revenue per capita by years (2006-2018)
The mean for the total number of visitors is around 189,239 with standard deviation of 238,856.
The maximum number of visitors is 1,700,000. It is the total number of visitors for Russia in
summer, 2014. The minimum total number of visitors is 7,036. It is the total number of visitors
from Tunisia in autumn 2017. The maximum number corresponds to the high season for tourism
(summer). Therefore, the data for total number of visitors are significant. For income, which
represents total tourism income generated, the mean is around 133,786 ($ in thousands) with
standard deviation 186,249. The minimum income generated is 5,988 again from Tunisia in
autumn 2007. The maximum income generated is 1,400,000 ($ in thousands) which is for
Germany in summer 2013. The mean revenue per capita (the average) is 809 ($) with a standard
deviation of 457. The minimum revenue per capita is $135 which is for Georgia in 2017, quarter
3. The maximum value of the revenue per capita is $12,077, which corresponds to Tunisia in
summer 2006.
5The value stands out as an outlier. There are three more outliers than this in
2006, as is also shown in Figure 3.1 for revenue per capita.
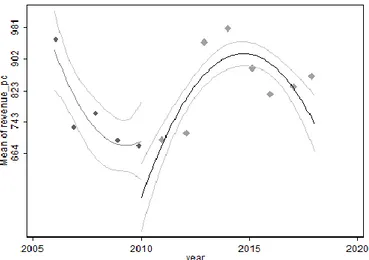
Another figure for revenue per capita in a chosen cutoff year 2010 is included in Figure 3.2
below. This figure shows the mean of revenue per capita had an increase after 2011, in around
2012. The peak is in 2015. As explained under The Strategy of Turkey 2023 section, the first
phase preparations in terms of cultural tourism are planned to be completed in 2010 and 2011,
the increase after 2011, corresponding to 2012 is clearly visible in this figure.
5 The descriptive statistics of total number of visitors, income and revenue per capita for mean, standard deviation, minimum and maximum are rolled up
18
Figure 3.2 – Mean of revenue per capita before and after year 2010
3.2.2 Length of Stay and Group Size (Not Included)
Length of stay and group size were not expected to be significant in the literature; therefore
they are not included in this analysis, either. Although many tourism expenditure studies in the
literature claim that length of stay is an important variable in determining tourism receipts
(Becken & Gnoth, 2004), it is not always the case. Kozak also agrees that length of stay
estimations are complex (Kozak, 2001). Therefore, in this study, length of stay and group
(party) size is not included.
3.2.3 Time Variable: Quarterly Analysis between 2006-2018
The estimations are made on a quarterly basis between the years 2006 and 2018’s first quarter.
Since the tourism sector has a seasonal structure in its nature, it is inevitable to face the
seasonality effect, therefore a yearly analysis would not yield sound results. In this respect,
either monthly or quarterly analysis is required for this estimation. However, the monthly data
in the TURKSTAT database is available for general tourism statistics, but not available for each
independent variable when they are broken down into nationality (country) level. Taking both
the former and the latter reasons into account, the time variable of this analysis is set at
quarterly.
19
3.2.4 Independent Variables: Tertiary Share and High Income Share
The revenue gathered depends on the income generated per tourist, thus making it dependent
on the tourist spending determinants. As reviewed in the literature, tourist expenditure
determinants are related to three main categories: individual, personal and socio-demographic
characteristics – one of them is the income. However, income itself is not a fully explanatory
variable due to the fact that there can be incremental values in the results; however this increase
may not reflect an outstanding effect, because of the changing consumption determinants, their
elasticity and other external reasons. Repeating Louca (2006)’s study on the case of Cyprus,
there can be an increase in the trend, however the targeted income or per capita targets may not
be reached (Louca, 2006).
As covered in the literature in detail, different types of holiday (the tourism product) are
preferred by different types of tourists in different personal and socio-economic categories.
Confirmed in many studies, as high income earners are mostly associated with cultural, heritage
and alternative types of tourism products such as golf tourism, they are expected to bring in
more revenue. Therefore, I include an income level variable in the estimation as high and
middle income categories which define the number of tourists visiting Turkey as per their
income level. In the TURKSTAT database, the data for the income level according to
nationality can be obtained not by nationality itself but combined with type of travel
organization (personal or package tour). The breakdown of the income level was a scale from
very low to very high scale combined with travel type. Since the differences between high/low
income and very high/low income level have variances per country basis, I sum up the high and
very high income under “high income” by combining the high and very high income levels in
all types of travel. Unfortunately, this is subjective data (visitors’ declaration) delivered through
face to face survey, so visitors with similar incomes from different countries may declare
different levels of income. The same relates to very low and low income visitors as well as
middle income ones, and I have grouped all of these under “middle income”. Therefore, for the
Income Level of the visitors departing Turkey has been grouped under “high income” and
“middle income” levels as per their nationality.
Dividing the high income by the total number of visitors per country, I obtain the high income
share variable. High income share is necessary for the estimation because each country has a
different number of visitors. One country may have brought only high income visitors, however
20
the total number of visitors from this country may not be very high. Conversely, another country
which has a very high total number of visitors may have not very high income level visitors.
Additionally, the data for departing visitors have been collected through a survey
6which means
that the data contain a declared income level which depends on the perception of the surveyed
visitors. The visitor can declare himself/ herself of an income level which may just be their
personal perception. In addition to this, high income or low income levels are different for each
country. High Income for Germany may be different than high income for Tunisia. These
factors may all create errors in the estimation due to the averaging effect. In order to avoid error
due to averages, high income share as independent variable acts as a control variable estimate
demand side effect on the revenue per capita increase. I use high income share as a proxy for
tourists interested in cultural tourism, since those visitors who are interested in cultural tourism
are expected to have higher income levels in the literature. I then empirically investigate the
relationship between the increase in share of tourists with high income and revenue per capita,
with quarterly data for each country.
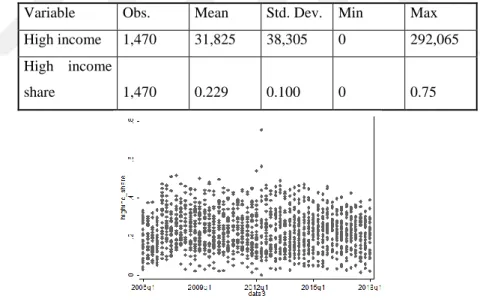
Table 3.5- Descriptive Statistics for High Income and High Income Share
Variable Obs. Mean Std. Dev. Min Max High income 1,470 31,825 38,305 0 292,065 High income
share 1,470 0.229 0.100 0 0.75
Figure 3.3- High income share by years (2006-2018)
The mean for high income is 31,825 with standard deviation 38,305. The maximum high
6 The data according to the departing citizen visitors: Survey forms are prepared. These forms are used quarterly through face to face survey method, with the aim of collecting data about citizens, mostly at the departure gates (TURKSTAT, 2018)
21
income is 292,065 for France in summer 2015. The High Income Share mean is 0.23 with a
standard deviation of 0.1, with a maximum value of 0.75 which corresponds to Israel in 2012,
quarter 2. It is an outlier in the data, as it is also visible in Figure 3.2, which shows the data for
high income share by quarters.
The mean for high income is 31,825 with standard deviation 38,305. The maximum high
income is 292,065 for France in summer 2015. The High Income Share mean is 0.23 with a
standard deviation of 0.1 with a maximum value of 0.75, which corresponds to Israel in 2012,
quarter 2. It is an outlier in the data as it is also visible in Figure 3.2 which shows the data for
high income share by quarters.
7It is my hypothesis in this study that the education level of the visitors is expected to increase,
with the Strategy focusing on cultural tourism. The literature also supports my hypothesis. For
example, when discussing golf tourism Shani, et al. (2010) mention the relationship between
tourist expenditure and level of education (Shani, et al., 2010) . Likewise, other studies in the
literature support the fact that education level has an impact on attracting high revenue bringing
types of tourists who mostly prefer cultural and alternative types of tourism with higher
revenues. Therefore, I include education level in the estimation as an independent variable.
Education level variables mean other education and tertiary education variables which define
the number of tourists visiting Turkey as per their education level. The database in TURKSTAT
classifies education level of the tourists as pre-primary education (not-literate), first level or
primary education, second level or primary education (8 years), high school and equivalent,
faculty or higher education school, master of science or doctorate (TURKSTAT, 2018). I have
regrouped these groups into two as “other education” which contains the summation of
pre-primary school, pre-primary, second level or pre-primary education (8 years), and high school; and
“tertiary education” which is the summation of faculty or higher education school, Master of
Science or doctorate. These variables are again grouped as per their nationality. Dividing
income for each country by total number of tertiary visitors, I create a tertiary share variable.
As stated above in high income share, the education levels of each country are different.
Additionally, the total number of visitors from one country may not be very high but the tertiary
level visitor numbers may be high, or vice versa. This increases the possibility of error due to
7 The descriptive statistics of total number of visitors, income and revenue per capita for mean, standard deviation, minimum and maximum are rolled up
22
the averaging effect. I use tertiary share as a proxy for tourists interested in cultural tourism, as
the visitors who are interested in cultural tourism are expected to have higher income levels in
the literature. I then empirically investigate the relationship between the increase in share of
tourists with high income and revenue per capita, with quarterly data for each country. I include
tertiary share as an independent variable in this study.
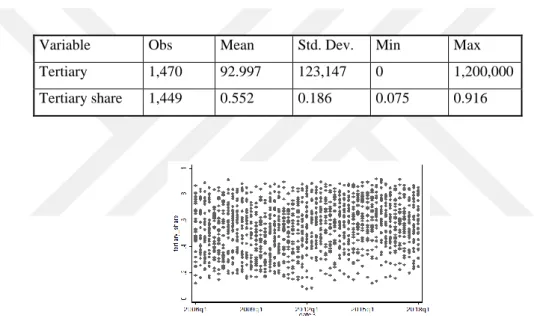
Table 3.6 below provides the descriptive statistics for tertiary education, other education and
tertiary share. For 1,470 total observations, the tertiary mean is 92,977 with standard deviation
123,147.
Table 3.6 - Descriptive Statistics for Tertiary Education, Other Education and Tertiary Share
Figure 3.4 - Tertiary share by years (2006-2018)
The maximum tertiary number of visitors is 120,000. This number corresponds to Russia in
summer 2014. The mean for tertiary share is 0.55, with a standard deviation of 0.186. The
maximum value for tertiary share is 0.92, which corresponds to the USA tertiary share in
autumn 2015. The minimum value is 0.07, which corresponds to the Syria tertiary share in
winter 2012. In Figure 3.3, the scatter graph for tertiary share is included.
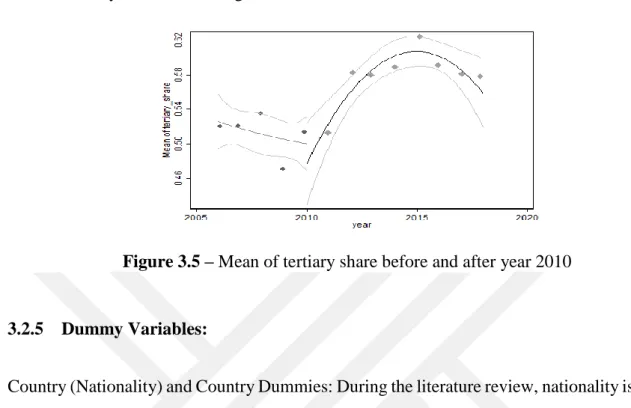
Another figure for the tertiary share with the chosen cutoff year of 2010 is included in Figure
3.4. This figure shows that the mean of tertiary share has a leap after 2011, around the year
2012.
As explained in The Strategy of Turkey 2023 section, cultural tourism first phase preparations
Variable Obs Mean Std. Dev. Min Max Tertiary 1,470 92.997 123,147 0 1,200,000 Tertiary share 1,449 0.552 0.186 0.075 0.916
23
are planned to be completed in 2010 and 2011, and the increase after 2011, corresponding to
2012, is clearly visible in this figure.
Figure 3.5 – Mean of tertiary share before and after year 2010
3.2.5 Dummy Variables:
Country (Nationality) and Country Dummies: During the literature review, nationality is treated
as a significant factor almost throughout all the tourism studies. As explained by both Becken
& Knot’s (2004) and Mykeletun’s (2001) studies, nationality is expected to be related with
revenue per capita. Another important finding is that there is a significant relationship between
education and nationality. (Baysan, 2001, p. 225) Nationality is not the only determinant, but
with a mix of other external and internal factors may provide different results than expected
(Baysan, 2001, p. 225). The literature supports these with other studies as well. Therefore being
the most important variable in determining tourist expenditure, I set nationality as a panel data
dependent variable in the estimation labeling as “country”.
8Country variable defines the nationalities of the visitors. Panel data is created at country level,
so that the impact of each country can be estimated on revenue generation increase. Since the
countries have different income levels, it is necessary to measure whether the visitors coming
from the different countries reflects on their contribution to tourism receipts. Additionally, in
a panel data setting country, dummies also take care of the distance between countries.
Therefore, country dummies have been created so that the nationality effect on the income per
8 Web site of TURKSTAT under “Analytical Framework, Concepts, Definitions, and Classifications” heading
nationality is the country name in the passport which visitors carry when departing from Turkey,
http://www.turkstat.gov.tr/PreTablo.do?alt_id=1072 under Analytical Framework, Concepts, Definitions, and Classifications (TURKSTAT, 2018)
24
capita can be estimated. The variable referred to as Country variable defines the nationalities
of the visitors. Panel data created on the country level so that the impact of each country can be
estimated on the revenue generation increase. Since the countries have different income levels,
it is necessary to measure whether the visitors coming from the different countries reflect on
the contribution of the tourism receipts. Additionally, in a panel data setting country dummies
also take care of the distance between countries. Therefore, country dummies have been created
so that nationality effect on the income per capita can be estimated. The variable is referred as
“country”. The full list of countries is given in the summary statistics in Appendix Tables A1,
A2, A3, and A4.
In the study, it is also necessary to question whether there are any other regional effects on the
results. For example, countries with higher income like Western European countries may have
an effect on higher revenue generation. Alternatively, neighboring countries can have a higher
total number of visitors due to reasons such as distance, ticket availability and prices, or visiting
Turkish relatives. In order to estimate and avoid such external effects, I create regional country
dummies, to find out whether there are such external effects of the regional influence on the
results.
Since it is one of the Strategy’s purposes to increase cultural, heritage and other types of tourism
rather than sea, sun and sand / mass tourism, departing visitors’ purpose of visit has been
included in the estimation. The variables are derived from the TURKSTAT data and are
grouped under: leisure, visiting friends and relatives, health, religious, shopping, business,
transit, education, and other.
As can be observed through Figure A1 in the Appendix, there has been an increasing trend
change in purpose of visit variables since 2012. However, the data in the TURKSTAT website
are not healthy enough to produce healthy results. For example, leisure category data in the
database are separate from cultural activities and sports activities for some dates or quarters,
whereas leisure, cultural and sports activities are grouped under one heading as “leisure, cultural
and sports activities” for the rest of the data. Likewise, business tourism data have a similar
type of compilation as well. Therefore, it is not possible to estimate separately whether cultural
tourism has made an improvement or not through this data. In Figure A1, the business travel
trend shows a sharp increase around 2009 and 2010 and a sharp decrease afterwards. The
business type of holiday, expected to be a very inelastic type of holiday, since the decision
25
makers are most of the times not the visitors themselves, is another indicator that the purpose
of visit data are not healthy.
Therefore, the holiday type (purpose of visit) is not included in the estimation.
Policy Variable: Studying the details of the Tourism Strategy of Turkey 2023 and the Action
Plan for 2013 with the durations of the arrangements, it is expected to evaluate the cultural
tourism arrangements starting in 2007 with 3 to 4 years’ duration, the structural break when the
results of the first phase targeting 2013 is expected to be completed around 2010 – 2011.
Therefore, the impacts of the Strategy on cultural tourism is expected to be after 2010. The
policy dummy variable in the estimation is created as of 2011 in case of any possible delays.
Alternatively, I make a second version of the estimation with the policy dummy variable as of
2010. In both cases, I find similar results.
26
4
METHODOLOGY
4.1 SAMPLE SIZE AND EMPIRICAL FRAMEWORK
There are total of 1,470 observations comprising 30 countries, each has 49 observations
(quarters) between the years 2006 and 2018. The data for 2018 is only for one quarter (winter).
The summary statistics of the variables are explained in Table 3.7 with observation numbers,
means, standard deviations, minimum and maximum values. Additionally, I attach summary
statistics detailed for each country in Appendix Table A1.
The panel data in this thesis has both time series and cross sectional parts. It means that I employ
the estimation of the data both between groups and time periods. The results can be fixed or
random. In this study, I choose to use the fixed effect estimation due to the fact that there can
be correlations between groups. This correlation may arise either between countries – for
example the increase in the total number of visitors from Germany may cause an increase in
the number of tourists from Austria. Another correlation may arise due to outside factors such
as oil price changes, exchange rate changes, and other economic or political reasons. These may
all have different impacts on countries – affecting some of them positively while affecting some
others negatively. Since it is difficult to control all of these factors and their impacts for all the
years in between, in this study the fixed effect panel data estimation method has been preferred.
Another thing which can affect the estimation is that there may be influences such as countries’
proximity, and tourists’ income level relative to the income level of the countries these tourists
come from. These influences are also highly related to the factors mentioned above. In order to
avoid such effects per country, I include country and regional dummies in the estimations.
Additionally, in order to avoid errors such as heteroskedasticity, correlation or other external
effects, I use cluster method in the analysis.
27