This is the accepted manuscript made available via CHORUS, the article has been published as:
Search for hadronic transition χ_{cJ}→η_{c}π^{+}π^{-}
and observation of χ_{cJ}→KK[over ¯]πππ
M. Ablikim et al. (BESIII Collaboration)
Phys. Rev. D 87, 012002 — Published 4 January 2013 DOI: 10.1103/PhysRevD.87.012002
Search for hadronic transition χcJ
→
η
cπ
+π
−and observation of
χ
cJ→
K ¯
Kπππ
M. Ablikim1, M. N. Achasov5, D. J. Ambrose39, F. F. An1, Q. An40, Z. H. An1, J. Z. Bai1, Y. Ban27, J. Becker2, J. V. Bennett17, M. Bertani18A, J. M. Bian38, E. Boger20,a,
O. Bondarenko21, I. Boyko20, R. A. Briere3, V. Bytev20, X. Cai1, O. Cakir35A, A. Calcaterra18A, G. F. Cao1, S. A. Cetin35B, J. F. Chang1, G. Chelkov20,a, G. Chen1, H. S. Chen1, J. C. Chen1,
M. L. Chen1, S. J. Chen25, Y. B. Chen1, H. P. Cheng14, Y. P. Chu1, D. Cronin-Hennessy38, H. L. Dai1, J. P. Dai1, D. Dedovich20, Z. Y. Deng1, A. Denig19, I. Denysenko20,b,
M. Destefanis43A,43C, W. M. Ding29, Y. Ding23, L. Y. Dong1, M. Y. Dong1, S. X. Du46, J. Fang1, S. S. Fang1, L. Fava43B,43C, F. Feldbauer2, C. Q. Feng40, R. B. Ferroli18A, C. D. Fu1, J. L. Fu25,
Y. Gao34, C. Geng40, K. Goetzen7, W. X. Gong1, W. Gradl19, M. Greco43A,43C, M. H. Gu1, Y. T. Gu9, Y. H. Guan6, A. Q. Guo26, L. B. Guo24, Y.P. Guo26, Y. L. Han1, F. A. Harris37, K. L. He1, M. He1, Z. Y. He26, T. Held2, Y. K. Heng1, Z. L. Hou1, H. M. Hu1, J. F. Hu6, T. Hu1,
G. M. Huang15, J. S. Huang12, X. T. Huang29, Y. P. Huang1, T. Hussain42, C. S. Ji40, Q. Ji1, X. B. Ji1, X. L. Ji1, L. L. Jiang1, X. S. Jiang1, J. B. Jiao29, Z. Jiao14, D. P. Jin1, S. Jin1, F. F. Jing34, N. Kalantar-Nayestanaki21, M. Kavatsyuk21, W. Kuehn36, W. Lai1, J. S. Lange36, C. H. Li1, Cheng Li40, Cui Li40, D. M. Li46, F. Li1, G. Li1, H. B. Li1, J. C. Li1, K. Li10, Lei Li1, Q. J. Li1, S. L. Li1, W. D. Li1, W. G. Li1, X. L. Li29, X. N. Li1, X. Q. Li26, X. R. Li28, Z. B. Li33,
H. Liang40, Y. F. Liang31, Y. T. Liang36, G. R. Liao34, X. T. Liao1, B. J. Liu1, C. L. Liu3, C. X. Liu1, C. Y. Liu1, F. H. Liu30, Fang Liu1, Feng Liu15, H. Liu1, H. B. Liu6, H. H. Liu13, H. M. Liu1, H. W. Liu1, J. P. Liu44, K. Y. Liu23, Kai Liu6, P. L. Liu29, Q. Liu6, S. B. Liu40, X. Liu22, X. H. Liu1, Y. B. Liu26, Z. A. Liu1, Zhiqiang Liu1, Zhiqing Liu1, H. Loehner21, G. R. Lu12, H. J. Lu14, J. G. Lu1, Q. W. Lu30, X. R. Lu6, Y. P. Lu1, C. L. Luo24, M. X. Luo45,
T. Luo37, X. L. Luo1, M. Lv1, C. L. Ma6, F. C. Ma23, H. L. Ma1, Q. M. Ma1, S. Ma1, T. Ma1, X. Y. Ma1, Y. Ma11, F. E. Maas11, M. Maggiora43A,43C, Q. A. Malik42, Y. J. Mao27, Z. P. Mao1,
J. G. Messchendorp21, J. Min1, T. J. Min1, R. E. Mitchell17, X. H. Mo1, C. Morales Morales11, C. Motzko2, N. Yu. Muchnoi5, H. Muramatsu39, Y. Nefedov20, C. Nicholson6,
I. B. Nikolaev5, Z. Ning1, S. L. Olsen28, Q. Ouyang1, S. Pacetti18B, J. W. Park28, M. Pelizaeus37, H. P. Peng40, K. Peters7, J. L. Ping24, R. G. Ping1, R. Poling38, E. Prencipe19, M. Qi25,
S. Qian1, C. F. Qiao6, X. S. Qin1, Y. Qin27, Z. H. Qin1, J. F. Qiu1, K. H. Rashid42, G. Rong1, X. D. Ruan9, A. Sarantsev20,c, B. D. Schaefer17, J. Schulze2, M. Shao40, C. P. Shen37,d,
X. Y. Shen1, H. Y. Sheng1, M. R. Shepherd17, W. M. Song1, X. Y. Song1, S. Spataro43A,43C, B. Spruck36, D. H. Sun1, G. X. Sun1, J. F. Sun12, S. S. Sun1, Y. J. Sun40, Y. Z. Sun1, Z. J. Sun1,
Z. T. Sun40, C. J. Tang31, X. Tang1, I. Tapan35C, E. H. Thorndike39, D. Toth38, M. Ullrich36, G. S. Varner37, B. Wang9, B. Q. Wang27, K. Wang1, L. L. Wang4, L. S. Wang1, M. Wang29,
P. Wang1, P. L. Wang1, Q. Wang1, Q. J. Wang1, S. G. Wang27, X. L. Wang40, Y. D. Wang40, Y. F. Wang1, Y. Q. Wang29, Z. Wang1, Z. G. Wang1, Z. Y. Wang1, D. H. Wei8, P. Weidenkaff19,
Q. G. Wen40, S. P. Wen1, M. Werner36, U. Wiedner2, L. H. Wu1, N. Wu1, S. X. Wu40, W. Wu26, Z. Wu1, L. G. Xia34, Z. J. Xiao24, Y. G. Xie1, Q. L. Xiu1, G. F. Xu1, G. M. Xu27,
H. Xu1, Q. J. Xu10, X. P. Xu32, Z. R. Xu40, F. Xue15, Z. Xue1, L. Yan40, W. B. Yan40, Y. H. Yan16, H. X. Yang1, Y. Yang15, Y. X. Yang8, H. Ye1, M. Ye1, M. H. Ye4, B. X. Yu1, C. X. Yu26, J. S. Yu22, S. P. Yu29, C. Z. Yuan1, Y. Yuan1, A. A. Zafar42, A. Zallo18A, Y. Zeng16,
B. X. Zhang1, B. Y. Zhang1, C. C. Zhang1, D. H. Zhang1, H. H. Zhang33, H. Y. Zhang1,
J. Q. Zhang1, J. W. Zhang1, J. Y. Zhang1, J. Z. Zhang1, S. H. Zhang1, X. J. Zhang1, X. Y. Zhang29, Y. Zhang1, Y. H. Zhang1, Y. S. Zhang9, Z. P. Zhang40, Z. Y. Zhang44, G. Zhao1,
H. S. Zhao1, J. W. Zhao1, K. X. Zhao24, Lei Zhao40, Ling Zhao1, M. G. Zhao26, Q. Zhao1, S. J. Zhao46, T. C. Zhao1, X. H. Zhao25, Y. B. Zhao1, Z. G. Zhao40, A. Zhemchugov20,a,
B. Zheng41, J. P. Zheng1, Y. H. Zheng6, B. Zhong1, J. Zhong2, L. Zhou1, X. K. Zhou6, X. R. Zhou40, C. Zhu1, K. Zhu1, K. J. Zhu1, S. H. Zhu1, X. L. Zhu34, X. W. Zhu1,
Y. C. Zhu40, Y. M. Zhu26, Y. S. Zhu1, Z. A. Zhu1, J. Zhuang1, B. S. Zou1, J. H. Zou1
(BESIII Collaboration)
1 Institute of High Energy Physics, Beijing 100049, P. R. China 2 Bochum Ruhr-University, 44780 Bochum, Germany 3 Carnegie Mellon University, Pittsburgh, PA 15213, USA
4 China Center of Advanced Science and Technology, Beijing 100190, P. R. China 5 G.I. Budker Institute of Nuclear Physics SB RAS (BINP), Novosibirsk 630090, Russia
7 GSI Helmholtzcentre for Heavy Ion Research GmbH, D-64291 Darmstadt, Germany 8 Guangxi Normal University, Guilin 541004, P. R. China
9 GuangXi University, Nanning 530004,P.R.China
10 Hangzhou Normal University, Hangzhou 310036, P. R. China 11 Helmholtz Institute Mainz, J.J. Becherweg 45,D 55099 Mainz,Germany
12 Henan Normal University, Xinxiang 453007, P. R. China
13 Henan University of Science and Technology, Luoyang 471003, P. R. China 14 Huangshan College, Huangshan 245000, P. R. China
15 Huazhong Normal University, Wuhan 430079, P. R. China 16 Hunan University, Changsha 410082, P. R. China 17 Indiana University, Bloomington, Indiana 47405, USA 18 (A)INFN Laboratori Nazionali di Frascati, Frascati, Italy;
(B)INFN and University of Perugia, I-06100, Perugia, Italy
19 Johannes Gutenberg University of Mainz,
Johann-Joachim-Becher-Weg 45, 55099 Mainz, Germany
20 Joint Institute for Nuclear Research, 141980 Dubna, Russia 21 KVI/University of Groningen, 9747 AA Groningen, The Netherlands
22 Lanzhou University, Lanzhou 730000, P. R. China 23 Liaoning University, Shenyang 110036, P. R. China 24 Nanjing Normal University, Nanjing 210046, P. R. China
25 Nanjing University, Nanjing 210093, P. R. China 26 Nankai University, Tianjin 300071, P. R. China
27 Peking University, Beijing 100871, P. R. China 28 Seoul National University, Seoul, 151-747 Korea 29 Shandong University, Jinan 250100, P. R. China
30 Shanxi University, Taiyuan 030006, P. R. China 31 Sichuan University, Chengdu 610064, P. R. China
32 Soochow University, Suzhou 215006, P. R. China 33 Sun Yat-Sen University, Guangzhou 510275, P. R. China
34 Tsinghua University, Beijing 100084, P. R. China 35 (A)Ankara University, Ankara, Turkey; (B)Dogus University,
Istanbul, Turkey; (C)Uludag University, Bursa, Turkey
36 Universitaet Giessen, 35392 Giessen, Germany 37 University of Hawaii, Honolulu, Hawaii 96822, USA 38 University of Minnesota, Minneapolis, MN 55455, USA 39 University of Rochester, Rochester, New York 14627, USA
40 University of Science and Technology of China, Hefei 230026, P. R. China 41 University of South China, Hengyang 421001, P. R. China
42 University of the Punjab, Lahore-54590, Pakistan 43 (A)University of Turin, Turin, Italy; (B)University of
Eastern Piedmont, Alessandria, Italy; (C)INFN, Turin, Italy
44 Wuhan University, Wuhan 430072, P. R. China 45 Zhejiang University, Hangzhou 310027, P. R. China 46 Zhengzhou University, Zhengzhou 450001, P. R. China
a also at the Moscow Institute of Physics and Technology, Moscow, Russia b on leave from the Bogolyubov Institute for Theoretical Physics, Kiev, Ukraine
c also at the PNPI, Gatchina, Russia d now at Nagoya University, Nagoya, Japan
Abstract
Hadronic transitions of χcJ → ηcπ+π− (J = 0, 1, 2) are searched for using a sample of 1.06 ×
108 ψ(3686) events collected with the BESIII detector at the BEPCII storage ring. The ηc is
reconstructed with K0
SK±π∓and K+K−π0final states. No signals are observed in any of the three
χcJ states in either ηc decay mode. At the 90% confidence level, the upper limits are determined
to be B(χc0 → ηcπ+π−) < 0.07%, B(χc1 → ηcπ+π−) < 0.32%, and B(χc2 → ηcπ+π−) < 0.54%.
The upper limit of B(χc1 → ηcπ+π−) is lower than the existing theoretical prediction by almost an
order of magnitude. The branching fractions of χcJ → KS0K±π∓π+π−, K+K−π+π−π0, ωK+K−
and φπ+π−π0 (J = 0, 1, 2) are measured for the first time.
I. INTRODUCTION
Heavy quarkonia, both c¯c and b¯b bound states, have provided good laboratories for the study of the strong interaction [1, 2]. For the hadronic transitions between the heavy quarko-nium states, Yan [3] characterized it as the emission of two soft gluons from the heavy quarks and the conversion of gluons into light hadrons. Based on this scheme, a series of decay rates, such as the E1-E1 hadronic transition, E1-M1 hadronic transition, M1-M1 hadronic transi-tion have been calculated [4, 5]. It has been shown that the multipole expansion can make quite successful predictions for many hadronic transitions between the heavy quarkonia [1, 6]. However, most of these studies are for the transitions among the 3S
1 states; the hadronic
transitions of3P
J states are seldom explored. Using a sample of Υ(3S), CLEO measured for
the first time the transition rate of P -wave bottomonium χbJ(2P ) → χbJ(1P )ππ [7], and the
results are consistent with the theoretical predictions [5]. For the hadronic transition of the P -wave charmonium states, there is only an upper limit of 2.2% at the 90% confidence level (C.L.) on the χc2 → ηcπ+π− transition rate recently reported by the BaBar experiment [8].
The process χc1 → ηcππ, which is dominated by an E1-M1 transition, is calculated in the
multipole expansion formalism, and a transition rate B(χc1 → ηcππ) = (2.72 ± 0.39)% is
predicted [9], while the process χc0→ ηcπ+π− is suppressed by spin-parity conservation.
In this article, we search for χcJ → ηcπ+π− with ηc decays into KS0K±π∓ and K+K−π0,
where the K0
S is reconstructed in π+π− and π0 in γγ final states. We also report the first
measurement of the branching fractions of χcJ → KS0K±π∓π+π−, K+K−π+π−π0, ωK+K−,
and φπ+π−π0. Here the χ
cJ originates from the E1 transition ψ(3686) → γχcJ.
II. THE EXPERIMENT AND DATA SETS
The data sample for this analysis consists of 1.06 × 10⁸ events produced at the peak of
the ψ(3686) resonance [10]; an additional 42 pb−1 of data were collected at a center-of-mass
energy of √s=3.65 GeV to determine non-resonant continuum background contributions. The data are accumulated with the BESIII detector operated at the BEPCII e+e− collider.
The BESIII detector, described in detail in Ref. [11], has an effective geometrical accep-tance of 93% of 4π. It contains a small cell helium-based main drift chamber (MDC) which provides momentum measurements of charged particles; a time-of-flight system (TOF) based
on plastic scintillator which helps to identify charged particles; an electromagnetic calorime-ter (EMC) made of CsI (Tl) crystals which is used to measure the energies of photons and provide trigger signals; and a muon system (MUC) made of Resistive Plate Chambers (RPC). The resolution of the charged particles is 0.5% at 1 GeV/c in a 1 Tesla magnetic field. The energy loss (dE/dx) measurement provided by the MDC has a resolution better than 6% for electrons from Bhabha scattering. The photon energy resolution can reach 2.5% (5%) at 1 GeV in the barrel (endcaps) of the EMC. And the time resolution of TOF is 80 ps in the barrel and 110 ps in the endcaps.
Monte Carlo (MC) simulated events are used to determine the detection efficiency, op-timize the selection criteria, and study the possible backgrounds. The simulation of the BESIII detector is geant4 [12] based, where the interactions of the particles with the de-tector material are simulated. The ψ(3686) resonance is produced with kkmc [13], while the subsequent decays are generated with EvtGen [14]. The study of the background is based on a sample of 108 ψ(3686) inclusive decays which are generated with known branch-ing fractions taken from the Particle Data Group (PDG) [15], or with lundcharm [16] for the unmeasured decays.
III. EVENT SELECTION
A charged track should have good quality in the track fitting and be within the angle coverage of the MDC, | cos θ| < 0.93. Each charged track (excludes those from K0
S decays)
is required to be within 1 cm of the e+e− annihilation interaction point (IP) transverse to
the beam line and within 10 cm of the IP along the beam axis. Charged-particle iden-tification (PID) is based on combining the dE/dx and TOF information in the variable χ2
PID(i) = (
dE/dxmeasured−dE/dxexpected
σdE/dx )
2+ (TOFmeasured−TOFexpected
σTOF )
2. The values χ2
PID(i) and the
corresponding confidence levels ProbPID(i) are calculated for each charged track for each
particle hypothesis i (pion, kaon, or proton).
Photons are reconstructed from isolated showers in the EMC which are at least 20 degrees away from any of the charged tracks. In order to improve the reconstruction efficiency and the energy resolution, the energy deposited in the nearby TOF counter is included. Photon candidates are required to have the energy greater than 25 MeV in the EMC barrel region (| cos θ| < 0.8), while in the EMC endcap region (0.86 < | cos θ| < 0.92), the energy threshold
requirement is increased to 50 MeV. EMC timing requirements are used to suppress noise and energy deposits unrelated to the event.
K0
S candidates are reconstructed from secondary vertex fits to all the charged-track pairs
in an event (assume the tracks to be π). The combination with the best fit quality is kept, and the K0
S candidate must have an invariant mass within 7 MeV/c2 of the KS0 nominal mass and
the secondary vertex be at least 0.5 cm away from the IP. The reconstructed K0
S information
is used as input for the subsequent kinematic fit. The π0 candidates are reconstructed from
pairs of photons with an invariant mass in the range 0.120 GeV/c2 < M(γγ) < 0.145 GeV/c2.
In selecting ψ(3686) → γK0
SK±π∓π+π−, a candidate event should have at least six
charged tracks and at least one photon. After K0
S selection, the event should have
ex-actly four additional charged tracks with zero net charge. While in selecting ψ(3686) → γK+K−π+π−π0, a candidate event should have four charged tracks with zero net charge
and at least three photons. The γK0
SK±π∓π+π− (γK+K−π+π−π0) candidate is then
sub-jected to a four-constraint (4C) kinematic fit provided by four-momentum conservation to reduce background and improve the mass resolution. To determine the species of the final state particles and select the best photons when additional photons (and π0 candidates)
are found in an event, the combination with the minimum value of χ2 is retained. Here
χ2 = χ2 4C+
P4
j=1χ2PID(j) is the sum of the chi-square from the 4C kinematic fit (χ24C) and
that of PID. Events with χ2
4C < 50 are kept as γKS0K±π∓π+π− (γK+K−π+π−π0)
candi-dates.
There is substantial background from ψ(3686) → X + J/ψ decays. The ψ(3686) → π+π−J/ψ events are removed by requiring the recoil mass of any π+π− pair to be outside
of a ±3σ window around the J/ψ nominal mass, where σ is the resolution of the π+π−
recoil mass. The ψ(3686) → ηJ/ψ, η → γπ+π− events are rejected if 0.535 GeV/c2 <
M(γπ+π−) < 0.555 GeV/c2. To reject background with one more photon than the signal
events (γγK0
SK±π∓π+π− or γγK+K−π+π−π0), χ24C > 10 is required when a 4C
kine-matic fit to γγK0
SK±π∓π+π− or γγK+K−π+π−π0 is applied to the event; and to suppress
ψ(3686) → π0π0J/ψ, J/ψ → K+K−π+π− background, M(K+K−π+π−) > 3.125 GeV/c2
or M(K+K−π+π−) < 3.095 GeV/c2 is required.
In the measurement of B(χcJ → K+K−π+π−π0), the contributions from intermediate
states with narrow resonances such as η, ω, and φ are excluded. Events from χcJ → ηK+K−,
mη| > 15 MeV/c2, |mπ+π−π0 − mω| > 40 MeV/c2, |mπ+π−π0 − mφ| > 15 MeV/c2, and
|mK+K−− mφ| > 15 MeV/c2. The contribution from χcJ → φφ, φ → K+K−, φ → π+π−π0
events is also removed by these requirements.
In the measurements of B(χcJ → ηcπ+π−), B(χcJ → ηK+K−), B(χcJ → ωK+K−),
B(χcJ → φK+K−), and B(χcJ → φπ+π−π0), the signal regions of χc0, χc1, χc2, and the mass
region of ηc are defined as [3.38, 3.45] GeV/c2, [3.48, 3.54] GeV/c2, [3.54, 3.60] GeV/c2,
and [2.70, 3.20] GeV/c2, respectively.
IV. DATA ANALYSIS
A. χcJ →KS0K±π∓π+π− and χcJ →K+K−π+π−π0
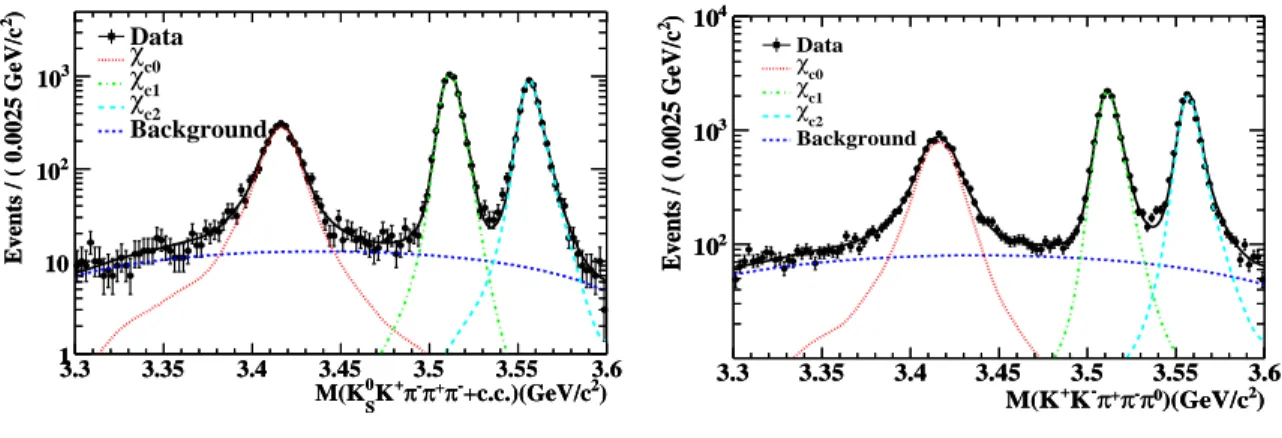
After the above selection, the invariant mass distributions of the hadron system are shown in Fig. 1, and clear χcJ signals are observed with very low background level in the two decay
modes. ) 2 +c.c.)(GeV/c -π + π -π + K 0 S M(K 3.3 3.35 3.4 3.45 3.5 3.55 3.6 ) 2 Events / ( 0.0025 GeV/c 1 10 2 10 3 10 ) 2 +c.c.)(GeV/c -π + π -π + K 0 S M(K 3.3 3.35 3.4 3.45 3.5 3.55 3.6 ) 2 Events / ( 0.0025 GeV/c 1 10 2 10 3 10 Data c0 χ c1 χ c2 χ Background ) 2 )(GeV/c 0 π -π + π -K + M(K 3.3 3.35 3.4 3.45 3.5 3.55 3.6 ) 2 Events / ( 0.0025 GeV/c 2 10 3 10 4 10 ) 2 )(GeV/c 0 π -π + π -K + M(K 3.3 3.35 3.4 3.45 3.5 3.55 3.6 ) 2 Events / ( 0.0025 GeV/c 2 10 3 10 4 10 Data c0 χ c1 χ c2 χ Background
FIG. 1: Invariant mass spectrum of K0
SK±π∓π+π− (left panel) and K+K−π+π−π0 (right panel),
together with the best fit results. The points with error bars are data, and the solid lines are the total fit results. The χc0, χc1, and χc2 signals are shown as dotted lines, dash-dotted lines, and
long-dashed lines, respectively; the backgrounds are in dashed lines.
Using the inclusive MC events sample, the potential backgrounds from the ψ(3686) decays which may contaminate χcJ → KS0K±π∓π+π− (χcJ → K+K−π+π−π0) are
es-timated. Events from ψ(3686) → γχcJ, χcJ → KS0KS0π+π− and χc0 → KS0KS0K+K−
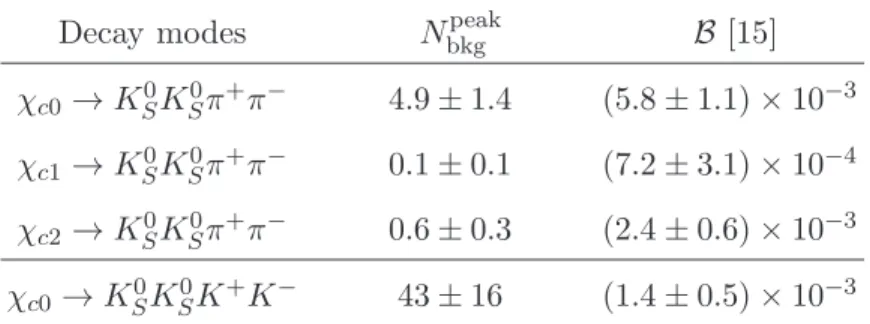
from these peaking backgrounds are estimated using the detection efficiencies determined from the MC simulations and the corresponding branching fractions from previous measure-ments [15], and then subtracted from the signal yield. These background events after final event selection are listed in Table I and II; the errors in the numbers of events are from the uncertainties of the detection efficiency and branching fractions. The other backgrounds are composed of dozens of decay modes and smoothly distributed in the full mass region ([3.3, 3.6] GeV/c2); the contribution of this kind of background can be represented by the
smooth background term in the fit.
TABLE I: The number of remanent peaking background events (Nbkgpeak) in χcJ → KS0K±π∓π+π−
after final event selection. The branching fractions (B) are taken from PDG [15]. Decay modes Nbkgpeak B [15]
χc0→ KS0KS0π+π− 4.9 ± 1.4 (5.8 ± 1.1) × 10−3
χc1→ KS0KS0π+π− 0.1 ± 0.1 (7.2 ± 3.1) × 10−4
χc2→ KS0KS0π+π− 0.6 ± 0.3 (2.4 ± 0.6) × 10−3
χc0→ KS0KS0K+K− 43 ± 16 (1.4 ± 0.5) × 10−3
TABLE II: The number of remanent peaking background events (Nbkgpeak) in χcJ → K+K−π+π−π0
after final event selection. The branching fractions (B) are taken from PDG [15]. Decay modes Nbkgpeak B [15]
χc0→ KS0K±π∓π0 124 ± 19 12× (2.52 ± 0.34) × 10−2
χc1→ KS0K±π∓π0 39.0 ± 9.1 12 × (9.0 ± 1.5) × 10−3
χc2→ KS0K±π∓π0 52.5 ± 9.3 12× (1.51 ± 0.22) × 10−2
Data taken at √s = 3.65 GeV are used to estimate backgrounds from the continuum process e+e−
→ q¯q. This kind of background is found to be small and uniformly distributed in the full mass region of interest in both decay modes, so the contribution can be represented by the smooth background term in the fit.
) 2 )(GeV/c 0 π -π + π M( 0.5 0.6 0.7 0.8 0.9 1 1.1 ) 2 Events / ( 0.01 GeV/c 0 100 200 300 400 500 ) 2 )(GeV/c 0 π -π + π M( 0.5 0.6 0.7 0.8 0.9 1 1.1 ) 2 Events / ( 0.01 GeV/c 0 100 200 300 400 500 Data η ω φ Background ) 2 )(GeV/c -K + M(K 0.99 1 1.01 1.02 1.03 1.04 1.05 1.06 1.07 1.08 1.09 ) 2 Events / ( 0.0025 GeV/c 0 20 40 60 80 100 120 140 160 180 200 ) 2 )(GeV/c -K + M(K 0.99 1 1.01 1.02 1.03 1.04 1.05 1.06 1.07 1.08 1.09 ) 2 Events / ( 0.0025 GeV/c 0 20 40 60 80 100 120 140 160 180 200 Data signal Background ) 2 )(GeV/c 0 π -π + π M( 0.5 0.6 0.7 0.8 0.9 1 1.1 ) 2 Events / ( 0.01 GeV/c 0 50 100 150 200 250 ) 2 )(GeV/c 0 π -π + π M( 0.5 0.6 0.7 0.8 0.9 1 1.1 ) 2 Events / ( 0.01 GeV/c 0 50 100 150 200 250 Data η ω φ Background ) 2 )(GeV/c -K + M(K 0.99 1 1.01 1.02 1.03 1.04 1.05 1.06 1.07 1.08 1.09 ) 2 Events / ( 0.0025 GeV/c 0 20 40 60 80 100 120 140 ) 2 )(GeV/c -K + M(K 0.99 1 1.01 1.02 1.03 1.04 1.05 1.06 1.07 1.08 1.09 ) 2 Events / ( 0.0025 GeV/c 0 20 40 60 80 100 120 140 Data signal Background ) 2 )(GeV/c 0 π -π + π M( 0.5 0.6 0.7 0.8 0.9 1 1.1 ) 2 Events / ( 0.01 GeV/c 0 20 40 60 80 100 120 140 160 180 200 ) 2 )(GeV/c 0 π -π + π M( 0.5 0.6 0.7 0.8 0.9 1 1.1 ) 2 Events / ( 0.01 GeV/c 0 20 40 60 80 100 120 140 160 180 200 Data η ω φ Background ) 2 )(GeV/c -K + M(K 0.99 1 1.01 1.02 1.03 1.04 1.05 1.06 1.07 1.08 1.09 ) 2 Events / ( 0.0025 GeV/c 0 20 40 60 80 100 120 140 ) 2 )(GeV/c -K + M(K 0.99 1 1.01 1.02 1.03 1.04 1.05 1.06 1.07 1.08 1.09 ) 2 Events / ( 0.0025 GeV/c 0 20 40 60 80 100 120 140 Data signal Background
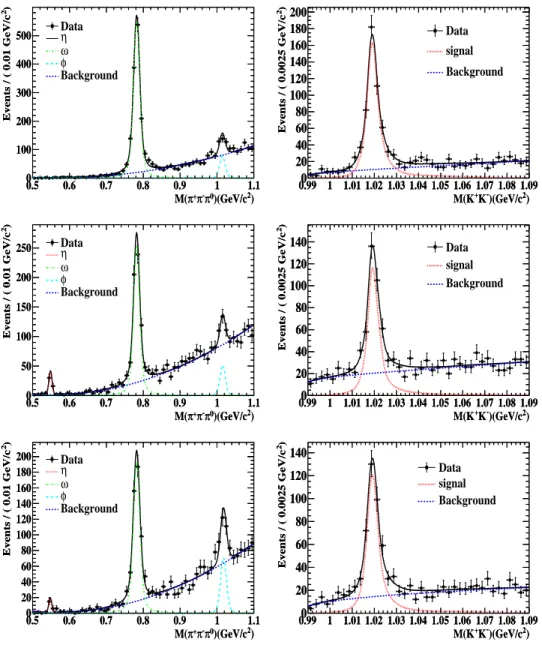
FIG. 2: Fits to the invariant mass spectrum of π+π−π0 (left panels) and K+K− (right panels)
in three χcJ mass region after χcJ → φφ, φ → K+K−, φ → π+π−π0 were rejected. From top to
bottom are in χc0 mass region, χc1 mass region, and χc2 mass region, respectively.
K0
SK±π∓π+π− (K+K−π+π−π0) to extract the numbers of χcJ events in Fig. 1. The χcJ
signals are described by the corresponding MC simulated signal shape convolved with a Gaussian function G(µ, σ) to take into account the difference in the mass scale and the mass resolution between data and MC simulation. The means (µ) and the standard devi-ations (σ) of the Gaussian functions are floated parameters in the fit. In the generation of the χc0 MC events, the E1 radiative transition factor Eγ3 is included, where Eγ is the
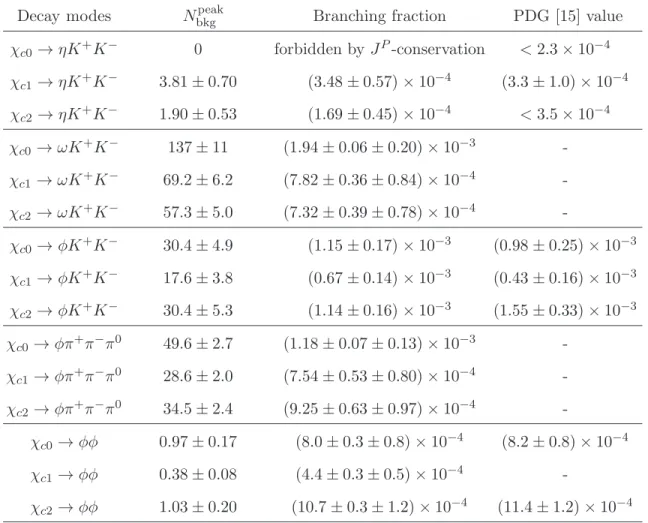
TABLE III: The number of background events (Nbkgpeak) remained in χcJ → K+K−π+π−π0 from
modes with narrow intermediate states. The branching fraction of χcJ → φφ is taken from the
BESIII measurement [19] with both statistical and systematic errors; the other branching fractions are measured in this analysis. We also list PDG values [15] in the last column for comparison.
Decay modes Nbkgpeak Branching fraction PDG [15] value χc0→ ηK+K− 0 forbidden by JP-conservation < 2.3 × 10⁻⁴ χc1→ ηK+K− 3.81 ± 0.70 (3.48 ± 0.57) × 10−4 (3.3 ± 1.0) × 10−4 χc2→ ηK+K− 1.90 ± 0.53 (1.69 ± 0.45) × 10−4 < 3.5 × 10⁻⁴ χc0→ ωK+K− 137 ± 11 (1.94 ± 0.06 ± 0.20) × 10−3 -χc1→ ωK+K− 69.2 ± 6.2 (7.82 ± 0.36 ± 0.84) × 10−4 -χc2→ ωK+K− 57.3 ± 5.0 (7.32 ± 0.39 ± 0.78) × 10−4 -χc0→ φK+K− 30.4 ± 4.9 (1.15 ± 0.17) × 10−3 (0.98 ± 0.25) × 10−3 χc1→ φK+K− 17.6 ± 3.8 (0.67 ± 0.14) × 10−3 (0.43 ± 0.16) × 10−3 χc2→ φK+K− 30.4 ± 5.3 (1.14 ± 0.16) × 10−3 (1.55 ± 0.33) × 10−3 χc0→ φπ+π−π0 49.6 ± 2.7 (1.18 ± 0.07 ± 0.13) × 10−3 -χc1→ φπ+π−π0 28.6 ± 2.0 (7.54 ± 0.53 ± 0.80) × 10−4 -χc2→ φπ+π−π0 34.5 ± 2.4 (9.25 ± 0.63 ± 0.97) × 10−4 -χc0 → φφ 0.97 ± 0.17 (8.0 ± 0.3 ± 0.8) × 10−4 (8.2 ± 0.8) × 10−4 χc1 → φφ 0.38 ± 0.08 (4.4 ± 0.3 ± 0.5) × 10−4 -χc2 → φφ 1.03 ± 0.20 (10.7 ± 0.3 ± 1.2) × 10−4 (11.4 ± 1.2) × 10−4
energy of the radiative photon in the ψ(3686) rest frame. To damp the diverging tail due to the E3
γ dependence, a damping function
E2 0
EγE0+(Eγ−E0)2 used by KEDR [18] is introduced,
where E0 = (m2ψ(3686)− m2χc0)/2mψ(3686). The backgrounds are described by a second-order
Chebyshev polynomial in both decay modes. The fit to the invariant mass spectrum of K0
SK±π∓π+π− yields 2837 ± 64, 5180 ± 75, and
4560 ± 71 signal events for χc0, χc1, and χc2, respectively; while the fit to the K+K−π+π−π0
modes yields 9372±130, 12415±126, and 11366±123 events for χc0, χc1, and χc2, respectively.
φK+K−, and χ
cJ → φπ+π−π0, the branching fractions of these decays are measured using
the sample of 1.06 × 10⁸ ψ(3686) events. The identifications of η, ω, and φ resonances are
similar to those used in Refs. [19, 20]. The fits to the invariant mass spectrum of π+π−π0
and K+K−in the three χ
cJ signal regions are shown in Fig. 2. Similar to the χcJ signals, the
η, ω, and φ signals are also described with the corresponding MC simulated signal shapes convolved with a Gaussian function. The backgrounds in the fits to the invariant mass spectra of π+π−π0 are described by a second-order Chebyshev polynomial, while those in
the fits to the invariant mass spectra of K+K− are described by (m − m
t)c · e−dm, where
mt is the mass threshold of K+K−, c and d are free parameters. The results are listed in
Table III. The first errors are statistical and the second ones are systematic. The sources of the systematic errors are similar to those in the measurement of B(χcJ → K+K−π+π−π0), as
will be shown in Sect. V. The branching fractions of χcJ → ωK+K−and χcJ → φπ+π−π0are
measured for the first time, and those of other modes from this measurement are consistent within errors with the known PDG values [15] when available. The expected remaining events from these decay channels are also listed in Table III and will be subtracted from the signal yields from the best fits.
B. χcJ →ηcπ+π−
The invariant mass spectra of K0
SK±π∓(K+K−π0) with KS0K±π∓π+π−(K+K−π+π−π0)
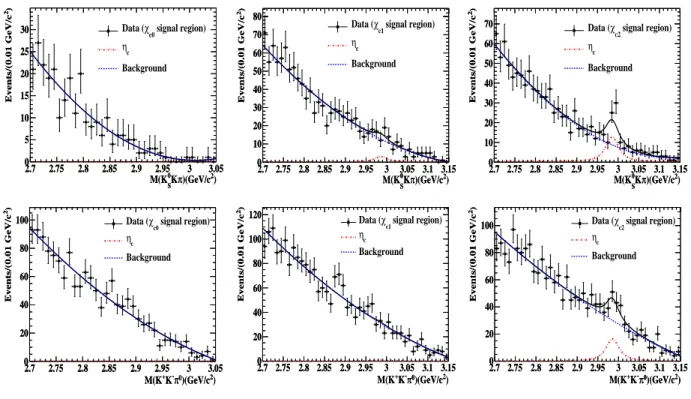
in the three χcJ signal regions are shown in Fig. 3. In both decay modes, there are no
significant ηc signal in χc0 and χc1 decay; the ηc signal observed in χc2 decays is found to
be mainly from the remaining ψ(3686) → π+π−J/ψ, J/ψ → γη
c, ηc → KS0K±π∓ (ηc →
K+K−π0), as described below.
The potential backgrounds from ψ(3686) decays are investigated with the inclusive
MC events. The dominant backgrounds are the irreducible ψ(3686) → γχcJ, χcJ →
K0
SK±π∓π+π− (χcJ → K+K−π+π−π0) events. These events have the same final states
as the signal events but K0
SK±π∓ (K+K−π0) are not from the decay of ηc. In the χc2signal
region, the energy of the transition photon in J/ψ → γηc in the peaking background mode
described above is very close to the energy of the transition photon in ψ(3686) → γχc2,
and the final states are the same as the signal events. These background cannot be further suppressed without hurting the sensitivity significantly, so we measure its contribution and
) 2 )(GeV/c π K 0 S M(K 2.7 2.75 2.8 2.85 2.9 2.95 3 3.05 ) 2 Events/(0.01 GeV/c 0 5 10 15 20 25 30 ) 2 )(GeV/c π K 0 S M(K 2.7 2.75 2.8 2.85 2.9 2.95 3 3.05 ) 2 Events/(0.01 GeV/c 0 5 10 15 20 25 30 signal region) c0 χ Data ( c η Background ) 2 )(GeV/c π K 0 S M(K 2.7 2.75 2.8 2.85 2.9 2.95 3 3.05 3.1 3.15 ) 2 Events/(0.01 GeV/c 0 10 20 30 40 50 60 70 80 ) 2 )(GeV/c π K 0 S M(K 2.7 2.75 2.8 2.85 2.9 2.95 3 3.05 3.1 3.15 ) 2 Events/(0.01 GeV/c 0 10 20 30 40 50 60 70 80 signal region) c1 χ Data ( c η Background ) 2 )(GeV/c π K 0 S M(K 2.7 2.75 2.8 2.85 2.9 2.95 3 3.05 3.1 3.15 ) 2 Events/(0.01 GeV/c 0 10 20 30 40 50 60 70 ) 2 )(GeV/c π K 0 S M(K 2.7 2.75 2.8 2.85 2.9 2.95 3 3.05 3.1 3.15 ) 2 Events/(0.01 GeV/c 0 10 20 30 40 50 60 70 signal region) c2 χ Data ( c η Background ) 2 )(GeV/c 0 π -K + M(K 2.7 2.75 2.8 2.85 2.9 2.95 3 3.05 ) 2 Events/(0.01 GeV/c 0 20 40 60 80 100 ) 2 )(GeV/c 0 π -K + M(K 2.7 2.75 2.8 2.85 2.9 2.95 3 3.05 ) 2 Events/(0.01 GeV/c 0 20 40 60 80 100 signal region) c0 χ Data ( c η Background ) 2 )(GeV/c 0 π -K + M(K 2.7 2.75 2.8 2.85 2.9 2.95 3 3.05 3.1 3.15 ) 2 Events/(0.01 GeV/c 0 20 40 60 80 100 120 ) 2 )(GeV/c 0 π -K + M(K 2.7 2.75 2.8 2.85 2.9 2.95 3 3.05 3.1 3.15 ) 2 Events/(0.01 GeV/c 0 20 40 60 80 100 120 signal region) c1 χ Data ( c η Background ) 2 )(GeV/c 0 π -K + M(K 2.7 2.75 2.8 2.85 2.9 2.95 3 3.05 3.1 3.15 ) 2 Events/(0.01 GeV/c 0 20 40 60 80 100 ) 2 )(GeV/c 0 π -K + M(K 2.7 2.75 2.8 2.85 2.9 2.95 3 3.05 3.1 3.15 ) 2 Events/(0.01 GeV/c 0 20 40 60 80
100 Data (χc2 signal region)
c η Background
FIG. 3: Invariant mass spectra of KS0K±π∓ (top row) and K+K−π0 (bottom row) with K ¯Kπππ
in χc0(left panel), χc1(middle panel), and χc2 (right panel) signal regions and the fit results. Dots
with error bars are data; the solid lines are the total results from the best fits to the invariant mass spectrum. The ηc signals are shown in dash-dotted lines (in χc2 mass region, the contribution from
the peaking background is not removed.); the backgrounds as dashed lines.
subtract it from the signal yield from the fit below. The other backgrounds are composed of dozens of decay channels, each with a small contribution. The dominant backgrounds and the other backgrounds contribute a smooth component in the ηc mass region, so these
backgrounds are described by a smooth term in the fit as shown in Fig. 3. In the χc2 case,
the peaking background has the same final state and similar kinematics as the signal events, so we use the same line-shape to describe both of them. Data taken at √s = 3.65 GeV are used to estimate backgrounds from the continuum process e+e−
→ q¯q. It is found that this background is small and uniformly distributed in the full mass region in both decay modes, so the contribution is also included in the smooth background term in the fit.
An unbinned maximum likelihood fit is applied to the invariant mass spectra of K0 SK±π∓
(K+K−π0) to extract the number of η
c events, as shown in Fig. 3. The ηc signal is described
parameters of ηc are fixed to the latest measurement from the BESIII experiment [17]. The
background (except the peaking background in the χc2 signal region) is described with a
second-order Chebyshev polynomial in both decay modes in the three χcJ signal regions.
As there is no significant ηc signal in any of the three χcJ states in either ηc decay mode,
we set upper limits on B(χcJ → ηcπ+π−) using the probability density function (PDF) for
the expected number of signal events. In the χc0 and χc1 signal regions, the likelihood
distributions of the fit to the invariant mass spectra in Fig. 3 are taken as the PDFs directly. They are obtained by setting the number of ηc signal events from zero up to a very large
number. In the χc2 signal region, the likelihood distribution also contains the contribution
from the peaking background. Using the known branching fractions [15], the detection efficiency from MC simulation, and the number of ψ(3686) events, the expected peaking background are 45.7 ± 11.6 in K0
SK±π∓ and 34.4 ± 8.7 in K+K−π0. Here, the errors include
the uncertainties in the detection efficiency and the branching fractions. The PDF of the peaking background is a Gaussian distribution with the mean set to the expected number of events and sigma set to its error. And the PDF of the signal is the distribution of Nk
signal = Nfitk − Nbackgroundk , here Nfitk is a random number generated according to the PDF
from the fit, and Nk
background is a random number generated according to the PDF of the
peaking background with the requirement Nk
background ≤ Nfitk. The systematic uncertainties
are considered by smearing the PDF in each decay with a Gaussian function. The upper limit on the number of events at the 90% C.L. is defined as Nup, corresponding to the
number of events at 90% of the integral of the smeared PDF.
V. SYSTEMATIC UNCERTAINTIES
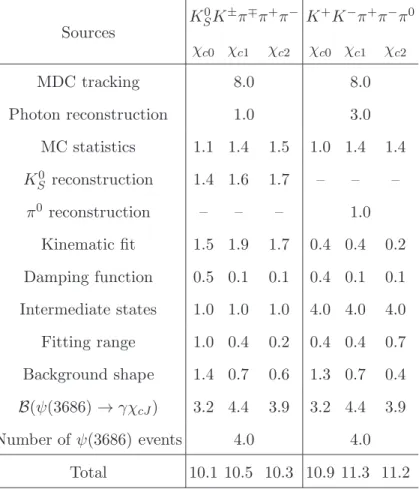
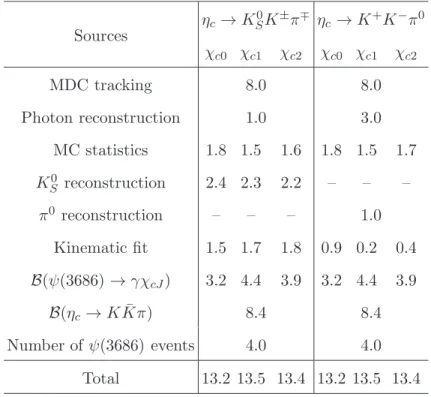
The systematic uncertainties in the measurement of B(χcJ → K ¯Kπππ) and B(χcJ →
ηcπ+π−) are summarized in Tables IV and V, respectively. While some common systematics
of the BESIII experiment are mentioned briefly below and described elsewhere, the other specific systematic errors are described in detail in the following subsections. The systematic errors related to the MDC tracking (2% per track for those from IP), photon reconstruction (1% per photon), and π0 reconstruction (1%) are estimated with control samples [20, 21];
the errors in the branching fractions of ψ(3686) → γχcJ and ηc → K ¯Kπ are taken from
overall 4% uncertainty in the branching fraction associated with the determination of the number of ψ(3686) events in our data sample [10].
Due to the limited statistics of the MC samples used, a 2% uncertainty is taken for each decay. In each measurement, the bias of the fit is studied with both the toy MC experiments generated with the PDF used in the fit and the input/output check on the number of events in the inclusive MC samples. No bias is found in these tests. For the measurement of the hadronic transition χcJ → ηcπ+π−, the expected upper limits on the signal events are
determined using the toy MC experiments. For each toy MC experiment, the method of the upper limit calculation performed on data is repeated, and the median of the upper limit distribution for all the toy MC experiments is taken as the expected limit, as listed in Table VIII.
TABLE IV: Systematic errors (in %) of B(χcJ → KS0K±π∓π+π−) and B(χcJ → K+K−π+π−π0).
Sources K 0 SK±π∓π+π− K+K−π+π−π0 χc0 χc1 χc2 χc0 χc1 χc2 MDC tracking 8.0 8.0 Photon reconstruction 1.0 3.0 MC statistics 1.1 1.4 1.5 1.0 1.4 1.4 KS0 reconstruction 1.4 1.6 1.7 – – – π0 reconstruction – – – 1.0 Kinematic fit 1.5 1.9 1.7 0.4 0.4 0.2 Damping function 0.5 0.1 0.1 0.4 0.1 0.1 Intermediate states 1.0 1.0 1.0 4.0 4.0 4.0 Fitting range 1.0 0.4 0.2 0.4 0.4 0.7 Background shape 1.4 0.7 0.6 1.3 0.7 0.4 B(ψ(3686) → γχcJ) 3.2 4.4 3.9 3.2 4.4 3.9 Number of ψ(3686) events 4.0 4.0 Total 10.1 10.5 10.3 10.9 11.3 11.2
TABLE V: Systematic errors (in %) of B(χcJ → ηcπ+π−) in ηc → KS0K±π∓ and ηc → K+K−π0 decay modes. Sources ηc → KS0K±π∓ ηc → K+K−π0 χc0 χc1 χc2 χc0 χc1 χc2 MDC tracking 8.0 8.0 Photon reconstruction 1.0 3.0 MC statistics 1.8 1.5 1.6 1.8 1.5 1.7 K0 S reconstruction 2.4 2.3 2.2 – – – π0 reconstruction – – – 1.0 Kinematic fit 1.5 1.7 1.8 0.9 0.2 0.4 B(ψ(3686) → γχcJ) 3.2 4.4 3.9 3.2 4.4 3.9 B(ηc → K ¯Kπ) 8.4 8.4 Number of ψ(3686) events 4.0 4.0 Total 13.2 13.5 13.4 13.2 13.5 13.4 A. KS0 reconstruction
The uncertainty in the K0
S reconstruction arises from three parts: the geometric
accep-tance, the tracking efficiency, and the efficiency of K0
S selection. The first part is estimated
using MC simulation, and the other two are studied using J/ψ → K∗±K∓, K∗±
→ K0π±.
By selecting a pair of K±π∓, the recoil mass spectrum shows a clear K0 signal. The
effi-ciency of K0
S reconstruction is calculated with B(K0 n1
S→π+π−)×(n1+n2)/2, where n1 is the number
of K0 obtained from a fit to the K±π∓ recoiling mass when there is a K0
S reconstructed in
the recoil side that satisfies the K0
S selection, and n2 is the number of K0 from fitting to the
K±π∓ recoiling mass spectrum when no K0
S candidate satisfies the KS0 selection. The
differ-ence in the efficiency of K0
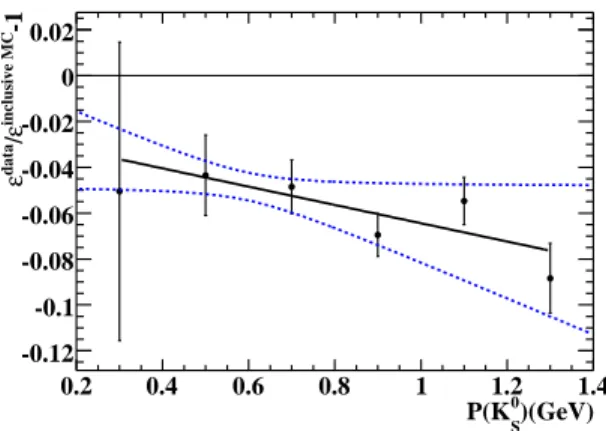
S reconstruction (εdata/εMC− 1) as a function of KS0 momentum is
shown in Fig. 4. The difference in the KS0 reconstruction between data and MC simulation
is fitted with a linear function of the K0
S momentum as shown in Fig. 4 together with the
±1σ envelops. Since the difference between data and MC is significant, we do a correction to the signal MC according to the momentum of K0
is taken as the systematic error.
The systematic errors in B(χcJ → KS0K±π∓π+π−) are found to be 1.4%, 1.6%, and 1.7%,
for J = 0, 1, and 2, respectively; while for B(χcJ → ηcπ+π−), they are 2.4%, 2.3%, and 2.2%
for χc0, χc1, and χc2, respectively.
)(GeV) 0 S P(K 0.2 0.4 0.6 0.8 1 1.2 1.4 -1 inclusive MCε / dataε -0.12 -0.1 -0.08 -0.06 -0.04 -0.02 0 0.02
FIG. 4: The difference in the KS0 reconstruction efficiency between data and MC simulation (points with error bars), together with the fit to the difference with a linear function of momentum. The solid line is from the best fit and the dashed lines are the ±1σ envelopes of the best fit.
B. Kinematic fit
In the MC simulation, the model is much simpler than the real detector performance, and this results in differences between data and MC simulation in the track parameters of photons and charged tracks. The simulation of the photon has been checked in another analysis [10], which shows good agreement between data and MC simulation. For the charged tracks, careful comparisons with purely selected data samples indicate that the MC simulates the momentum and angular resolutions significantly better than those in data, while the error matrix elements agree well between data and MC simulation. This results in a much narrower χ2
4C distribution in MC than in data, and introduces a bias in the efficiency estimation. We
correct the track helix parameters of MC simulation to reduce the difference between data and MC simulation.
We use J/ψ → φf0(980), φ → K+K−, f0(980) → π+π− as a control sample to study
the difference on the helix parameters of charged tracks between data and MC simulation, as this channel has a large production rate, very low background, and has both pions and
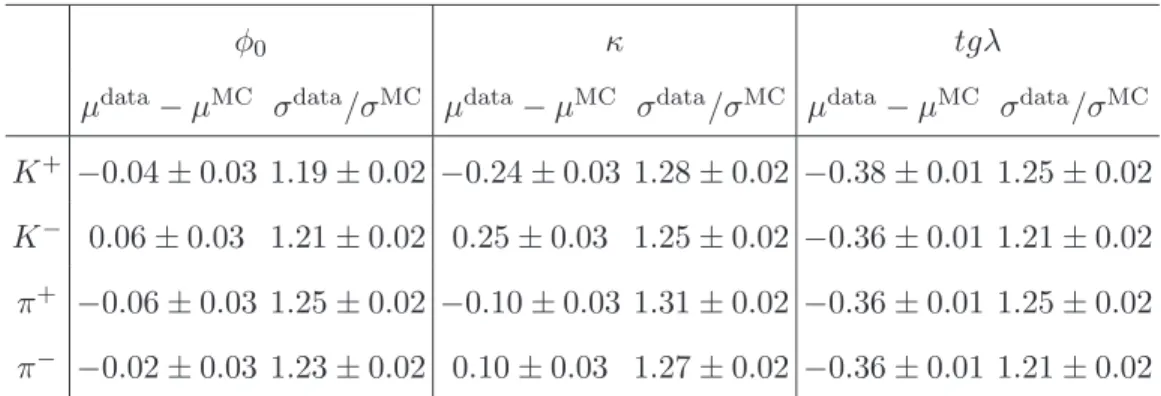
kaons. We find that the pull distributions of data are wider than MC simulation and the peak positions are shifted. These obvious differences between data and MC simulation suggest wrong track parameters have been set in MC simulation. The helix parameters of each track in the MC simulation are enlarged by smearing with a Gaussian function G(µ, σ) = G((µdata
i − µMCi ) × Vii,
q
(σdata
i /σiMC)2− 1 × Vii), where i = {dρ, φ0, κ, dz, tgλ} is
the i-th helix parameter of the track and V is the corresponding covariance matrix. Here dρ is the distance from the pivot to the orbit in the x-y plane, φ0 is the azimuthal angle specifies
the pivot with respect to the helix center, κ is the reciprocal of the transverse momentum, dz is the distance of the helix from the pivot to the orbit in the z direction, and tgλ is the slope of the track. The correction factors µdata
i , µMCi , σidata, and σiMC are the means and
resolutions of the pull distributions of the data and MC simulation obtained from control samples, which are listed in Table VI.
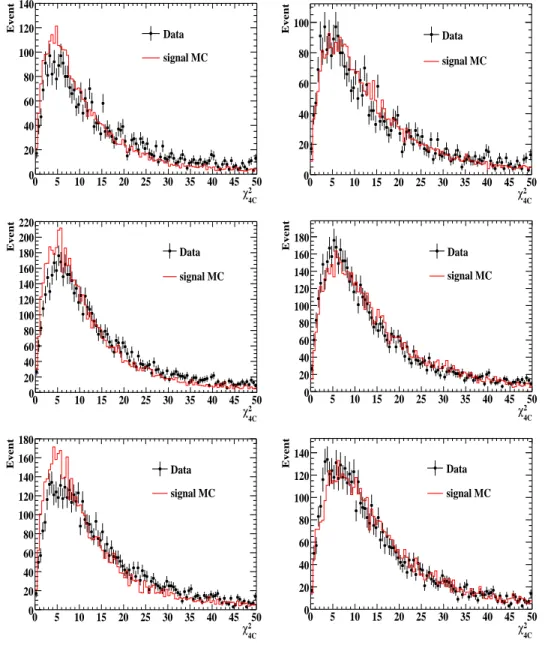
After applying the corrections for many final states, we find that the agreement between data and MC simulation does improve significantly but differences still exist. This indicates that the effect is from multiple sources, and our procedure is not a complete solution to the problem. The comparison of χ2
4C distributions between data and MC simulation before and
after the track-parameter-correction are shown in Figs. 5 and 6 for χcJ → KS0K±π∓π+π−
and K+K−π+π−π0, respectively. Doing a χ2 test between data and MC simulation before
and after correction, we find the probability of the agreement changes from 10−18 (10−3)
level to 10−4 (10−1) level for K0
SK±π∓π+π−(K+K−π+π−π0). We take the efficiency from
the track-parameter-corrected MC samples as the nominal value, and take half of the differ-ence between MC samples before and after the correction as the systematic error from the kinematic fitting. This is a conservative estimation as the uncertainties of the correction factors are at 10% level and the difference between data and MC simulation in the χ2
4C
distributions after the correction are much smaller than that before doing correction. The systematic errors in B(χcJ → KS0K±π∓π+π−) (B(χcJ → K+K−π+π−π0)) are 1.5%,
1.9%, and 1.7% (0.4%, 0.4%, and 0.2%) for J = 0, 1, and 2, respectively; and 1.5%, 1.7%, and 1.8% (0.9%, 0.2%, and 0.4%) systematic uncertainties are assigned to B(χcJ → ηcπ+π−)
TABLE VI: Correction factors extracted from pull distributions using a control sample of J/ψ → φf0(980), φ → K+K−, f0(980) → π+π−.
φ0 κ tgλ
µdata− µMC σdata/σMC µdata− µMC σdata/σMC µdata− µMC σdata/σMC
K+ −0.04 ± 0.03 1.19 ± 0.02 −0.24 ± 0.03 1.28 ± 0.02 −0.38 ± 0.01 1.25 ± 0.02
K− 0.06 ± 0.03 1.21 ± 0.02 0.25 ± 0.03 1.25 ± 0.02 −0.36 ± 0.01 1.21 ± 0.02
π+ −0.06 ± 0.03 1.25 ± 0.02 −0.10 ± 0.03 1.31 ± 0.02 −0.36 ± 0.01 1.25 ± 0.02
π− −0.02 ± 0.03 1.23 ± 0.02 0.10 ± 0.03 1.27 ± 0.02 −0.36 ± 0.01 1.21 ± 0.02
C. Uncertainty from damping factor
In the fit to the invariant mass spectrum of K0
SK±π∓π+π− and K+K−π+π−π0, the
damping function used by KEDR is adopted. Another damping factor used by CLEO [22] is e−E2
γ/8β2 with β = (0.0650 ± 0.0025) GeV determined from their fit. Using this damping
function with β = (0.097±0.024) GeV which is extracted from fitting χc0data, the differences
on the branching fractions of χcJ → KS0K±π∓π+π− (χcJ → K+K−π+π−π0) are assigned to
the systematic error due to damping function, which are 0.5%, 0.1%, and 0.1% (0.4%, 0.1%, and 0.1%) for J = 0, 1, and 2, respectively. The effect for χc1 and χc2 is small since the two
states are very narrow.
D. Uncertainty from intermediate states
The detection efficiencies for the measurement of B(χcJ → KS0K±π∓π+π−) and B(χcJ →
K+K−π+π−π0) are estimated using the MC simulation with χ
cJ decay to KS0K±π∓π+π−
and K+K−π+π−π0 generated according to pure phase space distribution. From the data,
we see broad intermediate states such as K∗ and ρ in the invariant mass spectra of Kπ
and ππ. The branching fractions of χcJ → KS0K±π∓π+π− (χcJ → K+K−π+π−π0) via
these intermediate states are measured by fitting the invariant mass spectra of Kπ and ππ. An alternative signal MC sample is generated with all possible intermediate states and corresponding branching fractions to determine the efficiency. The efficiency difference between this sample and the phase space sample is about 1.0% for χcJ → KS0K±π∓π+π−and
4C 2 χ 0 5 10 15 20 25 30 35 40 45 50 Event 0 20 40 60 80 100 120 140 Data signal MC 4C 2 χ 0 5 10 15 20 25 30 35 40 45 50 Event 0 20 40 60 80 100 Data signal MC 4C 2 χ 0 5 10 15 20 25 30 35 40 45 50 Event 0 20 40 60 80 100 120 140 160 180 200 220 Data signal MC 4C 2 χ 0 5 10 15 20 25 30 35 40 45 50 Event 0 20 40 60 80 100 120 140 160 180 Data signal MC 4C 2 χ 0 5 10 15 20 25 30 35 40 45 50 Event 0 20 40 60 80 100 120 140 160 180 Data signal MC 4C 2 χ 0 5 10 15 20 25 30 35 40 45 50 Event 0 20 40 60 80 100 120 140 Data signal MC
FIG. 5: Comparison of χ24C between signal MC and data for ψ(3686) → γχcJ, χcJ →
KS0K±π∓π+π−. The points with error bars are data, and the solid lines are MC simulation.
Left panel: signal MC without parameter-correction; Right panel: signal MC after track-parameter-correction. From top to bottom are χc0, χc1, and χc2, respectively.
4.0% for χcJ → K+K−π+π−π0; these are taken as the systematic error due to intermediate
4C 2 χ 0 10 20 30 40 50 Event 50 100 150 200 250 300 350 400 Data signal MC 4C 2 χ 0 10 20 30 40 50 Event 50 100 150 200 250 300 350 400 Data signal MC 4C 2 χ 0 10 20 30 40 50 Event 0 100 200 300 400 500 Data signal MC 4C 2 χ 0 10 20 30 40 50 Event 50 100 150 200 250 300 350 400 450 Data signal MC 4C 2 χ 0 10 20 30 40 50 Event 0 50 100 150 200 250 300 350 400 450 Data signal MC 4C 2 χ 0 10 20 30 40 50 Event 50 100 150 200 250 300 350 400 Data signal MC
FIG. 6: Comparison of χ24C between signal MC and data for ψ(3686) → γχcJ, χcJ →
K+K−π+π−π0. The points with error bars are data, and the solid lines are signal MC plus possible
background estimated using inclusive MC sample. Left panel: signal MC without track-parameter-correction; Right panel: signal MC after track-parameter-correction. From top to bottom are χc0,
χc1, and χc2, respectively.
E. Uncertainty from fitting
In the measurement of B(χcJ → K ¯Kπππ), the systematic uncertainty due to the fitting
and [3.35, 3.60] GeV/c2. The biggest differences in the branching fractions are assigned as
errors, which are 1.0%, 0.4%, and 0.2% for χc0, χc1, and χc2, respectively, in KS0K±π∓π+π−
decay; and 0.4%, 0.4%, and 0.7% for χc0, χc1, and χc2, respectively, in K+K−π+π−π0 decay.
The background shape is changed from a second-order Chebyshev polynomial to a third-order Chebyshev polynomial, and the differences are taken to be the systematic errors, which are 1.4%, 0.7%, and 0.6% for χc0, χc1, and χc2, respectively, in KS0K±π∓π+π−; and 1.3%,
0.7%, and 0.4% for χc0, χc1, and χc2 in K+K−π+π−π0.
In the measurement of B(χcJ → ηcπ+π−), for each decay mode in the three χcJ states, the
fit-related systematic errors on the signal yield are estimated by changing the fit ranges, the orders of the background polynomial, the detector resolutions (resolution from MC simula-tion directly or from MC simulasimula-tion convolved with a Gaussian accounts for the difference between data and MC simulation, the sigma of the Gaussian is fixed to the resolution dif-ference found in the χcJ signals measured in Sect. IV A), and the ηc line shapes with the
parameters of ηc varied by one standard deviation [17]; the maximum Nup is used in the
upper limit calculation.
VI. RESULTS AND DISCUSSION
Using the numbers of signal χcJ events from the fits, together with the corresponding
efficiencies, the branching fractions of χcJ → KS0K±π∓π+π− (χcJ → K+K−π+π−π0) are
determined and listed in Table VII. In the measurement of the branching fractions of χcJ → K+K−π+π−π0, contributions from narrow resonances η, ω, and φ are subtracted.
We measure for the first time the branching fractions of χcJ → KS0K±π∓π+π− and χcJ →
K+K−π+π−π0. Comparing the two decay modes, we find that the ratio of the branching
fractions is around one-half which may be a consequence of isospin symmetry. We also measured the branching fractions of χcJ → ωK+K− and χcJ → φπ+π−π0 for the first time,
the results are listed in Table VII as well.
The upper limits on the branching fraction of χcJ → ηcπ+π− in the two decay modes
are listed in Table VIII. After the peaking background subtraction, there is an about 2σ excess in the χc2 → ηcπ+π−. We give a more stringent constraint on the χc2 → ηcπ+π−
branching fraction than BaBar does [8]. The decay χc0 → ηcπ+π−is forbidden by spin-parity
TABLE VII: The results for B(χcJ → KS0K±π∓π+π−), B(χcJ → K+K−π+π−π0), B(χcJ →
ωK+K−), and B(χ
cJ → φπ+π−π0). The first errors are statistical and the second ones are
sys-tematic.
Decay mode Nsignal ǫ (%) B (×10−3) χc0→ KS0K±π∓π+π− 2789 ± 66 9.30 4.22 ± 0.10 ± 0.43 χc0→ K+K−π+π−π0 9031 ± 132 10.34 8.61 ± 0.13 ± 0.94 χc0→ ωK+K− 1414 ± 42 8.04 1.94 ± 0.06 ± 0.20 χc0→ φπ+π−π0 538 ± 29 9.16 1.18 ± 0.07 ± 0.13 χc1→ KS0K±π∓π+π− 5180 ± 75 10.21 7.52 ± 0.11 ± 0.79 χc1→ K+K−π+π−π0 12256 ± 127 11.10 11.46 ± 0.12 ± 1.29 χc1→ ωK+K− 628 ± 29 9.34 0.78 ± 0.04 ± 0.08 χc1→ φπ+π−π0 373 ± 26 10.50 0.75 ± 0.06 ± 0.08 χc2→ KS0K±π∓π+π− 4559 ± 71 9.76 7.30 ± 0.11 ± 0.75 χc2→ K+K−π+π−π0 11189 ± 124 10.48 11.69 ± 0.13 ± 1.31 χc2→ ωK+K− 512 ± 27 8.58 0.73 ± 0.04 ± 0.08 χc2→ φπ+π−π0 408 ± 28 9.88 0.93 ± 0.06 ± 0.10
possible direct production of ψ(3686) → γηcπ+π−, which is not significant in our data and is
neglected in the analysis, and thus our upper limits on the χcJ → ηcπ+π− are conservative.
The theoretical prediction of B(χc1 → ηcπ+π−) is also listed in Table VIII, which is larger
than our measurements. We note that the theoretical prediction uses experimental results as input to normalize the parameters in the model. For example, the parameter αM/αE is
extracted by comparing the branching fraction of ψ(3686) → hcπ0 between the theoretical
calculation and the experimental measurement. This makes the prediction highly dependent on the former experimental results and theoretical models. This may partly explain the discrepancy between the theoretical prediction and the experimental results.
TABLE VIII: Upper limits at the 90% C.L. on B(χcJ → ηcπ+π−) in the two ηc decay modes.
Nfit is the number of events from the fits shown in Fig.3, Nsignal is the number of events after
the peaking background subtraction, Nobservedup is the upper limit on the number of events at the 90% C.L. observed on data, and Nexpectedup is the expected upper limit on the number of events at the 90% C.L. from toy MC experiments. In the χc2 case, Nfit includes the contribution from the
peaking background ψ(3686) → π+π−J/ψ, J/ψ → γη c, ηc → KS0K±π∓(K+K−π0). Decay mode N fit Nsignal Nup observed N up expected ǫ B up(χ cJ →ηcπ+π−) Btheory(χcJ→ηcπ+π−) (%) (%) (%) χc0→(KS0K±π∓)π+π− 0.0 ± 4.6 0.0 ± 4.6 6.8 7.1 6.29 0.07 -χc0→(K+K−π0)π+π− 0 ± 15 0 ± 15 34 27 6.82 0.41 -χc1→(KS0K±π∓)π+π− 18 ± 17 18 ± 17 49 44 9.45 0.32 1.81 ± 0.26 χc1→(K+K−π0)π+π− 6 ± 25 6 ± 25 50 47 9.82 0.44 χc2→(KS0K±π∓)π+π− 77 ± 19 31 ± 22 64 63 7.72 0.54 -χc2→(K+K−π0)π+π− 89 ± 26 55 ± 27 105 94 7.83 1.2 -Acknowledgments
The BESIII collaboration thanks the staff of BEPCII and the computing center for their hard efforts. This work is supported in part by the Ministry of Science and Tech-nology of China under Contract No. 2009CB825200; National Natural Science Foundation of China (NSFC) under Contracts Nos. 10625524, 10821063, 10825524, 10835001, 10935007, 11125525, 11235011; Joint Funds of the National Natural Science Foundation of China under Contracts Nos. 11079008, 11179007; the Chinese Academy of Sciences (CAS) Large-Scale Scientific Facility Program; CAS under Contracts Nos. KJCX2-YW-N29, KJCX2-YW-N45; 100 Talents Program of CAS; Istituto Nazionale di Fisica Nucleare, Italy; Ministry of De-velopment of Turkey under Contract No. DPT2006K-120470; U. S. Department of Energy under Contracts Nos. DE-FG02-04ER41291, DE-FG02-91ER40682, DE-FG02-94ER40823; U.S. National Science Foundation; University of Groningen (RuG); the Helmholtzzentrum fuer Schwerionenforschung GmbH (GSI), Darmstadt; and WCU Program of National Re-search Foundation of Korea under Contract No. R32-2008-000-10155-0.
[2] N. Brambilla et al. (Quarkonium Working Group), Eur. Phys. J. C 71, 1534 (2011). [3] T. M. Yan, Phys. Rev. D 22, 1652 (1980).
[4] Y.-P. Kuang, S. F. Tuan, and T. M. Yan, Phys. Rev. D 37, 1210 (1988). [5] Y.-P. Kuang and T.-M. Yan, Phys. Rev. D 24, 2874 (1981).
[6] Y.-P. Kuang, Front. Phys China 1, 19 (2006).
[7] C. Cawlfield et al. (CLEO Collaboration), Phys. Rev. D 73, 012003 (2006). [8] J. P. Lees et al. (BaBar Collaboration), arXiv:1206.2008 [hep-ex].
[9] Q. Lu and Y.-P. Kuang, Phys. Rev. D 75, 054019 (2007). The predicted branching fraction is recalculated with the parameters in the model determined using the updated expermential data: Γ(ψ(3686)) = (304±9) keV, B(ψ(3686) → J/ψππ) = (51.35±0.52)%, and B(ψ(3686) → hcπ0) × B(hc → γηc) = (4.35 ± 0.57) × 10−4. The total width of ψ(3686) and the branching
fraction of ψ(3686) → J/ψππ are taken from PDG, while the B(ψ(3686) → hcπ0) × B(hc →
γηc) is the combined result from the measurement in CLEO and BESIII Collaboration.
[10] M. Ablikim et al. (BESIII Collaboration), Phys. Rev. D 81, 052005 (2010).
[11] M. Ablikim et al. (BESIII Collaboration), Nucl. Instrum. Meth. A 614, 345 (2010). [12] S. Agostinelli et al. (geant4 Collaboration), Nucl. Instrum. Meth. A 506, 250 (2003). [13] S. Jadach, B. F. L. Ward and Z. Was, Comp. Phys. Commu. 130, 260 (2000); Phys. Rev. D
63, 113009 (2001).
[14] http://www.slac.stanford.edu/∼lange/EvtGen/; R. G. Ping et al., Chinese Physics C 32, 599 (2008).
[15] J. Beringer et al., Phys. Rev. D 86, 010001 (2012).
[16] J. C. Chen, G. S. Huang, X. R. Qi, D. H. Zhang and Y. S. Zhu, Phys. Rev. D 62, 034003 (2000).
[17] M. Ablikim et al. (BESIII Collaboration), Phys. Rev. Lett. 108, 222002 (2012). [18] V. V. Anashin et al., arXiv:1012.1694 [hep-ex].
[19] M. Ablikim et al. (BESIII Collaboration), Phys. Rev. Lett. 107, 092001 (2011). [20] M. Ablikim et al. (BESIII Collaboration), Phys. Rev. Lett. 105, 261801 (2010). [21] M. Ablikim et al. (BESIII Collaboration), Phys. Rev. D 83, 112005 (2011). [22] R. E. Mitchell et al. (CLEO Collaboration), Phys. Rev. Lett. 102, 011801 (2009).
