J. Evolution Med. Dent. Sci./eISSN- 2278-4802, pISSN- 2278-4748/ Vol. 8/ Issue 41/ Oct. 14, 2019 Page 3064
Evaluation and Categorization of Femur Morphometry with
Digital Measurement Method
Rumeysa Gamze Taskin Senol1, Ahmet Hilmi Yucel2
1Department of Anatomy, Faculty of Medicine, University of Cukurova, Adana, Turkey. 2Department of Anatomy, Faculty of Medicine, University of Cukurova, Adana, Turkey.
ABSTRACT BACKGROUND
Variational differences of the femur between populations like clinical, anthropological and forensic anthropology are important. These morphometric differences are influenced by factors such as race, heredity, climate and diet.
METHODS
With the descriptive and cross-sectional design of this study, we aimed to investigate the femur morphometry with digital image analysis program. In this study, 105 femur bones belonging to Cukurova University, Medicine Faculty, Anatomy Department, were used. This study which has a descriptive and cross-sectional design, was carried out in April 2018. For statistical analysis, "Statistical Package for Social Sciences for Windows 20.0" program was used.
RESULTS
The mean and standard deviation values of the parameters measured in femur were as follows- maximum femur length 431.42±36.2, physiological femur length 428±36.15, physiological trochanter length 403.3±34.3, anterior, posterior, superior and inferior aspects of collum femoris length 28±5.30, 25.5±5.4, 26.2±5.4, 39±7.5, caput femoris diameter 44±4, collum femoris width 34.2±7.15, collum femoris axis length 95.2±10, transverse and sagittal aspects of subtrochanteric diameter 30±3, 25.01±3, linea intertrochanterica length 68.1±8.22, transverse and sagittal aspects of mid-body diameter 27.03±3, 27.22±3, maximum proximal and distal width 86.1±13, 76.3±8, intercondylar width and depth 18.3±3.32, 25±4, condylar width and depth were 70.14±7.2, 57.4±7, midbody circumference was 85.5±9.03 mm. The mean weight of the femur was determined as 292.4±68.04 gr. Robustness, platymeria, pilastric, intercondylar width and depth indexes were calculated. Averages values of these indexes respectively were 13±2, 84.15±10, 101.22±10.4, 0.3±0.04, 0.43±0.05.
CONCLUSIONS
Although the mean morphometric data of the right femurs obtained from our study were higher than the left femurs, there was no significant difference (p> 0.05); There was a statistically significant difference between the right and left femurs in the intercondylar depth average (p <0.05). When the studies in the literature were compared with our results, it was found that the nearest average values were the maximum femur length and physiological femur length. Studies suggest that differences in femur geometry may be caused by race-dependent characteristics. The anatomical structure and morphometric measurements of the femur are clinically important for femoral fractures and pathologies. In addition, the data obtained from this study will be used by anthropologists for various determinations in the field of forensic medicine. We think that the results of our study will help clinicians in surgical interventions.
KEY WORDS
Femur, Morphometry, Anthropology, Index, Population, Anatomy
Corresponding Author: Rumeysa Gamze Taskin Senol, Department of Anatomy, Faculty of Medicine, University of Cukurova, Adana, Turkey. E-mail: [email protected] DOI: 10.14260/jemds/2019/666
Financial or Other Competing Interests: None.
How to Cite This Article:
Senol RGT, Yucel AH. Evaluation and categorization of femur morphometry with digital measurement method. J. Evolution Med. Dent. Sci. 2019;8(41):3064-3069, DOI: 10.14260/jemds/2019/666
Submission 14-08-2019, Peer Review 25-09-2019, Acceptance 01-10-2019, Published 14-10-2019.
J. Evolution Med. Dent. Sci./eISSN- 2278-4802, pISSN- 2278-4748/ Vol. 8/ Issue 41/ Oct. 14, 2019 Page 3065 BACKGROUND
Human skeletal structure differs between populations. While the morphological values of the individuals living in different historical periods of a specific society may vary, the values of the societies living in the same period may be diverse. The femur, which is the longest and most powerful bone of the human skeleton, has a trajectory structure that can transfer
the weight in the most appropriate way.1,2 Morphometric
analysis should be done correctly to maintain this specific structure. Morphometric values of the femur are important for the determination of inter-racial features and differences. In this study, morphometric data of femur were obtained by digital image analysis program. Computerized analysis programs are becoming widespread through developing technology. In this way, the rate of efficient use of time increases and the materials are used for longer periods. In addition, these digital image analysis programs provide more precise and accurate results. For these reasons, it is preferred
more frequently.3 We believe that this study will contribute
to the database of our society by determining the morphometric differences between the populations. In addition, morphometric analysis of femur is of great importance in terms of postoperative success when prosthetic surgery is required. The main objective of total hip replacement implants is to provide stability without
restricting movement.4 For this purpose, it is seen that
proximal femur has morphometric importance especially in
prosthesis design.5 In addition, by standardizing the data
obtained, it is easier to identify possible risk factors for pathological conditions. The majority of the morphometric data in the literature were obtained by conventional (Manual) morphometric measurements. This study investigated that the femur morphometry with digital image analysis program.
METHOD S
This descriptive and cross-sectional design, 105 (55 right, 50 left) femoral bone with unknown age and gender were used in Cukurova University, Faculty of Medicine, Department of Anatomy. The photographs of the bones were taken with a digital camera (Canon®, model 50D) at a distance of 70 cm under artificial light using a scale with a fixed length. The aperture is set to f/5, the exposure time is 1/ 60s and the ISO value is set to 100. Photos taken were transferred to computer. The photographs were examined using the digital
image analysis program (DigimizerTM, Japan) to determine
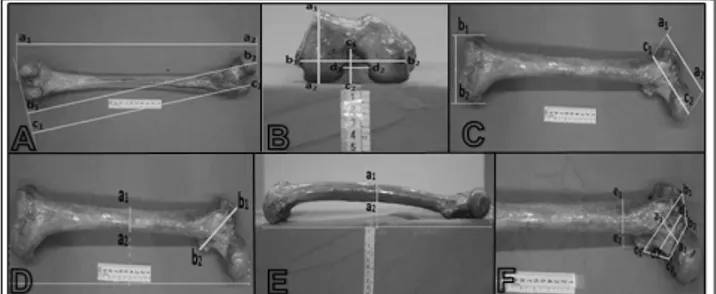
the morphometric properties of the bones. In the photographs, the reference points of the parameters were determined, and the lines were drawn in the required directions. And the determined twenty-three parameters were measured. These parameters are generally used for sex determination. Measurements in the femur bone (Figure 1):
Maximum Femur Length
The linear distance between the tangent passing through the top point of the Caput Femoris and the tangent passing through the lowest point of the condylus medialis.
Physiological Femur Length
The linear distance between the tangent passing through the top point of caput femoris and the tangent passing through the lowest point of condylus medialis and condylus lateralis.
Physiological Trochanter Length
The linear distance between the tangent passing through the top point of the trochanter major and the tangent passing through the lowest point of the condylus medialis and condylus lateralis while maintaining the normal inclined position of the femur.
Anterior Collum Femoris Length
The linear distance between the midpoint of the
epiphysis line and the midpoint of the linea
intertrochanterica.
Superior Collum Femoris Length
The linear distance between the apex of the epiphysis line and the apex of the trochanter major.
Inferior Collum Femoris Length
The linear distance between the lower point of the epiphysis line and the apex of the trochanter minor.
Posterior Collum Femoris Length
On the posterior aspect, the linear distance between the midpoint of the epiphysis line and the midpoint of the crista intertrochanterica.
Collum Femoris Width
The length of the line taken vertically to the line connecting midpoint of the linea intertrochanterica and the midpoint of the epiphysis line.
Linea Intertrochanterica Length
The linear distance that passes through the peaks of the trochanter major and trochanter minor.
Maximum Proximal Width
The linear distance between the highest point of the caput femoris and the trochanter major.
Maximum Distal Width
The linear distance between the epicondylus medialis and epicondylus lateralis where they are most protruding to the sides.
Collum Femoris Axis Length
The linear distance between the outermost protrusion of the trochanter major and the highest point of the caput femoris.
Mid-Body Circumference
The mid-body circumference was measured with a tape measure.
Caput Femoris Diameter
The length that lies between the two points where the convexity of the caput femoris is highest in its vertical direction.
J. Evolution Med. Dent. Sci./eISSN- 2278-4802, pISSN- 2278-4748/ Vol. 8/ Issue 41/ Oct. 14, 2019 Page 3066 Subtrochanteric Sagittal Diameter
The distance measured from the approximately 3-6 mm bottom of the trochanter minor and the anterior-posterior direction.
Subtrochanteric Transverse Diameter
The distance measured from the approximately 3-6 mm bottom of the trochanter minor and the horizontal diameter which is taken vertically in line with the subtrochanteric sagittal diameter.
Mid-Body Sagittal Diameter
The diameter taken from the middle of the femur body in the anterior-posterior direction.
Mid-body Transverse Diameter
The diameter taken from the middle of the femur body in the horizontally at the same level perpendicular to the mid-body sagittal diameter.
Intercondylar Width
The distance between the lateral edge of the condylus medialis and the medial edge of the condylus lateralis in the distal part of the femur.
Intercondylar Depth
This is the distance between the deepest point of the posterior edge of the intercondylar region and the midpoint of the condylus medialis and condylus lateralis in the distal part of femur.
Condylar Width
At the lower end of the femur, the linear distance between the points at the condylus medialis-condylus lateralis are most protruding laterally.
Condylar Depth
At the lower end of the femur, the linear distance between the midpoint of the line joining the most extreme points of the posterior edges of the condylus medialis-the condylus lateralis and the midpoint of the line joining the most extreme points of the front edges.
Weight of Femur
Precision scala
In addition, robustness index, platymeria index, pilastric index, intercondylar width index and intercondylar depth
index were calculated.6-9
Robustness Index
An index used to define the mass of bone. It is important in gender discrimination. Calculation method; midbody transverse length + midbody sagittal length÷physiological femoral length×100.
Platymeria Index
Describes the flatness of the upper part of the femoral body.
Calculation method; subtrochanteric sagittal
diamater÷subtrochanteric transverse diamater×100.
Categorization values; hyperplatymeria/very flat (≤75),
platymeria/flat (75–84.9), eumeria/round (85–99.9),
stenomeria/very round (≥100).
Pilastric Index
Defines the degree of development of linea aspera. Linea aspera provides support and stabilization of the femur during walking and running. Linea aspera, which started to emerge in pubertal period, becomes more prominent with age because of this feature. Calculation method; midbody sagittal diameter÷mid-body transverse diameter×100. Categorization values; no pilaster (≤100), light pilastric/linea aspera weak (100–109.9), intermediate pilastric/linea aspera normal
(110–119.9), advanced/strong pilastric/linea aspera
prominent (≥120).
Intercondylar Width Index
Intercondylar width ÷ condylar width.
Intercondylar Depth Index
Intercondylar depth ÷ condylar depth.
For statistical analysis, "Statistical Package for Social Sciences for Windows 20.0" program was used. Descriptive Statistical methods (Mean, standard deviation, frequency%, minimum, maximum value) were used to evaluate the study data. Student's t-test was used to compare the right and left sides of the femur. The results were evaluated with a confidence interval of 95% and a significance level of p <0.05.
RESULT S
The mean, standard deviation and minimum-maximum values of the determined parameters are shown in table 1.
Mean values of robustness, platymeria, pilastric,
intercondylar width and intercondylar depth indices were 13±2, 84.15±10, 101.22±10.4, 0.3±0.04 and 0.43±0.05 respectively. Platymera index value belongs to eumeria (Round) and pilastric index value belongs to light pilastric (Linea aspera weak) classification. There was no significant difference between right and left femurs. Parameters were measured in mm, excluding femoral weight (gr).
Figure 1. A. Maximum Femur Length (a1-a2), Physiological Femur Length (b1-b2), Physiological Trochanter Length (c1-c2). B. Condylar Depth (a1-a2), Condylar Width (b1-b2), İntercondylar Depth (c1-c2), Intercondylar Width (d1-d2). C. Maximum Proximal Width (a1-a2), Maximum Distal Width (b1-b2), Collum Femoris Axis Length (c1-c2). D. Mid-Body Transverse Diameter (a1-a2), Linea İntertrochanterica
Length (b1-b). E. Mid-Body Sagittal Diameter (a1-a2). F. Collum Femoris Anterior Length (a1-a2), Collum Femoris Superior Length
(b1-b2), Collum Femoris İnferior Length (c1-c2), Collum Femoris Width (d1-d2), Subtrochanteric Sagittal Diameter (e1-e2).
J. Evolution Med. Dent. Sci./eISSN- 2278-4802, pISSN- 2278-4748/ Vol. 8/ Issue 41/ Oct. 14, 2019 Page 3067
Parameters Mean ± SD (mm)
Maximum femur length 431.42±36.2
Physiological trochanter length 403.3±34.3
Collum femoris anterior length 28±5.30
Collum femoris superior length 26.2±5.4
Collum femoris inferior length 39±7.5
Collum femoris width 34.2±7.15
Collum femoris axis length 95.2±10
Linea intertrochanterica length 68.07±8.22
Maximum proximal width 86.1±13
Maximum distal width 76.3±8
Collum femoris posterior length 25.5±5.4
Femur weight (gr) 292.4±68.04
Mid-body circumference 85.5±9.03
Caput femoris diameter 44±4
Physiological femur length 428±36.15
Subtrochanteric sagittal diameter 25.01±3
Subtrochanteric transverse diameter 30±3
Mid-body sagittal diameter 27.22±3
Mid-body transverse diameter 27.03±3
Intercondylar width 18.3±3.32
Intercondylar depth 25±4
Condylar width 70.14±7.2
Condylar depth 57.4±7
Table 1. Mean ± Standard Deviation Values of the Parameters
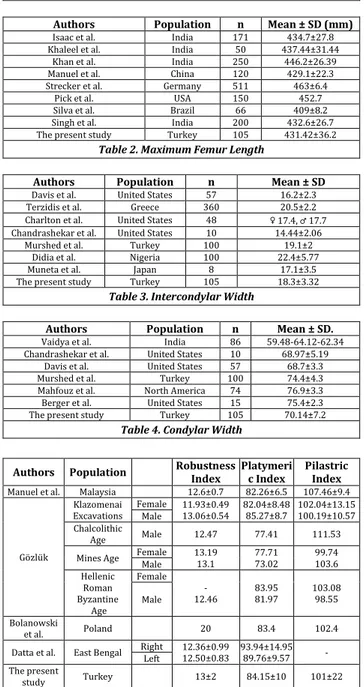
Authors Population n Mean ± SD (mm)
Isaac et al. India 171 434.7±27.8
Khaleel et al. India 50 437.44±31.44
Khan et al. India 250 446.2±26.39
Manuel et al. China 120 429.1±22.3
Strecker et al. Germany 511 463±6.4
Pick et al. USA 150 452.7
Silva et al. Brazil 66 409±8.2
Singh et al. India 200 432.6±26.7
The present study Turkey 105 431.42±36.2
Table 2. Maximum Femur Length
Authors Population n Mean ± SD
Davis et al. United States 57 16.2±2.3
Terzidis et al. Greece 360 20.5±2.2
Charlton et al. United States 48 ♀ 17.4, ♂ 17.7 Chandrashekar et al. United States 10 14.44±2.06
Murshed et al. Turkey 100 19.1±2
Didia et al. Nigeria 100 22.4±5.77
Muneta et al. Japan 8 17.1±3.5
The present study Turkey 105 18.3±3.32
Table 3. Intercondylar Width
Authors Population n Mean ± SD.
Vaidya et al. India 86 59.48-64.12-62.34
Chandrashekar et al. United States 10 68.97±5.19
Davis et al. United States 57 68.7±3.3
Murshed et al. Turkey 100 74.4±4.3
Mahfouz et al. North America 74 76.9±3.3
Berger et al. United States 15 75.4±2.3
The present study Turkey 105 70.14±7.2
Table 4. Condylar Width
Authors Population Robustness Index Platymeric Index Pilastric Index
Manuel et al. Malaysia 12.6±0.7 82.26±6.5 107.46±9.4
Gözlük Klazomenai Excavations Female 11.93±0.49 13.06±0.54 82.04±8.48 85.27±8.7 102.04±13.15 100.19±10.57 Male Chalcolithic Age Male 12.47 77.41 111.53
Mines Age Female Male 13.19 13.1 77.71 73.02 99.74 103.6 Hellenic Roman Byzantine Age Female - 12.46 83.95 81.97 103.08 98.55 Male Bolanowski et al. Poland 20 83.4 102.4
Datta et al. East Bengal Right Left 12.36±0.99 12.50±0.83 93.94±14.95 89.76±9.57 - The present
study Turkey 13±2 84.15±10 101±22
Table 5. Robustness, Platymeria and Pilastric İndex Mean ± SD. Values
DISCU SSION
Maximum femur length is one of the most commonly used parameters in gender determination. Studies on gender determination of long bones have shown that the male femur is larger and larger than the female femur. In a study comparing the right and left femoral lengths, the left side values were found to be larger than the right side, but no
significant difference was found.10 When the studies in which
the maximum femur length is calculated are reviewed in the literature (Table 2), the values closest to our results belong to
the study of Singh et al in the Indian population.6,10-16 Duthie
et al. divided the population into two groups according to the time of death. The mean values of the femur length of the first group (Those who died in 1900-20, n: 71) were 457.3 mm in men and 422 mm in women calculated. The mean values of the femur length of the second group (those who died in 1980, n: 49) were 464.9 mm in men and 428.4 mm in women calculated. In the same study, mean values of collum femoris anterior length were in the first and second groups, respectively; 34.9 mm and 38.3 mm in males and 32.5 mm and 35 mm in females calculated. The mean values of collum femoris width in the first and second groups were, respectively; 34.1 mm and 35.8 mm in men and 30.6 mm and 32.1 mm in women calculated. As a result of the increase in these parameters; they think that the femur more susceptible
to hip fracture due to biochemical reasons.17
In the study of Ziylan and Murshid, the mean of the trochanter length was 405.4±22.9 mm in the left femur and 402.6±28.1 mm in the right femur. When these data was compared to our study, the mean value of the left femur was found to be high, while the mean value of the right femur was
found to be less.18 When the collum femoris anterior values in
the literature were compared with our study, the results of the performed by Isaac et al. had the closest values to our study with 28.6±4.6 mm but the Silva et al. had the lower values with 22.3±3.3 mm. and Khanal et al. showed that the highest values with 37.8±5.3 mm. Collum femoris superior,
inferior and posterior values showed that the similarity.11,15,19
In the study performed by separating the radiographic images into two groups, first group; 1958-60 and second group; 1989-91, collum femoris axis length was 81 mm in the first group and 90.2 mm in the second group. This increase was attributed to the fact that the population had better
nutritional conditions over time.20 In study conducted by the
USA, the mean of the collum femoris axis length was
calculated as 98.4 mm.14 The mean values of collum femoris
width were right side and left side respectively, 33.53 mm and 27.86 mm in the American population, 33.91 and 28.92 mm in the Mexican population, and 35.09 and 30.85 mm in
the French population.21 In a study in which two different
populations were compared, mean values of collum femoris width; In the Caucasian population, the average was 45.1 cm and 43.7 cm in males and females, respectively. In the same study, in the Chinese population, an average of 43 cm for men and 39 cm for women were found. The results of the Caucasian population are the highest mean value compared
to the literature.22 In a retrospective study of the population
divided into two groups, 1950 and 1990, the width of the collum femoris was compared and it was found that the values were 38.1 mm in 1950 and 38.6 mm in 1960. The researchers investigating the reasons for the increase in hip
J. Evolution Med. Dent. Sci./eISSN- 2278-4802, pISSN- 2278-4748/ Vol. 8/ Issue 41/ Oct. 14, 2019 Page 3068
fracture formation with age stated that there was no
significant difference in the width of the collum femoris.23
When the literature data are examined, Khan et al. and Pick et
al. studies showed that parallelism with our results.13,14 In a
study conducted in Nepal, the mean value of linea
intertrochanterica length was found to be 5.04±0.70 cm.19 In
2004, Singh et al. showed that the value of linea intertrochanterica was 6.31 cm and the mean result for the same parameter in 2013 was 5.81±5.80 cm. These values
were found to be low compared to our study24. The thickest
and most important of the three major ligaments of the hip joint is iliofemoral ligamentum. Part of this ligament attaches to the linea intertrochanterica. Therefore, it is of great
importance in hip joint operations1. The intercondylar width
value in our study was found to be low compared to the studies in Greece, Nigeria, and the USA and higher when compared to Japan, America and Turkey. The results are
shown in table 3.25-31
In addition, the intercondylar depth value calculated by
Terzidis et al. In the same study was found to be 25.9±2.25
this value is similar to the value obtained in our study 25±4. The intercondylar width of the femur is effective in the physiology and pathology of the anterior and posterior ligamentum cruciatum. Intercondylar width values have no effect on prosthesis design in patients with knee replacement. When the findings of our study were compared with the other studies, it was seen that the Indian population was smaller in the condylar width value and the studies in the US population had variable values. In studies conducted in North America and Turkey were higher values The condylar width is supported by most of the researchers for which it is largely
accurate in gender determination (Table 4).24,27,28,32,33 These
parameters are important in prosthesis production and surgical practice as well as in designing the size of knee implants.
In a study conducted in France, pilastric index values were calculated in a population of Neanderthal, Middle Paleolithic modern people and European.
Upper Paleolithic modern people. The results were found to be 100.6±9.6 in Neanderthals, 121.6±15 in modern Middle Palaeolithic people and 116.9±10.1 in modern Upper Palaeolithic people. As a result, Neanderthals were found to
have pilaster deficiency and bone mass was higher34.
Comparison of the mean values of Robustness, platymeria and pilastric indexes with the literature data and periodic
analysis are shown in Table 5.6,7,9,35
In a study conducted in Istanbul, intercondylar width index was found to be 0.29±0.03 and intercondylar depth
index was found to be 0.40±0.03.36 In a study conducted in
athletes, the intercondylar width index were found to be 0.305 for female athletes and 0.311 for male athletes. They reported that female athletes experienced more ligamentum cruciatum anterior (ACL) injuries than male athletes. They think that the reason of these injury rates differ according to gender is body fat ratio, hamstring group muscles (m. biceps femoris, m. semitendinosus, m. semimembranosus) and m.
quadriceps femoris strength and ACL size.37 In a study
conducted in Japan, individuals (healthy and patients with osteoarthritis) were compared. The intercondylar width index of healthy individuals was 0.22±0.04 and the intercondylar depth index was 0.51±0.11. The same values were found to be 0.23±0.04 and 0.55±0.13, respectively in
patients with osteoarthritis. They reported that the growth of osteophytes in intercondyles correlated with progression of
osteoarthritis31. In our study, 0.3±0.04 and 0.43±0.05,
respectively. There is a statistically significant relationship between index values and anterior cruciate ligament rupture and it is thought to have an important role in gender determination even if there is no consensus. In a study conducted for the purpose of gender prediction from femur weight and mean femur weight was found to be in men and women; 389±76.8 and 281±53.9 on the right side, 380.2±74.1 and 380.2±59.8 g on the left side, respectively. Male femur
was found to be heavier than female femur38. Femur weight
in our study; the minimum value was 134 gr, the maximum value was 466 gr, mean value was 292.4±68.04, while the mean of the right side was 302±68 and the mean of the left side was 284±67.55 g.
CONC LU SION S
Although the mean morphometric data of the right femurs obtained from our study were higher than the left femurs, there was no significant difference (p> 0.05); There was a statistically significant difference between the right and left femurs in the intercondylar depth average (p <0.05). When the studies in the literature were compared with our results, it was found that the nearest average values were the maximum femur length and physiological femur length. Studies suggest that differences in femur geometry may be caused by race-dependent characteristics. The anatomical structure and morphometric measurements of the femur are clinically important for femoral fractures and pathologies. In addition, the data obtained from this study will be used by anthropologists for various determinations in the field of forensic medicine. We think that the results of our study will help clinicians in surgical interventions.
REFER ENC ES
[1] Yücel AH. Dere anatomi atlası ve ders kitabı. 7 baskı. Akademisyen kitabevi. Adana: 2018. p. 339-43.
[2] Arıncı K, Elhan A. Anatomi. Cilt - 2. 3. Baskı. Güneş Kitabevi: Ankara 2001. p. 28-30.
[3] Kafa IM, Arı I. Morfometrik çalışmalarda manüel (el ile) ve dijital (sayısal) - bilgisayar destekli ölçüm yöntemlerinin karşılaştırılması. Uludağ Üniversitesi Tıp Fakültesi Dergisi 2004;30:3141-4.
[4] Baharuddın MY, Kadir MRA, Zulkıfly AH, et al. Morphology study of the proximal femur in Malay population. Int J Morphol 2011;29(29):1321-5.
[5] Bilgen OF, Bilgen S, Ermutlu C. Kalça protezlerinde malzeme ve tasarım özellikleri. TOTBİD Dergisi 2011;10(2):147-57.
[6] Manuel JK, Mohd YBM. Some anthropometric studies of the femur of the male. West Malaysian Chinese. Am J Phys Anthrop 1974;41(1):133-7.
[7] Gözlük P. Klazomenai iskeletlerinin paleoantropolojik açıdan değerlendirilmesi. Yüksek lisans tezi. Sosyal bilimler enstitüsü. Ankara 1998.
J. Evolution Med. Dent. Sci./eISSN- 2278-4802, pISSN- 2278-4748/ Vol. 8/ Issue 41/ Oct. 14, 2019 Page 3069
[8] Wada M, Tatsuo H, Baba H, et al. Femoral intercondylar
notch measurements in osteoarthritic knees.
Rheumatology (Oxford) 1999;38(6):554-8.
[9] Bolanowski W, Śmiszkiewicz-Skwarska A, Polguj M, et al. The occurrence of the third trochanter and its correlation to certain anthropometric parameters of the human femur. Folia Morphol (Warsz) 2005;64(3):168-75.
[10] Strecker W, Keppler P, Gebhard F, et al. Length and torsion of the lower limb. J Bone Joint Surg Br 1997;79(6):1019-23.
[11] Isaac R, Vettivel S, Prasad R, et al. Prediction of the femoral neck-shaft angle from the length of the femoral neck. Clinical Anatomy 1997;10(5):318-23.
[12] Khaleel N, Shaik HS. Morphometric study of human femur. Int J Cur Res Rev 2013;5(6):76-9.
[13] Khan SM, Saheb SH. Anthropometric study of femur in South India. Int J Anat Res 2014;2(4):630-2.
[14] Pick JW, Stack JK, Anson BJ. Measurements on the human femur - I. lengths, diameters and angles. Quarterly Bulletin of the Northwestern University Medical School 1941;15(4):281-90.
[15] Da Silva VJ, Yasuo J, De Débora MGS. Anatomical aspects of the proximal femur of adult Brazilians. Int J Morphol 2003;21(4):303-8.
[16] Singh S, Nair SK, Anjankar V, et al. Regression equation for estimation of femur length in Central Indians from inter-trochanteric crest. J Indian Acad Forensic Med 2013;35(3):223-6.
[17] Duthie RA, Bruce MF, Hutchison JD. Changing proximal femoral geometry in North East Scotland an osteometric study. BMJ 1998;316(7143):1498-500.
[18] Ziylan T, Murshid KA. An analysis of Anatolian human femur anthropometry. Turk J Med Sci 2002;32:231-5. [19] Khanal L, Shah S, Koirala S. Estimation of total length of
femur from its proximal and distal segmental measurements of disarticulated femur bones of Nepalese population using regression equation method. Journal of
Clinical and Diagnostic Research: JCDR
2017;11(3):HC01-HC05.
[20] O'Neill TW, Grazio S, Spector TD, et al. Geometric measurements of the proximal femur in UK women: secular increase between the late 1950s and early 1990s. Osteoporos Int 1996;6(2):136-40.
[21] Alunni-Perret V, Staccini P, Quatrehomme G. Re-examination of a measurement for sexual determination using the supero-inferior femoral neck diameter in a modern European population. J Forensic Sci 2003;48(3):517-20.
[22] Hoaglund FT, Low WD. Anatomy of the femoral neck and head, with comparative data from Caucasians and Hong Kong Chinese. Clinical Orthopaedics and Related Research 1980;(152):10-6.
[23] Reid IR, Chin K, Evans MC, et al. Relation between increase in length of hip axis in older women between 1950s and 1990s and increase in age specific rates of hip fracture. BMJ 1994;309(6953):508-9.
[24] Singh IP, Bhasin MK. Manual of biological anthropology.
1st edn. New Delhi: Kamala Raj publications 2004: p.
79-83.
[25] Davis TJ, Shelbourne KD, Klootwyk TE. Correlation of the intercondylar notch width of the femur to the width of the anterior and posterior cruciate ligaments. Knee Surg Sports Traumatol Arthrosc 1999;7(4):209-14.
[26] TerzidisI, Totlis T, Papathanasiou E, et al. Gender and side to side differences of femoral condyles morphology: osteometric data from 360 Caucasian dried femori. Article ID 679658, Anatomy Research International 2012;2012: p. 6.
[27] Charlton WPH, St. John TA, Ciccotti MG, et al. Differences in femoral notch anatomy between men and women: a magnetic resonance imaging study. Am J Sports Med 2002;30(3):329-33.
[28] Chandrashekar N, Slauterbeck J, Hashemi J. Sex-based differences in the anthropometric characteristics of the anterior cruciate ligament and its relation to intercondylar notch geometry: a cadaveric study. The American Journal of Sports Medicine 2005;33(10):1492-8.
[29] Murshed KA, Çiçekçibaşı AE, Karabacakolu A, et al. Distal femur morphometry: a gender and bilateral comparative study using magnetic resonance imaging. Surg Radiol Anat 2005;27(2):108-12.
[30] Didia BC, Nwajagu GN, Dapper DV. Femoral intercondylar notch (ICN) width in Nigerians: Its relationship of femur length. West Afr J Med 2002;21(4):265-7.
[31] Muneta T, Takakuda K, Yamamoto H. Intercondylar notch width and its relation to the configuration and cross-sectional area of the anterior cruciate ligament. A cadaveric knee study. Am J Sports Med 1997;25(1):69-72.
[32] Vaidya SV, Ranawat CS, Aroojis A, et al. Anthropometric measurements to design total knee prostheses for the Indian population. J Arthroplasty 2000;15(1):79-85. [33] Berger RA, Rubashm HE, Seel MJ, et al. Determining the
rotational alignment of the femoral component in total knee arthroplasty using the epicondylar axis. Clin Orthop Relat Res 1993;286:40-7.
[34] Mussini C, Crevecœur I, Garralda MD, et al. A new neandertal femoral diaphysis from Les Pradelles (Marillac-le-Franc, Charente, France). Period Biol 2012;114(1):117-23.
[35] Datta M, Srimani P, Saha A. Morphometric analysis along with estimation of total length of femur among populatiın of West Bengal. Int J Anat & Res 2016;4(4.1):2945-9.
[36] Kalaycı CB. Femur interkondiler çentik genişliği ve ön çapraz bağ yırtıkları ile ilişkisi. Uzmanlık Tezi. Göztepe Eğitim Ve Araştırma Hastanesi Radyoloji Kliniği. Istanbul 2009.
[37] Anderson AF, Dome DC, Gautam S, et al. Correlation of anthropometric measurements, strength, anterior cruciate ligament size and intercondylar notch characteristics to sex differences in anterior cruciate ligament tear rates. The American Journal of Sports Medicine 2001;29(1):58-66.
[38] Singh S, Singh SP. Weight of the femur - a useful measurement for identification of sex. Acta Anat (Basel) 1974;87(1):141-5.