COMPARISON OF TOURISTS’ AND EMPLOYEES’
EVALUATIONS REGARDING SERVICES
HİZMETLERE İLİŞKİN TURİST VE ÇALIŞAN DEĞERLENDİRMELERİNİN KARŞILAŞTIRILMASI
Ali SAYILIR
Muğla University, Faculty of Economics and Administrative Sciences
Umut AVCI
Muğla University, Ortaca Vocational CollegeABSTRACT: A survey was conducted in Muğla Region to find out, on one hand,
whether there are differences between tourists’ evaluations of hospitalities’ performances and employees self-evaluations, and on the other hand whether evaluations of tourists from various countries differ. Tourists’ and service providers’ evaluations in six constructed areas differed significantly only in two areas: “attitudes” and “behaviors and skillfulness”. Tourists’ evaluations in the mentioned areas are significantly higher than those of employees. When it comes to the second issue, the study shows that there are some significant differences between Russian tourists’ evaluations and Western nationalities’ evaluations, those of British, Germans, Dutch, and Scottish. Also, Belgians’ evaluations were set apart from those of the mentioned nationalities in “attitude of employees”.
Key words: Tourists’ and employees’ service performance evaluations, hospitality
entities, culture.
ÖZET
:
Turistlerin uyruklarına bağlı olarak konaklama işletmelerinin hizmet performansı hakkındaki değerlendirmelerinin farklılık arz edip etmediğini saptamak ve turistler ile hizmet verenlerin değerlendirmelerini karşılaştırmak amacıyla Muğla İli’nde bir tarama (survey) çalışması yapılmıştır. Altı alanda yapılan hizmet performans değerlendirmeleri karşılaştırmalarından sadece ikisinde (“tutumlar” ve “davranışlar ve beceriler”) turist ve personelin karşılaştırmalarında anlamlı düzeyde farklılık çıkmıştır. Bu iki alanda turistlerin değerlendirmeleri daha yüksektir. İkinci konuya gelince, Batılı ülkelerden olan İngiliz, Alman, Hollandalı ve İskoçların değerlendirmeleri ile Rusların değerlendirmeleri arasında önemli farklılıklar bulunmuştur. Ayrıca, Belçikalı turistlerin değerlendirmelerinin “çalışanların tutumları” konusunda Alman, İngiliz, Hollanda ve İskoçların değerlendirmelerinden anlamlı düzeyde farklılık bulgulanmıştır.Anahtar kelimeler: Turist ve çalışan hizmet performans değerlendirmesi,
konaklama işletmeleri, kültür.
1. Introduction
A producer or a service provider would like to see a customer repeating purchases or to see him satisfied since a business survival depends on that (Rao, 2002). Perception is seen as a gateway to behavior (Aygris, 1995: Engel at al., 1993: 392). The process of perception and evaluation is governed by cognitive functioning
(Yüksel, 2001) or cognitive frameworks (Kim, 1993), which are at least partly determined by culture (Michel et al., 2004; Laroche et al., 2004) and other environmental forces (we are what we eat). The mentioned sequential relation could be an explanation for why people from different cultures might perceive or evaluate and respond to the same stimulus somehow differently. Given this explanation and knowing that hospitality entities host people from different cultures, hospitality workers generally serve tourists with various cognitive frameworks from numerous cultures. Hence, the success of services that will satisfy tourists’ needs, at least partly, depends on the fit between hospitality workers’ evaluations about their services and tourists’ evaluations about the same services.
One may question why management should bother about employees self-evaluations; however, despite the fact that management establish performance standard, employees conduct behavior. Management needs to show and make employees understand their misperception about their efficiency and behavior. A comparison between tourists’ evaluations and employees’ self-evaluations might help to solve that problem. The tourists’ evaluation of these services is the important one (Yüksel and Yüksel, 2001), not that of the employees because the degree of fulfillment of tourists’ needs is guided by the tourists’ cognitive frameworks through perception of those services.
One aim of the study is to identify the discrepancies in evaluation of services, if any, between service providers and service receivers. Knowing the gap between service providers’ evaluation and the service receivers’ evaluation about services might enable us to suggest how to influence the service receivers’ evaluation in a desired
direction (Parasuraman at al., 1985). The second aim of the study is to see whether
the degree of fitness changes depending on cultural distances. Finding out any differences originating from cultures might help management to develop better approaches to fulfill these differences since managers need to respond positively and effectively to practices and values that may be drastically different from what they are accustomed to (Javidan and House, 2001).
2. Road to Discrepancies
Several studies (Argyle et al. 1986; Gilbert and Wong 2003; Laroche et al. 2004; Laroche et al. 2001; Quelch and Klein, 1996) suggest that cultural differences affect expectations and perception. Moreover, some argue that perception is unique to each individual (Schiffman and Kanuk, 2001: 122; Moorhead and Griffin, 1989: 56). People might evaluate a performance differently because of their cultural background, their uniqueness, their expectation, a product’s or service’s quality itself, etc. Perceived performance is shown to affect satisfaction and perceived service quality (Halstead, Hartman, and Schmidt, 1994). Behavioral norms vary form culture to culture. Therefore, customers from various parts of the world may have different psychological states for adequate and satisfying services (Bolton and Myers, 2003).
In tourism entities various people with different tastes, drinking habits, perception of adequate hygiene level, etc. from all over the world are hosted. A Russian may be satisfied with much more vodka; a German may be much more demanding on services timeliness (Hall, 1976); a man from London may be keen on entertainment facilities, etc. Hall’s low-context and high-context culture concept, Hofstede’s four dimensions and later five dimensions of culture try to conceptualize cultural differences. This study is not going to explain Hall’s and Hofstede’s concepts here, but the concepts are related to this study since each nation is taken as a proxy for the culture of each country. Especially, Hall’s perception of time and low-high context cultures and Hofstede’s uncertainty avoidance, power distance and individualistic-collectivist cultures dimensions form a base for the idea that people from different countries may have different psychological states for adequacy of services in tourism industry. Although sub cultures exist within any country, in this study we are not able to consider such sub cultures.
One caution is needed to be underlined here: the idea that adequacy of services might say different things to various people from different countries do not mean that tourists’ evaluations of services always diverge. This is because humankind, in any culture, has similar tastes and feelings toward various foods and behaviors. In another word, besides differences, there are common tastes or behavioral norms in cultures as shown in several studies (Argyle et al., 1986; Knutson et al., 1991; Patton et al., 1994). The point is that due to their culture some people may evaluate a performance excellent whereas some others may evaluate the same performance moderate. However, all of them might evaluate performance positively and indicate a systematic difference among them due to their culture. Therefore, one question that this study tries to answer is to determine whether people from different culture evaluate the same performance differently. Hence, H1 hypothesis follows.
H10=Performance evaluations of tourist entities do not differ according to tourists’
nationalities.
H1a=Performance evaluations of tourist entities differ according to tourists’
nationalities.
The studies second question is to find out whether tourists’ and employees’ self-evaluations differ. Bowen and Clarke (2002: 298) imply that employees’ reference point for evaluation of services and those of guests might well diverge. A receptionist or a bellboy is naturally subjective about his or her services, as well as the tourists receiving these services. Then, H2 hypothesis follows.
H20= Performance evaluations of tourist entities and employees’ self-evaluations do
not differ.
H2a= Performance evaluations of tourist entities are less favorable than employees’
3. Method
The difference between customers’ expectations and customers’ perceptions is measured as service quality by Parasuraman et al (1985, 1988). Although constructing an instrument that measures service quality is not an easy task (Parasuraman et al., 1985; Brown and Swartz, 1989; Carman, 1990; Garvin, 1983), there are numerous developed instruments that try to measure service quality or related concepts (see Parasuraman et al., 1988; Knutson et al., 1991; Knutson et al., 1995; Reisinger and Turner, 1999). Development of various instruments is a natural result of trying to measure numerous service provider entities’ activities since each service segment like hospitals, restaurants, recreational facilities, educational facilities, etc. have different service dimensions.
Hence, we take a different approach to service quality measurement. Instead of measuring service quality, we compare service receivers’ evaluations to those of serving employees. At the end, the important thing is not the quality of services, but the evaluations of tourists and their satisfaction. Although service quality might lead to satisfaction, performance measurement is a better indicator of satisfaction which is a very important factor in purchasing decision (Cronin and Taylor, 1992).
In order to find out whether consumers’ and servers’ evaluation differ, a survey covering Muğla region was conducted. About %80 of tourists visiting Turkey uses tour operators (Turizm İstatistikleri, 2005, s. 40-48). We tried to imitate systematic sampling by picking up tourists returning to their homes through tour operators each Saturday. The questionnaire we used in our study was developed via reviewing several studies (Parasuraman at al., 1985; Yüksel, 2001; Reisinger and Turner, 1999). Instruments like SERVQUAL and LODGSERV are not used since it is thought that, due to their wordings and inadequate coverage of statements, they are not well suited to this study’s aim. Forty statements with a scale of seven point from awful to excellent were selected and the questionnaire was handed to 27 tourists for a pilot examination. The examination resulted in 36 questions. At the first stage, the questionnaires were handed to 350 tourists returning to their homes each Saturday from May to October of 2004. From these questionnaires 29 were discarded because of incomplete information. One open-end question in the questionnaire asks for stayed hotel or resort. In the second stage, the questionnaire was translated into Turkish and delivered to 2 employees (either receptionists or servers) working for each hotel or resort whose names were gathered from tourist questionnaire. Gathered hotel names were 64, but 12 were not accessible (they did not want to join the study since they do not have time). In this way, we got eligible 321 questionnaires from foreign tourists and 104 questionnaires from employees that served these tourists. In 2004, about 2.5 million foreign tourists visited the region. A table of these tourists’ nations and our sample’s nations can be seen from Appendix A. From the table, it can be seen that our sample is biased toward British tourists. Thus, the adequacy of our sample should be taken cautiously. In the same appendix, also some demographic characteristic are provided. Female tourists are %58 of the sample. About 76 percent of tourists’ income is between €15000-34999.
It is stated (Yüksel, 2001: 311; Parasuraman at al., 1985: 47) that evaluation of service quality needs to be based on multiple dimensions. Although we are not interested in directly measuring service quality, we need to decide what areas tourists and employees serving them should evaluate. In this sense, we partly fallowed Yüksel (2001), and questions related to physical quality of entities, to attitudes and to behaviors of serving employees and to reliability were included in the questionnaires. From tourists’ responses 6 variables, three related to physical quality, one related to attitudes, one related to behaviors, and one related to reliability were constructed through reliability analysis. These constructs are also confirmed by the analysis of responses from employees. However, Cronbah’s α analysis for employees’ responds is problematic for “sufficiency of food and beverages”, “hygiene level”, and “physical quality” variables. Statistics for each constructed variable can be seen in Appendix B.
4. Findings
We checked the averages for each month because tourists with different attributes may come at various times of a year. Evaluations of tourists for each month are depicted in Figure I. All averages of the evaluations are positive and higher than 4, as seen from Figure 1.
1
2
3
4
5
6
7
1 4 7 10 13 16 19 22 25 28 31 34
Statements
Sc
al
e
May June July August September OctoberFigure 1. Averages of Tourists’ Evaluations
However, there is no significant variation among group evaluations for each month. It seems that, at average, all evaluations are well positive. Only evaluations about statements 34 and 35 are close to 4; all others are above 5.
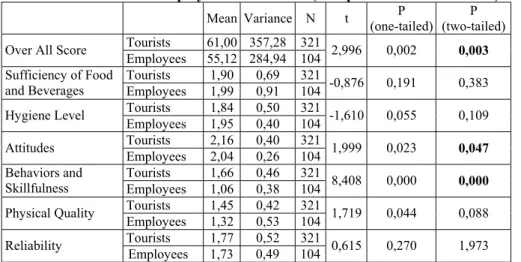
We went one step further and compared tourists’ and employees’ evaluations through t test. Before the t test run, “awful” transformed to -3, “very bad” to -2, “bad” to -1, “I do not know” to 0, “good” to 1, “very good” to 2, “excellent” to 3. Then, the test was run to see the evaluation levels which are depicted in Table 1.
Table 1.Tourists’ and Employees’ Evaluations (Unequal Variance Assumed)
Mean Variance N t (one-tailed)P (two-tailed) P Tourists 61,00 357,28 321
Over All Score
Employees 55,12 284,94 104 2,996 0,002 0,003 Tourists 1,90 0,69 321
Sufficiency of Food
and Beverages Employees 1,99 0,91 104 -0,876 0,191 0,383 Tourists 1,84 0,50 321 Hygiene Level Employees 1,95 0,40 104 -1,610 0,055 0,109 Tourists 2,16 0,40 321 Attitudes Employees 2,04 0,26 104 1,999 0,023 0,047 Tourists 1,66 0,46 321 Behaviors and Skillfulness Employees 1,06 0,38 104 8,408 0,000 0,000 Tourists 1,45 0,42 321 Physical Quality Employees 1,32 0,53 104 1,719 0,044 0,088 Tourists 1,77 0,52 321 Reliability Employees 1,73 0,49 104 0,615 0,270 1,973
From Table 1, it reads that over all mean score for tourist evaluations is more than that for employee evaluations. But, in sub areas only evaluations about attitudes and behavior and skillfulness significantly differ. The employees evaluate their colleagues’ attitude and behavior and skillfulness less favorably than tourists do. As stated above, all averaged tourists evaluation are positive. That is; at the average, tourists find the performances of 52 entities very well. When compared to employees’ evaluation, tourists’ evaluations for attitude and behavior and skillfulness are significantly higher. In the other four areas, there is not any significant difference between the two groups’ evaluations though tourists’ evaluations for sufficiency of food and beverages are less favorable. Therefore, H2 hypothesis is not supported.
The second aim of the study is to see whether tourists from various countries evaluate the performance in the constructed areas differently. To that aim, one way analysis of variance test was run. Each group of tourists whose number is more than 4 included in the test. Thus, the sample size was reduced to 312. ANOVA results for each construct are depicted in Table 2.
Table 2. One-way ANOVA for Each Area
Nationality Sufficiency of food Hygiene Level Attitude
Behavior and
Skillfulness Physical Quality Reliability
British (n191) 7.0052 9.0628 10.7696 13.6492 12.6754 7.0838 German (n 58) 8.1897 9.6207 11.0690 12.5000 13.6379 7.2414 Russian (n 23) 9.6522 11.6957 12.7391 15.8261 17.2609 8.9130 Dutch (n 24) 8.6250 8.1667 9.1250 11.1667 12.0833 6.2917 Belgian (n 5) 8.8000 9.4000 13.2000 13.8000 9.2000 6.6000 Scottish (n 11) 7.0000 8.1818 10.3636 12.1818 14.1818 6.7273 F value 4.168 3.272 4.072 2.31 3.457 2.361 P Value .001 .007 .001 .044 .005 .040
ANOVA tells us that, in all areas, tourists evaluations differ significantly. In other ways, tourists from each country evaluate each entities performance differently. Hence H1a hypothesis is supported. However, which group’s evaluations differ
from others’ is unclear. The following test tries to shed light on that issue.
4.1. Multiple Comparisons
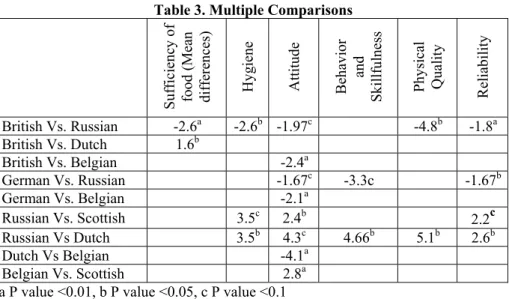
In order to find out evaluations of which groups differ, Dunnett T3 post hoc test was run since unequal variance assumed. Significant differences are depicted in Table 3.
Table 3. Multiple Comparisons
Suf fi ci enc y of food (M ean diffe re nces) Hygiene Attitu de B ehavi or and Sk illfu ln ess Physical Qu ality Reliab ility British Vs. Russian -2.6a -2.6b -1.97c -4.8b -1.8a British Vs. Dutch 1.6b British Vs. Belgian -2.4a German Vs. Russian -1.67c -3.3c -1.67b German Vs. Belgian -2.1a Russian Vs. Scottish 3.5c 2.4b 2.2c Russian Vs Dutch 3.5b 4.3c 4.66b 5.1b 2.6b Dutch Vs Belgian -4.1a Belgian Vs. Scottish 2.8a
a P value <0.01, b P value <0.05, c P value <0.1
Except the evaluations for behavior and skillfulness, British tourists evaluate the entities’ performance in all areas less favorably than Russian tourists do. Evaluations for the attitude of employees mostly differ significantly. This is the area that many groups’ evaluations differ significantly. Generally, Russian tourists’ evaluations are significantly favorable. Belgian tourists’ evaluations are significantly favorable when compared to British, German, Dutch and Scottish tourists’ evaluations for the attitude of employees. When it comes to reliability, again, Russian tourists’ evaluations are significantly more favorable than those of British, German, Dutch and Scottish.
5. Discussions
Parasuraman et. al. (1985) state one of the areas to be searched as the difference between service providers’ perceptions of service quality and those of consumers. We compared evaluations of employees about their services and their facilities to those of tourists that they hosted. The results (Table 1) show that employees evaluate their performance in attitude and behavior and skillfulness significantly less favorably than tourists do. But, the differences between tourists’ evaluations and those of employees are not significant in sufficiency of food and beverage, hygiene level, physical quality and reliability. These results tell us that employees in these 52 hospitality entities may undermine their skills and politeness, as well as their attitude towards tourists. One explanation for these results might be that employees know each other and the management better than tourists do. Employees are able to observe their colleagues’ behavior and feel their intention better than a tourist is able to do. A second explanation might be that employees’ perceptions about tourists’
expectations are very high. But, from the management point of view, these results have positive implications since the gap between tourists’ evaluations and employees’ evaluations is favorable. Moreover, specifically for the 52 hospitality entities in this study, results seem to be very agreeable since the evaluations for six constructed areas are between “good” and “very good”.
Also, the results might give some clues about the favorable trend of incoming tourists’ number. In the past, it was believed that the rise in numbers of tourists visiting Turkey was due to cheap prices. But, for the last 2-3 years it is hard to say that prices in Turkey are getting cheaper than those of Spain or Greece1. Yet, the
number of incoming tourists has increased, so far2. Quality of services might very
well have an important role in the mentioned trend.
The second aim of the study is to see whether tourists of different nationalities evaluate performances of entities differently. “The one way ANOVA” for each area of constructs shows us that there are some significant differences among tourist groups’ evaluations. Russian tourists, mostly evaluate performances of the 52 hospitalities more favorably than does the other western nationalities, except Belgians. This result supports arguments about the Russian culture. Javidan and House (2001) found that Russians are in the least performance oriented group. One may expect that Russians may evaluate the same performance higher than Germans, Dutch, or British do. This is understandable because service quality standards in Russia might be lower than those in Western countries. Belgians also stand away from British, Dutch, German and Scottish when it comes to evaluate attitudes of employees, but the result about the Belgian group should be evaluated cautiously since the size of the Belgian group is too small. This result is also in parallel with scores about power distance and uncertainty avoidance obtained in Hofstede’s study (1991). Another point that is in concordance with the mentioned study is the similarities among Germans’, British’s, Scottish’s and Dutch’s evaluations.
In this study, we have seen that tourists from different countries might differ in performance evaluations. Also, a relatively distinguishable approach to the issue of service quality is attempted. To a manager, it is better to see his employees’ perceptions of their services beside his or her hospitality’s consumers’ evaluations since the manager will get a chance to improve the gap between the service providers’ and customers’ evaluations if there is any unfavorable gap.
Several cautions need to be considered about validity and generalization of the study’s results. First, the sample was taken only from tourists visiting Muğla Region, and the results may represent only this tourist group with some bias. Second, using nationalities as proxies for cultures is in dispute. Third, the constructs used in the study need to be further refined.
In future studies, it will be better to focus on antecedents of satisfaction for each country or culture due to satisfaction importance for repeating sales. However, this will require the issue to be taken in two separate areas: factors related to service providers and factors related to tourists themselves and outside of entities’ domains.
1 See www.oecd.org/dataoecd/61/54/18598754.pdf for comparative price indices. 2 See http://www.turizm.gov.tr for getting number on visiting tourists.
References
ARGYLE, M., HENDERSON, M., BOND, M., LIZUKA, Y., CONTARELLO, A. (1986). Cross-cultural variations in relationships rules. International Journal of
Psychology, 21(33), pp.287-315.
ARGYRIS, C. (1995). On organizational learning, Blackwell Publisher, Inc.
BOLTON, R.N., MATTHEW, B.M. (2003). Price-based global market segmentation for services. Journal of Marketing, 67 (3), pp. 108-128.
BOWEN, D., CLARKE, J. (2002). Reflections on tourist satisfaction research: past, present and future. Journal of Vacation Marketing, 8 (4), pp. 297-308.
BROWN, S.W., TERESA, A.S. (1989). A gap analysis of professional service quality. Journal of Marketing, 53 (2), pp. 92-98.
CARMAN, J. M. (1990). Consumer perceptions of service quality: an assessment of the SERVQUAL dimensions. Journal of Retailing, 66 (1), pp. 33-55.
Comparative price level, MEI. (2006), p.269. Available from: <www.oecd.org/
dataoecd/61/54/18598754.pdf>, [Accessed November 2006].
CRONIN, J.J., TAYLOR, S.A. (1992). Measuring service quality: a reexamination and extension. Journal of Marketing, 56 (3), pp. 55-68.
ENGEL, J.F., BLACKWELL, R.D., MINIARD, P.W. (1993). Consumer behavior, (7th Edition), the Dryden Press.
GARVIN, D.A. (1983). Quality on the line. Harvard Business Review, 61(5), pp. 65-73.
GILBERT, D., WONG, R. K. C. (2003). Passenger expectations and airline services: a Hong Kong based study. Tourism Management, 24 (5), pp. 519-532. HALL, E. T. (1976) Beyond culture, Garden City, NY: Doubleday.
HALSTEAD, D., DAVID H., SANDRA L. S. (1994). Multisource effects on the satisfaction formation process. Journal of the Academy of Marketing Science, 22 (2), pp. 114-129
HOFSTEDE, G. (1991). Culture and organizations: software of the mind, McGraw-Hill. JAVIDAN, M., HOUSE, R.J. (2001). Cultural acumen for the global manager
lessons from Project Globe. Organizational Dynamics, 29 (4), pp. 289-305 KIM, D. H. (1993). The link between individual and organizational learning. Sloan
Management Review, 35(1), Fall, pp. 37-49.
KNUTSON B., STEVENS P., PATTON M. (1995). Dineserv: measuring service quality in quick service, casual/theme and fine dining restaurants. Journal of
Hospitality and Leisure Marketing, 3(2), pp. 35-42.
KNUTSON B., STEVENS P., WULLAERT C., PATTON M., YOKOYAMA F. (1991). Lodgserv: a service quality index for the lodging industry. Hospitality
Research Journal, 14 (2), pp.277-284.
LAROCHE, M. U., LINDA C., ABE, S., CLEVELAND, M., YANNOPOULOS, P. P. (2004). Service quality perceptions and customer satisfaction: evaluating the role of culture. Journal of International Marketing, 12 (3), pp. 28-58.
LAROCHE, M., KIRPALANI, V.H., PONS, F., ZHOU, L. (2001). A model of advertising standardization in multinational corporations. Journal of
International Business Studies, 32 (2), pp. 249-266.
MOORHEAD, G., GRIFFIN, R.W. (1989). Organizational behavior, Second Edition, Houghton Mifflin Company.
PARASURAMAN, A., VALARIE A.Z., LEONARD L.B. (1985). A conceptual model of service quality and its implications for future research. Journal of
. (1988). Servqual a multiple-item scale for measuring consumer perception of service quality. Journal of Retailing, 64 (1), pp. 12-40.
PATTON M., STEVENS P., KNUTSON B. (1994). Internationalizing lodgserv as a measurement tool: a pilot study. Journal of Hospitality and Leisure Marketing, 2 (2), pp. 39-55.
RAO, N. (2002). Reorienting HRD Strategies for tourists’ satisfaction. Journal of
Services Research, 2 (1), pp. 96-106
REISINGER, Y., TURNER, L. (1999). A cultural analysis of Japanese tourists: Challenges for tourism marketers, European Journal of Marketing; 33 (11/12), pp. 1203-1227.
SCHIFFMAN, L.G., KANUK, L.L. (2001). Consumer behavior, (7th Edition), Prentice Hall.
T.C. Kültür ve Turizm Bakanlığı. (2006). Available from: <http://www.turizm.
gov.tr>, [Accessed November 2006].
Turizm istatistikleri 2005. Kültür ve Turizm Bakanlığı Yatırım ve İşletmeler Genel
Müdürlüğü Yayını, Ankara.
YÜKSEL, E. (2001). The validation of generic service quality dimensions: an alternative approach, Journal of Retailing and Consumer Services, 8 (6), pp. 311-324.
YÜKSEL, A., YÜKSEL, F. (2001). Measurement and management issues in customer satisfaction research: review, critique and research agenda: part two.
Journal of Travel and Tourism Marketing, 10 (4), pp. 81-111.
Appendix A.
Sample Dispersion and Demographic Characteristics of Tourists
Sample Dispersion
Nationality Region’s Dispersion Percentage Sample’s Dispersion Percentage
Germany 245.963 11% 58 18% Belgium 116.290 5% 5 2% Netherlands 325.247 14% 24 7% UK 835.979 36% 202 63% Russian Federation 122.332 5% 23 7% Others 659.847 29% 9 3% Total 2.305.658 100% 321 100%
Demographic Characteristics of Tourists
Age Sex Education Level Annual Income
Less than 25 40 135 male N/A 20 Less Than €15000 24 Less than35 65 186 female Secondary School 60 Less Than €25000 243 Less than 45 91 High School or Equivalent 99 Less Than €35000 54 More than 45 125 Undergraduate 47
Graduate 95
Appendix B
ConstructsHow would you evaluate:
(1. Awful, 2. Very bad, 3. Bad, 4.I do not know, 5. Good, 6. Very good, 7. Excellent)
Coranbach’s α for Tourists’ Response Coranbach’s α for Employees’ Response Sufficiency of Foods and Beverages
20. Availability of dishes liked 21. Variety of dishes
22. Availability of local dishes 23. Availability of beverages liked
0,84 0,81
Hygiene Level
9. Employees’ appearance and cleanliness 24. Healthy food choice
25. Hygiene level of dishes 26. Hygiene level of shared places 27. Tidiness and cleanliness of rooms
0,78 0,71
Attitude
2. Servers’ politeness
3. Responsiveness of management to your problems
5. Management and staff’s willingness to help 12. Respectfulness of Employees
15. Hospitality of employees
0,82 0,80
Behavior and Skillfulness
4. Knowledge of personnel about their profession 6. Management and staff’s communication ability 7. Proficiency of staff
8. Employees’ carefulness while working 10. Service speed
14. Employees’ capacity to answer your needs 16. Employees’ capacity to solve problems 17. Employees’ ability to empathy tourists
0,87 0,75
Physical Quality
1. Your hosting place’s location 28. Crowd level of shared places
29. Convenience of beaches, entertaining and shopping centres
30. Convenience of facility’s operating hours 31. Noise level at hosting facility
32. Noise level of surrounding area 34. Level of children facilities 35. Facilities for sport 36. Facilities for entertainment
0,78 0,62
Reliability
11. Accuracy of information provided by Employees
13. Trustfulness of Employees
18. Promptness of information provided by hosting facility
19. Protection of physical safety and values of tourists by hosting facility