The Effects of Debt Intolerance and Public Debt Sustainability
on Credit Ratings: Evidence From European Economies
BETAM WORKING PAPER SERIES #011 APRIL 2013
The effects of debt intolerance and public debt sustainability on credit ratings:
Evidence from European economies
Ata Ozkayaϒ
Summary
The question whether a government’s fiscal policy is consistent with an intertemporal budget constraint has been motivated a number of empirical studies. The econometric approach focuses on the circumstances under which a government is able to sustain its budget deficits without defaulting on its debt. In this contribution, by linking the different motives on long-run sustainability of public debt, we develop a compact step-wise test algorithm and apply that to the PIIGS countries and United Kingdom. Secondly, we introduce phase-space reconstruction methodology in order to locate the path for debt dynamics, which enables us to observe fiscal policy implications in short and medium-term. We conclude that Greece, Ireland, Portugal are characterized by unsustainable debt policies. For Italy, Spain and United Kingdom, we could not reach clear cut results. For those economies while the outcome of test algorithm indicates the sustainability of debt policy, phase-space examination shows that the reaction of the governments to diverging debt stock GDP ratio cannot be sufficient to stabilize the path for debt dynamics. Last, we measure relative credit ratings of 25 OECD countries, including Turkey and eurozone economies. Our measurement method is based on the fundamentals used for measuring public debt sustainability: GDP per capita, change in Consumer prices (CPI), and GDP ratios of; General government budget balance, General government primary balance, General government gross debt stock, Current account balance, Public foreign currency debt stock. For each country, these seven inter-related criteria are examined during three non-overlapping periods: 2005-2010, 2011 and 2012-2013. We conclude that the countries that have trouble with debt sustainability have overestimated sovereign credit ratings and hence they will eventually be revised.
ϒ Galatasaray University GIAM. Ciragan Cad. No:36 Ortakoy 34357 Istanbul-Turkey. Tel: +90 2122274480, Fax: +90 2122582283, e-mail:[email protected]; [email protected]
1 Introduction
In a recent paper, Reinhart and Rogoff (2011) note that since the problems of external default, domestic default and inflation are all integrally related, the overt default on (or repudiation) and rescheduling of public debt are hidden behind the high inflation, banking crises, currency crashes, and debasements which often go hand in-hand with default. Large public deficits and high levels of public debt over GDP are important factors that affect the budget process of public sector. According to findings of Polackova-Brixi et al. (2001), even though the stock may be initially manageable, if public liabilities persistently augment, they may present a threat to future fiscal policy, solvency and sustainability, which have come to the forefront of stabilization policy in the recent years. The questions of whether a given level of public debt is sustainable and/or whether large and persistent deficits will lead a government to default became common concerns for both the developed and the less-developed countries1. Without balanced budgets the accumulating deficits leads to unstable rise in public debt stock (Reinhart and Rogoff 2008). Over the last decades a lot of European countries have suffered from steadily high public deficits2. This trend still represents a serious problem from the economic and political point of view, especially for members of the European Monetary Union.
The related theoretical literature emphasizes the intertemporal budget constraint as well as the flow-budget constraint of the government, and focuses on whether current fiscal policy can be followed without disturbing government solvency. At the level of empirical policy analysis, the “fiscal sustainability” remains highly ambiguous, and nearly each empirical study attempts to develop its own definition of the concept and derive its conclusions accordingly. Mainly, three different motives for debt repayment are mentioned in the literature (Eaton 1989; Dreher et al. 2006): “Illiquidity”; “unwillingness-to-pay”(insufficient incentive to repay), and “insolvency” (inability-to-pay).
1 Corsetti and Roubini (1991)and Chalk and Hemming (2000)focus on fiscal sustainability in the OECD economies and announce rather mixed results. Following the Stability Growth Pact and the Maastricht Treaty fixing maximum values for the deficit (3% of GDP) and net public debt (60% of GDP), the budgetary policy in Europe has been a matter of concern, see Buiter (2003). The sustainability of the fiscal policy as well as the solvency of the governments in the less developed countries’ have received great attention from the IMF and the World Bank. Among others, see Buiter and Patel (1992)for India, Gerson and Nellor (1997)for Philippines, Bascard and Razin (1997)for Indonesia, and Agénor (2001)on Ghana and Turkey.
In perspective of empirical analysis, the applied literature with regard to the ability-to-pay approach can be considered to have mainly followed two main paths. First, according to the country risk (or debt servicing capacity) models, a country's prospects of repaying the funds borrowed are evaluated by a variety of economic indicators, usually in the form of aggregate ratios such as primary surplus/GDP, debt/GDP, debt/exports and debt-service/exports (see a.g. Blanchard 1990; Cuddington 1997; Croce and Juan-Ramon 2003).
The second path in the applied literature, the “standard approach” or the econometric approach for sustainability, focuses on the sustainability of debt policies in the long-run sense. All that is required (i.e., the solvency condition) is that the present value of the flow of future primary surplus is not less than the net current indebtedness. Specifically, the nonsatationarity analysis provides useful tools in gaining deep insight into the long-run implications of a government or a country's intertemporal solvency. By using intertemporal budget constraint the tests determine whether a government is able to sustain its budget or external deficits without defaulting on its debt. Such tests are first found in the literature regarding a government's solvency (or the sustainability of fiscal deficits), beginning with the contribution by Hamilton and Flavin (1986), and developed by Wilcox (1989), Trehan and Walsh (1991), Hakkio and Rush (1991), Buiter and Patel (1992), Tanner and Liu (1994), Bohn (1995), Wu (1998), Makrydakis et.al. (1999). In this paper we resort to the studies by Trehan and Walsh (1991), Hakkio and Rush (1991) and Bohn (1995) which have received considerable attention in economics. Firstly, these three different motives on public debt and fiscal policy sustainability are re-examined, and linked to form a compact step-wise test algorithm. This step-wise econometric test procedure enables us to perform a deeper analysis for public debt sustainability. Secondly, we observe that the period under consideration covers the recent global financial crisis process and especially its effects on European countries’ public finance policies, which may generate possible nonlinearities on the observed data. Thus, we aim to strengthen our findings for sustainability of debt policy and also we intend to make a smaller contribution to the literature that goes beyond linear estimation techniques in that area and that tries to find structural breaks, thresholds or possible nonlinearities (see e.g. Bajo-Rubio et al. 2004; Martin 2000; Payne et al. 2008; Westerlund and Prohl 2010; Fincke and Greiner 2011).
We present a different simple method, namely the “non-standard approach” for sustainability, which enables us to visualize the path for debt dynamics i.e., moving from some
initial stable “equilibria” and diverging through unsustainable values. To do this, we revisit dynamical systems literature, more specifically Takens’ theorem for phase-space reconstruction (Takens 1981; Eckmann et al. 1987). Our motive to introduce phase-space reconstruction in sustainability analysis is that the fiscal policy may exhibit deterministic character in most of its duration (Fincke and Greiner 2011) and that “standard approach” focuses on long-run implications, having possible drawbacks to distinguish between more vulnerable3 countries in the short and medium-term. Given the limitations of conventional debt sustainability analysis4, the nonlinear dynamical analysis methods provide different insights into debt analysis and bears on a novel concept introduced by Reinhart and Rogoff (2003) to identify the “debt intolerant” countries. The debt intolerancemanifests itself in the extreme duress many middle-income countries experience at overall debt levels that would seem quite manageable by the standards of the advanced industrial economies.
The phase-space examination of time-evolution characteristics of debt dynamics has an economic intuition: if the government’s debt policy remains stable, depending on some pre-determined benchmark scenario then we are able to observe that public debt GDP ratio values move closer to some “attracting5” set. This movement shows us whether the path for debt dynamics is sustainable or not, respectively corresponding to convergence or divergence of those values on phase-space. In its policy approach in determining whether a fiscal position is sustainable, the IMF is observed to apply the following steps6: (i) based on the available data, a projection with a five-year horizon is made assuming that the current fiscal policy is to be continued. This is regarded as the benchmark scenario. (ii) From this projection, a path for debt dynamics is generated and its sustainability is assessed. It is possible that different criteria are used for sustainability, but an increasing debt ratio is usually regarded as a cause for concern. (iii) If the path for debt dynamics is indicated as “unsustainable”, an alternative scenario is prepared, making necessary corrections on fiscal policy variables, which will typically define a “stable path” over the medium-term. Thus, the “non-standard approach” enables us to observe the consistency of such benchmark scenarios in ex-ante sense. We have to note that we do not consider the central bank when dealing with the question of under which conditions a given path of public debt is sustainable. We do this because central banks
3 We refer to the term “vulnerable” in sense of deterioration of both fiscal policy and budget process. 4 For a detailed discussion please refer to section 3, Rogoff et al. (2003).
5 Attracting set definitely refers to the attractor on phase-space, corresponding to unique or multiple “equilibria”.
6 See, Chalk and Hemming (2000) and Agénor and Montiel (1999, chap.13). The IMF’s official programming model, known as the Polak model, see Polak (1997).
are independent and governments should not rely on central banks to reduce public debt when deciding about debt and deficits.
The rest of the paper is organized as follows. Section 2 presents the data. Section 3 develops a step-wise algorithm for econometric analysis. Section 4 presents the results of econometric analysis performed for selected countries. Section 5 introduces the phase-space reconstruction methodology and presents the results. In section 6, we measure relative credit ratings of selected OECD countries, which includes the eurozone economies subject to previous sections. Our measurement method is based on GDP per capita, change in Consumer prices (CPI), and GDP ratios of; General government budget balance, General government primary balance, General government gross debt stock, Current account balance, Public foreign currency debt stock. Section 7 finally, summarizes the central findings.
2 Data
The countries7 considered in our study are Ireland, Italy, Greece, Portugal, Spain and UK. Ireland, Italy, Greece, Portugal and Spain are belong to the so-called PIIGS countries that have been characterized by large deficits and debt to GDP ratios recently that have raised questions about sustainability of their debt policies respectively. UK is included as a “control” country (to bear on the implications of debt intolerance) because it is among largest economies in Europe. The common period chosen for quarterly data is 1999Q1-2012Q2. The data is obtained from Eurostat Public Finance database. The debt stock data begin from 1999Q1 for all EU countries. On the other hand, for some other variables, the data of some countries go back through 1989Q1, i.e., expenditures and revenues of UK and Italy. However, the analysis including debt stock as a variable begins from 1999Q1. In order to account for the size of the different countries in the EU, public debt is usually expressed in terms of ratios, mostly relative to GDP. This measurement is also resorted to in the Convergence Criteria of the Maastricht Treaty of the EU.
7 Those countries have to stick to the Convergence Criteria of the Maastricht Treaty of the European Union and to the Stability and Growth Pact, which limits public deficits to three percent of GDP and public debt to 60 percent of GDP.
3 Econometric approach to debt sustainability: Long-run implications
In empirical debt stock sustainability literature the “standard approach” is based on the equation of the time evolution of public debt and hence on general budget identity. We consider Eq.(1). BT =
(
1+iT)
.BT−1 +GT −TT (1)where B is the volume of public debt at the end of period T, T i the nominal ex-post interest T
rate during period T, G the volume of public spending excluding interest payments and T T T
volume of taxes. To simplify the argument, we have not taken into account explicitly seignorage revenues, so that they find themselves in the ex-post interest rate.
The econometric tests of sustainability are based on the “stationarity” analysis. Thus, public debt stock will be accepted to be sustainable if it exhibits stationary behavior. Otherwise, we should consider the causes of nonstationarity8. Two possibilities are reported in literature: either the transversality condition does not hold or the sum of the present values of anticipated deficits is not stationary. Trehan and Walsh (1991) show that the convergence of the present value of the deficit signifies the satisfaction of the transversality condition. For the present value of the deficit to converge, the total budget balance has to be stationary. Secondly, Hakkio and Rush (1991) suggest that a necessary and sufficient condition for sustainability is the existence of at least one cointegration relation between total revenues and total expenditures with cointegrating vector of a particular type. Finally, Bohn (1995) proposed a test for sustainability based on a cointegration relation between primary balance and debt stock. One may also consider the role that the maturity may play. If the average maturity is assumed to directly affect the interest
rates, then the model of Bohn captures it. Bohn (1995) state that the government has to satisfy an intertemporal budget constraint and associated transversality condition regardless of the level of the safe interest rate. Secondly, Hakkio and Rush (1991) assume that all government bonds have one period maturity.
3.1 Test algorithm
The test algorithm that we follow is given below. The variables which take place in algorithm are in real terms over real annual GDP.
8 “Nonstationarity” covers the integrated process of order 1 ≥
Step 1: Stationarity (unit root) test is applied for debt stock (B) over GDP annual (GDPA) in real
terms. If it is estimated to be stationary, the algorithm ends. If it is estimated to be nonstationary then the algorithm goes to step 2.
Step 2: a.) First, we test the stationarity of primary surplus (PS) over GDP and if it is stationary
then the debt stock is not sustainable and algorithm goes to the Step 3.
b.) If primary surplus over GDP is nonstationary, we seek at least one linear combination of the
primary surplus over GDP and the debt stock (1-period lagged) over GDP that is stationary. If there is at least one, then debt stock is sustainable. Particularly, if primary surplus over GDP series is I(1) then algorithm goes to the Step 4.
c.) If there is no linear combination, then we test the stationarity of budget balance (BB) over GDP. If it is stationary then the sustainability exists. Otherwise, the algorithm goes to the Step 3. Step 3: a.) If there is at least one cointegration relation between total expenditures over GDP and total revenues over GDP, then the debt stock may be sustainable, depending on the value of estimated cointegrating vector. That is with a vector [1,-c] under the condition that 0 < c < 1. Step 4: a.) If there is at least one cointegration relation between primary balance (G-T) over GDP and debt stock over GDP, then we conclude that the debt stock is sustainable, implying both intertemporal budget constraint and transversality condition hold.
b.) Otherwise we decide that the debt stock is not sustainable.
To analyze stochastic behavior9 of a given series, we use three different test methods: Augmented Dickey-Fuller (ADF) test, Phillips-Perron (PP) test, and KPSS10 test. To analyze the multivariate process generated by revenues and expenditures, we have chosen to use the method proposed by Johansen (1991). The advantages of this method compared with Engle and Granger’s (Engle and Granger 1987) is that it allows us to test for the number of cointegration relations, it does not impose an arbitrary normalization on cointegrating vector and it permits us to test for constraints on the coefficients of the cointegration relation.
9 The estimation of lags are performed by both SIC, Hannan-Quinn and Akaike criteria. Where two methods give different lag values than each other, we choose the one estimated by SIC. Both E-views 5.00 and Stata 10 are used for the analysis. In order to conserve space, we do not locate here the details of estimation results. They can be supplied upon to request.
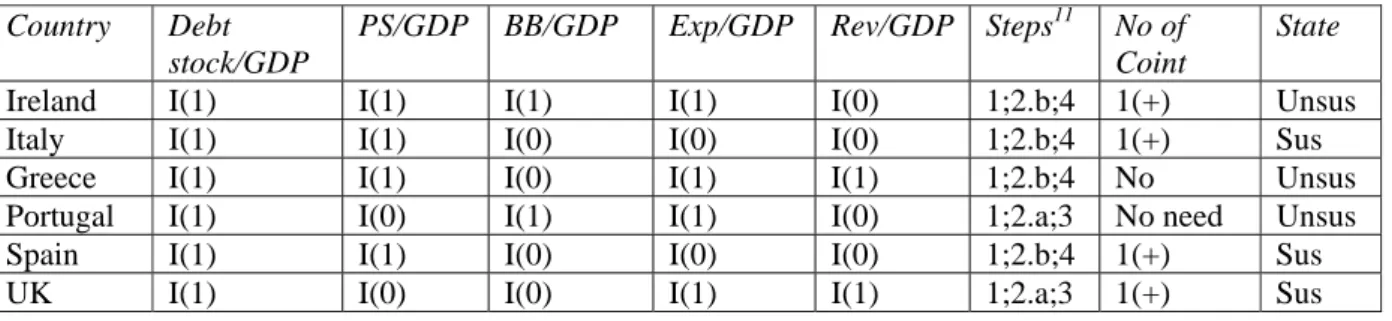
4 Results of standard approach
We employ the test algorithm that we introduce in section 3.1. Three types of unit-root tests are deployed: ADF, PP and KPSS test statistics. The overall results are given by Table 1. Each column consists of the result obtained from three tests: ADF, PP and KPSS test results respectively. In Table 1, the nonstationarity of some data is determined according to 2 affirmative and 1 negative test results while some other’s by 3 affirmative test results. The variables shown in Table 1 are in their real terms. The “steps” column in Table 1 defines the steps proposed in section 3.1. The second column in Tables 1 indicates debt stock over GDP, while the third, fourth and fifith columns refer to primary surplus/deficit, budget balance, expenditures and revenues over GDP , respectively. The “No of Coint” column depicts the estimated cointegration relationships based on Johansen and Juselius (1990) values. The sign shown in “No of Coint” column indicates the sign of estimated coefficient vector. The last column in Table 1 shows the state determined: “Sus” refers to sustainable while “Unsus” refers to unsustainablity of debt stock over GDP data.
Table 1 Results of the step-wise algorithm for the sustainability of debt stock over GDP Country Debt
stock/GDP
PS/GDP BB/GDP Exp/GDP Rev/GDP Steps11 No of Coint
State
Ireland I(1) I(1) I(1) I(1) I(0) 1;2.b;4 1(+) Unsus
Italy I(1) I(1) I(0) I(0) I(0) 1;2.b;4 1(+) Sus
Greece I(1) I(1) I(0) I(1) I(1) 1;2.b;4 No Unsus
Portugal I(1) I(0) I(1) I(1) I(0) 1;2.a;3 No need Unsus
Spain I(1) I(1) I(0) I(0) I(0) 1;2.b;4 1(+) Sus
UK I(1) I(0) I(0) I(1) I(1) 1;2.a;3 1(+) Sus
For Ireland, Greece, Spain, and Italy “Step 2.b and Step 4” are performed. Step 2.b and Step 4 consider that given primary surplus/deficit over GDP is nonstationary and particularly is I(1) then we should seek at least one cointegration between primary surplus/deficit and debt stock. The results are presented by Table 2. For Portugal and UK “Step 2.a. and Step 3” are performed. Step 2.a and Step 3 basically say that in case where primary balance over GDP exhibits I(0) behavior and if there is at least one cointegration relation between total expenditures over GDP and total revenues over GDP, indicating one-unit increase in revenues results with less-than-one unit increase in expenditures then debt policy is sustainable.
For Ireland, we look for cointegration between primary surplus/deficit and debt stock. Both Trace test and Max. eigenvalue test results indicate 1 cointegration relation with positive coefficient vector. Even though there exists cointegration relation, expenditures are I(1) and revenues are estimated to be I(0). It is straightforward that Ireland is bubble-financing its
expenditures, in which old debt that matures is financed by issuing new debt, implying Ponzi scheme. Therefore we conclude that the debt stock over GDP is not sustainable.
For Italy, Greece and Spain, we look for cointegration relation between primary surplus/deficit and debt stock. Both the Trace test and Max. eigenvalue test results indicate 1 cointegration relation with positive coefficient vector. We conclude for Italy that debt stock over GDP is sustainable. We have to note that, ADF and KPSS statistics values for both budget balance and expenditures of Spain is very close to critical values and if we work with 90% confidence interval, then we accept that both budget balance and expenditures of Spain is nonstationary, implying unsustainability of debt stock GDP ratio. For Greece, since primary surplus/deficit over GDP exhibits nonstationary character and particularly it is I(1), we do not look for whether budget balance is stationary or not, instead we seek cointegration relation between primary surplus/deficit over GDP and debt stock over GDP. We found that neither Trace test nor Max. eigenvalue test indicates cointegrating relation between primary surplus/deficit and debt stock. We conclude that debt policy of Greece is certainly unsustainable.
For UK, we look for cointegration relation between total expenditures and total revenues. Both Trace and Max. eigenvalue tests indicate 1 cointegration relation with positive coefficient vector, indicating that one-unit increase in revenues results with less-than-one unit increase in expenditures. Therefore, we conclude that debt stock over GDP is sustainable. For Portugal neither budget balance nor expenditures is I(0). Thus debt stock over GDP is not sustainable. We conclude that Portugal is bubble-financing its expenditures, in which old debt that matures is financed by issuing new debt, implying violation of transversality condition.
The drawback in most of the studies focusing on public debt sustainability in the aftermath of the global finance crisis is that, they omit the possibility of nonlinearity: during the crisis period the fiscal stimulus packages put heavy burden on the public finance while the low economic growth rates lead to further disruption of the debt dynamics. In this sense, debt dynamics may follow a nonlinear path, even a chaotic behavior. Therefore, we present a different simple method which enables us to visualize the path for debt dynamics i.e., moving from some initial stable “equilibria” and diverging through unsustainable values. The motivation behind is twofold. First, the observation and the treatment of a real process on time-domain may not yield all possible state variables. Either not all state variables are known or not all of them can be measured. However, due to the couplings between the system's component, we can reconstruct a phase-space trajectory
from a single observation by a time delay embedding (Takens 1981). Second, the phase-space construction is the fundamental starting point of many approaches in nonlinear data analysis12 and Russel Cooper states: “Economies that generate multiple equilibria are inherently nonlinear so that simple linear representations may be inadequate” (Cooper 2002, pg.7).
5 Chaotic approach to debt stock GDP ratio: Short and medium-term behavior
5.1 Theoretical background of phase-space analysis
This sub-section introduces the phase-space analysis methodology and theoretical basis for chaos analysis. The results are presented at the end of the sub-section.
Let us denote the dynamical system, g:Rn →Rn, with the trajectory,
( )
t tt g x
x+1= +η , where t=0,1,2,...., and ηt is an i.i.d process (2)
Associated with the dynamical system in Eq.(2), there is a measurement function f :Rn →R which generates the time series, yt = f
( )
xt . It is assumed that all that is available to observer is thesequence
{ }
y . The dynamical system itself may be assumed to be contaminated by noise, or the tobserved time series y may be assumed to convey noiset
13
. Following Takens’ theorem (Takens, 1981), from observed time series
{ }
y , one can generate the data vector t
z
i=
(
y
i,
y
i+d,...,
y
i+(m−1).d)
for all i∈(
N−(m−1).d)
(3) where N is the length of the observed sequence{ }
y ; d is the time delay. This vector indicates a tpoint of m-dimensional reconstructed phase-space Rm, where m is embedding dimension. The reconstructed trajectory is an embedding of the original trajectory when the m value is sufficiently large (Gencay and Dechert, 1992). Abarbanel (1995) give us a good suggestion on how to select m and d. From now on the time delay d, is taken to be equal to 1, which corresponds our observation interval in time domain.
In order to perform the analysis, we employ14 phase-space reconstruction methodology (see Takens 1981; Eckmann et al. 1987; Kantz 1994; Abarbanel 1995) to debt stock GDP ratio series of
12 The phase-space construction is the fundamental starting point of many approaches in nonlinear data analysis For details please refer to Kantz and Schreiber (1997).
13 Kantz’s algorithm allows us to make this assumption, Kantz (1994), Kantz and Schreiber (1997). 14 Tisean Package introduced by Hegger et al. (1999) is used and software R 2.11.0 is employed.
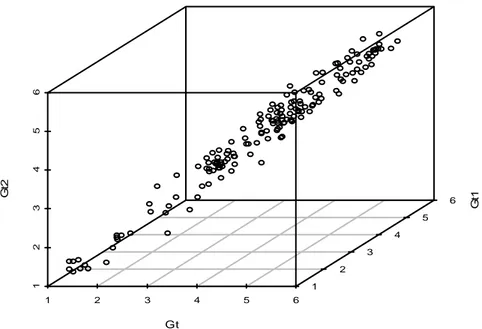
each of the countries under consideration. The orbit on phase-space then depicts the path for debt dynamics. The public gross debt stock GDP ratio data of Ireland, Italy, Greece, Spain, Portugal, and UK are embedded on 3-dimensional15 phase-space. The reason why we choose those countries is that in the period under examination the primary balances of those economies are detoriated and enjoy negative trend, while debt stock GDP ratio of each is increasing (see Eurostat). This observation clearly indicates that the reaction of each government to increasing debt stock GDP ratio does not constitute to increase primary surplus. The results are depicted in Figure 2 to Figure 7. In each figure; x-axis shows the quarterly debt stock over GDP series, y-axis shows one-quarter lagged debt stock over GDP series, and z-axis shows two-quarter lagged series.
Figure 2 depicts that Ireland’s debt stock over GDP series quickly escape from initial equilibria (1999Q1-2003Q1). We see that the financial policy loses its stability. The initial equilibria of debt stock GDP ratio is settled approximately around 40-50%. The quick shift probably shows us the insufficient repayment capacity of the economy for the value 50%, implying debt intolerance. The outcome of econometric test algorithm for Italy’s debt stock GDP ratio leads us to decide that public debt is sustainable (Table 1). Figure 3 shows that the initial state of debt stock over GDP seem stable around some dynamical equilibria set. In comparison with others, the equilibria are spreaded uniformly around %110-115 and exhibit cyclic movement. The initial state stable public finance policy in 1999Q3-2003Q1 period. However, in Figure 3 the values diverging on phase-space show that such equilibria have not been sustainable.
The similarity of debt stock GDP ratio phase-evolution of Greece, Portugal, UK and Ireland is interesting. Greece, Ireland and UK debt stock over GDP exhibit nearly same movement path. The initial states of debt stock over GDP of these countries seem stable around some equilibria, implying stable public finance policy in 1999Q1-2003Q1 period. However, the values diverging on phase-space show that such equilibria have not been sustainable. For Portugal the movement is slightly slow with respect to that of Greece, implying slower divergence.
The debt stock GDP ratio in Greece wastes most of the space-time on two equilibria sets shown on Figure 4. The initial equilibria is settled around approximately 100-110%. However, there is second equilibria set which is around 110-115%, implying the non-synchronization of the coordination of expectations on 100-110%. This can be due to a type of market correction on
15 The method of recurrence plots (RP) was firstly introduced by Eckmannn et al. (1987) to visualize the time dependent behavior of the dynamics of systems ( the recurrence of states in a phase-space) which can be pictured as a trajectory in the m-dimensional phase-space.
interest rates. Figure 4 enables us to see a major shift from 110-115% to 145%. The Greek default can be observed on phase-space, where the path is reversed. To sharpen the results, one should take into account the phase-space reconstruction for the real ex-post interest rates.
The Portugal’s structure of multiple equilibria slightly differs from that of Greece. In Figure 5 we observe that until 80% is reached, there exists minor shifts and debt stock GDP ratio exhibits high instability. Market expectations seem partially coordinate on some equilibria but it is not permanent and is quickly disrupted. The shift toward 100% imply that “common knowledge” of disruption may enable traders to expect debt repudiation, however as Detragiache (1996) point it out, instead of not-lending the traders prefer to lend to government to roll over its debt.
The outcome of econometric test algorithm for UK’s debt stock GDP ratio leads us to decide that public debt is sustainable. On the other hand, from Figure 7 we observe that the debt stock exhibits divergent character, implying a major shift from the initial equilibria. Moreover it slightly slows down around 78%, another equilibria, to which public finance policy seems to be settled down. However, it re-diverges through 90%. When its divergence is compared with that of Italy, UK’s public finance seems to be disturbed more quickly than that of Italy’s possibly because of its steadily increasing primary deficit (see Eurostat). Beginning from 2001Q2, primary balance has negative trend. The disrupted structure of UK primary surplus explains us why the debt stock over GDP series enjoys quick shift through instability. We know that the international credit rating institutions do not anticipate public debt crisis for UK (see pg.6, Fitch 2011). According to phase-space analysis, UK will probably have liquidity crisis. However, we need more detailed analysis to explain why Ireland economy jumped into debt crisis and UK’s has not yet.
The most interesting movement path is observed for Spain. From Figure 6 it is straightforward to show that the path of debt dynamics exhibits loop. We could not detect any initial stable equilibria for Spain. However, Spain implements highly deterministic public finance policy in 1999Q1-2003Q1 period, which rapidly reducued the debt stock GDP ratio. Figure 6 shows that this trend is reversed around 40%, generating a sharp divergence through unsustainable values. In comparison with UK and Ireland, Spanish economy had more effort to reach lower debt stock values in order to stick to the Convergence Criteria of the Maastricht Treaty and to the Stability and Growth Pact. The reason is that the public finance policy in Spain shows more sensitive dependence to the initial values of debt stock, which can be measured by Lyapunov exponents16.
Figure 2 Ireland’s gross debt stock GDP ratio Figure 3 Italy’s gross debt stock GDP ratio
Figure 4 Greece’s gross debt stock GDP ratio Figure 5 Portgual’s gross debt stock GDP ratio
20 40 60 80 100 120 20 40 60 80 1 0 0 1 20 20 40 60 80 100 120 IRt IRt1 IRt2 100 105 110 115 120 125 100 10 5 110 1 1 5 120 1 2 5 130 100 105 110 115 120 125 ITt IT t1 IT t2 90 100 110 120 130 140 150 160 170 90 100 1 1 0 120 130 14 0 150 160 170 90 100 110 120 130 140 150 160 170 Gt Gt 1 Gt 2 40 50 60 70 80 90 100 110 120 40 50 6 0 70 80 90 100 110 120 40 50 60 70 80 90 100 110 120 Pt Pt 1 Pt 2
Figure 6 Spain’s gross debt stock GDP ratio Figure 7 UK’s gross debt stock GDP ratio
5.2 Focusing on interest rates: Germany, France and United Kingdom
In order to deepen our analysis and extend the implications of theoretical tools used in previous section, we focus on the interest rate structures of Germany, France and UK. The data used is the monthly Maastricht criterion interest rates17 for each country from 1999M1 to 2013M1. The reason why we choose Maastricht criterion interest rates instead of Government Bond yields is that Eurostat database does not show the latter series after 2007M4. Therefore, it is certain that the behaviors of the three interest rates structure are governed by EMU Convergence policies. The results are depicted in Figure 8 to Figure 10. In each figure; x-axis shows the monthly interest rates,
y-axis shows one-month lagged series, and z-axis shows two-month lagged series.
17 Maastricht criterion bond yields (mcby) are long-term interest rates, used as a convergence criterion for the European Monetary Union. The Maastricht Treaty EMU convergence criterion series relates to interest rates for long-term government bonds denominated in national currencies. Selection guidelines require data to be based on central government bond yields on the secondary market, gross of tax, with a residual maturity of around 10 years. The bond or the bonds of the basket have to be replaced regularly to avoid any maturity drift. The legal basis is the Article 121 of the Treaty establishing the European Community and Protocol on the convergence criteria. See Eurostat (http://epp.eurostat.ec.europa.eu/portal/page/portal/interest_rates/data/database) 35 40 45 50 55 60 65 70 30 40 50 60 70 80 30 40 50 60 70 80 St St 1 St 2 30 40 50 60 70 80 90 3 0 40 50 6 0 70 80 90 30 40 50 60 70 80 90 UKt UKt 1 UK t2
Figure 8 Germany Figure 9 France 1 2 3 4 5 6 12 3 456 1 2 3 4 5 6 Gt Gt 1 Gt 2 2 3 4 5 6 23 4 5 6 2 3 4 5 6 Ft Ft 1 Ft 2
Figure 10 United Kingdom
Figures 8, 9 and 10 should be analyzed by taking into account two episodes. The first one relates the period1999M1-2007M4 and the second one relates to 2007M5-2013M1. In Figure 8 we see that Germany’s interest rate behavior is governed by three equilibria set (foci), two of which appear in period 1999M1-2007M4, and relatively enjoy higher magnitudes and one of them is more attractive. Beginning from 2007M4 we observe the deterministic effects of EMU Convergence. That is the third phase in which the interest rates exhibit strict, stable and fast decrease. In France, the situation is similar to that of Germany. However we see that the convergence phase of interests in France takes place relatively slow. When we compare the UK’s interest rates to the Germany’s and France’s, we observe more attractive two equilibria sets which enjoy higher values. These two foci help us to explain the divergent character of the UK’s debt stock GDP ratio series which is shown in Figure 7. On the other hand the EMU Convergence at period 2007M4 shows itself in decreasing interest rates. Likewise, this phase certainly reveals the deterministic fiscal policy co-moving with those of France’s and Germany’s. However, beginning from 2007M4 the decrease in UK’s is more drastic than that of others. The term drastic finds itself
1 2 3 4 5 6 12 345 6 1 2 3 4 5 6 UKt UK t1 UK t2
in the incidence of multiple equilibria. That is, the sharp decrease in interest rates may not be approved by financial markets in medium term, and a possible shift through existing forceful foci may occur in future. Different from Germany and France, this type of possible market behavior makes us to suspect chaotic behavior of UK’s interests. Therefore, it rises the queries on the sustainability of this convergence policy for the UK. In perspective of time series econometrics, the deterministic pattern (convergence) in third phase of Germany’s and France’s, and in second phase of UK’s show us that a linear stochastic analysis of the interest rates in given interval certainly produces biased estimators and is not appropriate in this sense. On the other hand, to test the existence of chaotic behavior, we have to perform further analyses. The phase-space analysis can then be regarded as a primitive diagnosis and fundemental basis for the analysis of such behavior. In next section we introduce the theoretical basis for testing chaos and implement it to the UK data.
5.3. Chaotic behavior of interest rates: UK
The Lyapunov exponents for a dynamical system shown in Eq.(2) are measures of the average rate of divergence or convergence of a typical trajectory or orbit. The trajectory is also written in terms of the iterates of g . For a n-dimensional system as above, there are n exponents which are customarily ranked from largest to smallest:
λ1 ≥λ2 ≥...≥λn (4)
One rarely has the advantage of observing the state of the system (Eq.(2)) at any period t, x , and t
that the actual functional form, g , that generates the dynamics. To compute maximal Lyapunov exponent directly, similar to the algorithm of Wolf et al. (1985), Kantz (1994) use the fact that on phase-space the distance between two trajectories typically increases with a rate given by the max LE in Rm. Following from Eq.(3), therefore we define the distance between a reference trajectory
t
z and one of its ε − neighbor(s) zt( )ε after the relative time (iteration) τ by a function :
( )
R Rm →
Eq.(5) gives the magnitude of the difference vector
(
zt+τ −zt( )+ετ)
lying between the point zt+τ andthe point zt( )ε+τ . The logarithm of Φ
( )
. is needed to smooth the output of the function. We compute for all t=1,2,..,T where T is the number of reference points18 on the orbit. Thus we obtain
( )
(
( ))
( )∑
∑
= ∈ ⎟ ⎟ ⎠ ⎞ ⎜ ⎜ ⎝ ⎛ Φ = T t z L t t t t t z z L T H 1 ; , 1 ln 1 ε τ τ ε (6)where Lt denotes the number of elements of set of ε −neighbors of z . Finally, the slope of t
the curve H
( )
τ gives us the maximal Lyapunov exponent a la Kantz: H( )
λmax( )
tτ τ ≅
∂ ∂
for any τ in the scaling region, τ ≤τmax. The τ value(s) where the slope of the H
( )
τ curves approximateszero is denoted by τmax and signifies the last step of scaling range. At this value of τmax the
dynamical system is still deterministic and hence the output is predictable. Using Eq.(6), we compute19 that the interests exhibit chaotic process with positive max LE, λmax
( )
t >0, which shows that the two attractors are strange and the process diverges at τ >7. The result of the analysis is depicted in Figure 11. The y-axis shows the value of H( )
τ , and x-axis shows the number of iterations (relative time), τ . The max iteration τmax is computed to be τmax =7. It isclear from the figure that the slope of the H
( )
τ curves is positive. Theoretically the higher τmax isthe more deterministic is the system until the τmaxvalue is reached (in other words, until the points
on the orbit escape from attractors). Through the iterations exceeding τmax the system under
consideration jumps into unstable state and the observed process becomes unpredictable. By definition the positive max LE represents the sensitive dependence on initial conditions, which corresponds to the sensitivity to changes in debt stock because of the incidence of multiple equilibria (two foci). This result indicates that if the drastic decrease of interest rates through deterministic convergence policy does not approved by markets, then the interests will shift on the orbit through the path shown in Figure 10. The chaotic behavior by definition shows us that such a sudden shift can appear through any value on orbit which is governed by two foci, and is not predictable after 7 months. The certainty arises from the two-fold properties of chaotic attractors.
18 Reference point is the point on the orbit which has at least one ε- neighbor.
First, every point on the path that is established on orbit should be visited by the process and second, the positive value of max LE which makes the process diverge on that path. The τmax
value together with positive max LE show the velocity of the divergence.
Figure 11 The max Lyapunov exponent for UK’s interests
6 Sovereign credit rating mechanism
The main international credit rating agencies (Moody’s, S&P, Fitch and JCR) announce that an understanding of sovereign ratings -what they mean and the criteria behind them - is more relevant now than ever before. The rating agencies look at a wide range of elements, from solvency factors affecting the capacity to repay the debt, to socio-political factors that might influence the willingness to pay of the borrower (see Afonso 2003). Ratings agencies’ sovereign ratings are supported by qualitative and quantitative investigation of sovereign credit risk. Sovereigns are
Time ly 0 2 4 6 8 -2 .5 -2 .0 -1 .5 -1 .0 -0 .5
assigned two default ratings: local-currency default rating reflects the likelihood of default on debt issued (and payable) in the currency of the sovereign, while foreign-currency default rating is an assessment of the credit risk associated with debt issued in foreign currencies. Most sovereigns collect their tax revenues in local currency; the exceptions are commodity producers and dollarised economies. Therefore, they must purchase foreign currency in the foreign-exchange market (or from the central bank20) or borrow it. The government’s access to foreign currency therefore depends on the economy’s rather than the sovereign’s capacity to generate foreign currency and the willingness of agents to exchange it for local currency. For sovereigns such as members of eurozone and fully dollarised economies, the foreign and local-currency ratings are the same (see the instructions reported by S&P, 1998; JCR, 2000; Moody’s 2001; Fitch, 2011; Moody’s, 2006; S&P, 2011). Although the agencies use different symbols, the symbol used by each has its counterpart in the other’s rating scale. This correspondence allows a comparison of the sovereign ratings assigned by the main credit rating agencies (see Cantor and Packer, 1996a). Fitch reports (2011, pg.5) “... Sovereign risk analysis is a synthesis of quantitative and qualitative judgments that capture the willingness as well as the capacity to pay. Moreover, given the significance of the government and public sector as a whole to the national economy, the activities and policy actions of the sovereign have a profound impact on and are influenced by the performance of the economy as a whole. As such, the sovereign rating analysis incorporates a wider range of factors than only the financial strength of the sovereign. Fitch’s sovereign credit rating analyses focus on the following common factors: (i) macroeconomic performance and prospects. (ii) Structural features of the economy that render it more or less vulnerable to shocks, including the risks to macroeconomic stability and public finances posed by the financial sector, as well as political risk and governance factors. (iii) Public finances, including the structure and sustainability of public debt as well as fiscal financing; and (iv) external finances, with a particular focus on the sustainability of international trade balances, current account funding and capital flows, as well as the level and structure of external public and private debt.” It is evident; however, that we could not establish a linear relationship between sovereign ratings and every metric on which rating agencies rely in their rating analyses (see Afonso et al., 2011). On one hand, this reflects the multivariate property of the analysis. On the other hand, it reflects qualitative factors influencing
20 Turkish domestic borrowing structure through mid 90’s is a good example. For detailed analysis see Boratav and Akyüz (2003).
the ability and willingness of a sovereign to fulfill its financial obligations. These intangible effects (Depken et al., 2007) on sovereign creditworthiness reveal particularly the reason why developed countries are able to sustain much higher debt burden, even after considering per capita income. Given the qualitative factors have an important bearing on the rating assessment; each of rating agencies has a proprietary sovereign rating model that generates a score calibrated to the foreign-currency long-term default rating. These models are such tools that take into account the consistency of ratings across regions and time. However, rating agencies already declare that no model can fully capture all the relevant influences on sovereign creditworthiness and the actual rating determined by the sovereign rating committees can and does differ from that implied by the rating model.
6.1 Re-constructing credit ratings of the selected 25 countries
In perspective of the criteria set taken into account, the literature reports the usage of various fundamentals. An earlier study by Cantor and Packer (1996a) suggests that, to a large extent, Moody’s and Standard&Poor’s rating assignments can be explained by a small number of well-defined criteria, which the two agencies appear to weigh similarly. The authors concluded that the ratings can be largely explained by a small set of variables: per capita income, GDP growth, inflation, external debt, level of economic development, and default history. Further studies incorporated some other macroeconomic variables like the unemployment rate or the investment-to-GDP ratio (see Bissoondoyal - Bheenick, 2005). The studies focusing on currency crises show the important role played by several external indicators such as foreign reserves, current account balance, exports or terms of trade (Monfort and Mulder, 2000). Indicators of how the government conducts its fiscal policy, in particular budget balance and government debt, can also be relevant, as well as variables that assess political risk, such as corruption or social indexes (see Depken et al., 2007). By recognising the information on complicated criteria utilized by international rating agencies which is very shortly described above, we determine a narrower subset which is consistent with those reported by Cantor and Packer (1996a), Afonso (2003), Brooks et al., (2004) and Afonso et al., (2011). The credit ratings of selected 25 countries are re-constructed according to set of criteria: GDP per capita, change in Consumer Prices (CPI), GDP ratios of General Government Budget Balance, General Government Primary Balance, General Government Debt stock, Current account balance, Public foreign currency denominated debt stock. The seven
inter-related criteria are examined during three non-overlapping periods: 2005-2010; 2011, and 2012-2013. The average values are taken into account and future value estimations are obtained from OECD, IMF, Eurostat, Fitch, S&P and Moody’s. For each of the criteria the countries are ordered respectively from best to worst (from 1 to 25). For seven criteria and three periods, 21 different orderings are performed for 25 countries. Then, for each country average order21 (rank) is computed. This relative ordering is mapped with actual credit rankings. The relative ordering methodology has been implemented in governments’ debt management reports (Vincent 2010). Some sort of conversion between qualitative information and cardinal variables is always needed before performing some empirical analysis. In order to get appropriate data to implement empirical estimations, it is necessary to perform a numerical transformation of the rating notches into numbers. Like most analysts who transform bond ratings into data for regression analysis (beginning with Horrigan 1966 and continuing through Billet, 1996 and Afonso, 2003), we assign numerical values to the agencies’ ratings as follows. The results are depicted in Figure 8. Different from the above mentioned studies, we assign numbers from 1 to 14 to the relative credit ratings which are limited with our set of countries. According to the criteria that we employ, Switzerland is relatively in best situation which matches its actual AAA rating. However, US’s position does not merit its actual AAA rating i.e., it is worse than Italy’s, given Italy is ranked by AA-, and both US and Italy are worse than Turkey’s. Greece is worst and its actual credit ranking perfectly matches its estimated average rank. Figure 8 depicts the re-ordering of countries versus their actual ranks. The x-axis shows “Average rank” while y-axis shows both “Credit Rating” and “Rank” together, where “Rank” numerically signifies “Credit Rating”. The figure explicitly depicts the “mismatching” of actual credit rankings and current situation of some countries. The matching case can be obtained by drawing appropriate22 y = x line(s). Then the points staying below the line(s) show that the associated sovereign rating(s) has been overestimated by international ranting institutions.
21 A very similar ranking methodology has been proposed in “La note d’analyse – La France et l’Europe face a la crise économique” by Vincent, C., Centre d’analyse stratégique, Primier Ministre République of France, septembre 2010, no:191. We are grateful to Prof. Thomas Jobert who has informed us about the document.
22 One may define only one y = x curve as well as 14 curves, each of which maps actual credit rating to estimated rank.
Figure 8 During la rating has a further expect a performan criteria o economy inflows m public se account b economy (see Turk The futur and curre 23 As of dat rating of EU 24 Rating ag credit growt Composite
ast few mon s been noted downgrade an upgrade nce on the of internatio and risks may be the m ctor’s econ balance data ’s performa kish Statisti re revisions ent account te 03.09.2012 U, including U gencies use th th to the priva indicator o nths, S&P a d to be AA+ e on credit for Aust grounds o onal rating emerging m main constr nomical perf a. In 2012Q ance on exte ical Institut for Turkey balance. Th 2, based on pu U.K (see Globa he following p te sector, infla of sustainabi and Fitch ha +; Italy’s A ratings of tralia. Even f public se agencies, in macroecono raint on an formance, t Q1-Q2, give ernal balanc e). For the y will be det he rating ag
ublic debt pro al Credit Rese proxies in ord ation. ility vs cred ave perform + and Turk U.K, Franc n though ector’s econ n near-futu omic imbala upgrade to the rating a en the high ces has bee rating agen termined by gencies wh ocesses data M earch, www.m der to detect o dit ratings med “correct ey’s BBB-. ce and Spai Turkish ec nomical stru ure especiall ances whic investment agencies str and increas n disturbed ncies Turki y the confli ich give mo Moody’s anno moodys.com). overheating: c tions” on cr It is also m in23. On th conomy en ucture; base ly the over h can be o t grade. In a rictly take in sing private d and inflati ish case yie ct between ore weight ounced a neg capital inflow redit ratings more probab e other han njoys relati ed on “stab r-heating24 originated fr addition to nto accoun e external d on has been elds interest public fina to public fi gative revision ws, broad mon s. U.S credit ble to expect nd, we may ively good ble growth” state of the from capital the data on t of current debt Turkish n fluctuated ting results nce success finance, will
n for the cred ney (M2), ban t t y d ” e l n t h d . s l dit nk
possibly increase the rating of Turkey. For other agencies that pay more attention to current account balances will not change the long-term rating of Turkey in near future or jointly fluctuate with that of similar economies. The intuitive behind relative ordering enables us to make further interpretations on Turkey, which has lower grades given its successful public budget policy. That is the agencies’ ratings also serve as a regulation mechanism directing the capital inflows across countries and economic zones which they are belong to. Therefore any change in the rating of a country (zone) may correspond to the change in another country’s (zone) rating, implying joint analyses to conclude more accurately.
7 Concluding remarks
In this paper we have analyzed whether PIIGS countries and UK have followed sustainable debt policies over the last 12 years. For this, we use “standard approach” and “non-standard approach” for sustainability. The results of first approach suggest that Ireland and Portugal have pursued unsustainable debt policies over the time period considered in our estimation. Besides, Greece clearly has conducted an unsustainable debt policy that culminated in the Greek debt crisis in early 2010. Spanish fiscal policy can be said to be unsustainable if we consider 90% confidence intervals in our estimations. We also found out that Italy and UK have pursued sustainable debt policies. On the other hand, we observe during the most of the period under consideration that the primary balances of Portugal, Ireland, Greece, and UK economies are detoriated and exhibit negative trend, while debt stock GDP ratio of each is increasing. This observation clearly indicates that in short and medium-term to the increasing debt stock GDP ratios, the governments do not react with increasing the primary surplus. Therefore we found it more useful to introduce phase-space representations of debt stock GDP ratio of Ireland, Italy, Greece, Portugal, Spain and UK. We found that Greece’s, Ireland’s, Italy’s and UK’s debt stock over GDP series exhibit nearly same movement path. The initial states of debt stock GDP ratio of these countries seem stable around some equilibria, implying stable public finance policy in 1999Q1-2003Q1 period. This may be due to the result of stabilization policies in Europe in the late 1990s with the upcoming Monetary Union. However, according to the phase-space analysis such equilibria set stayed no more sustainable. Given the contrast between the results of two approaches, we consider not drawing a clear-cut conclusion in the case of Italy and UK. The phase-space analysis of public debt over GDP series of Portugal enables us to identify steady divergence, implying weaker stability on
initial equilibria. From nonlinear dynamical analysis perspective, Spanish case merits further analysis. The phase-space representation of debt stock GDP ratio of this country exhibits semi-cyclic movement path. There is no equilibria set on which Spanish fiscal policy persists, instead the average velocity of convergence to 40% debt stock over GDP levels is nearly equal to the average velocity of divergence through 80%. One of the implications of this finding is that over the period from 1999 to 2012, the fiscal policy addressing debt reversal was on the stabilization path roughly %35 of time. From broader perspective, the fundamental problem in the eurozone is actually to what extent the “wealthy” taxpayers of the north will be accept such income transfers to European citizens of the south. For heavily indebted eurozone countries, a haircut may eventually be performed.
The earlier studies (for a survey, see Afonso 2005) that performed “standard approach” to the series of public debt or discounted debt rather favored the conclusion that debt policies in Europe are not sustainable. More recent studies, in particular those that test how the primary surplus reacts to public debt, tend to conclude that debt policies are sustainable. However these studies suffer from not taking into account nonlinearity: The crisis period may be exceptional in the sense that the fiscal stimulus packages put heavy burden on the public debt while the low economic growth rates lead to further deteriorations of the debt dynamics. In this sense, debt dynamics may follow a nonlinear path. Finally, from a methodological point of view the novelty of our paper consists in implementing a compound sustainability analysis. Developing a step-wise econometric test procedure leads us to perform long-term sustainability analysis in broader perspective and resorting to phase-space analysis enables us to obtain short and medium-term behavior of debt policy in the countries under consideration.
The main finding of the study is that a well-defined set of fundamentals which are considered to be measures for the effects of recent financial crisis on public financing and which constitutes a narrower subset of more complicated quantitative measures employed by rating agencies can be used to explain recent rating revisions. This may be due to the fact that the fundamentals that we utilize to diagnose the deterioration of public budget process originating from worldwide financial crisis, provide information on the short and medium-term performances of the economy and on its main structural features. Different from the regression analysis basically backward-looking through the estimated weights of determinants, we also point out that sovereign rating analysis requires forward-looking evaluations of the risk default over a short to medium-term time horizon.
There aren’t any qualitative criteria among the criteria that are used in the analysis of recent revisions. Yet, qualitative factors such as stable and flexible political systems, strong external and fiscal financing flexibility, law and property rights, institutions, and so on play an important role in credit ratings. However, the seven criteria used in this paper had been important in contemporary rating decisions, thus the rating agencies have decreased the rating grades of Italy, France, the U.S well before. In near future we conjecture a further negative revision for UK. Therefore, under the circumstances emerged from the global financial crisis these 7 criteria may be used to explain the recent revisions in the credit ratings.
References
Abarbanel HDI (1995) Analysis of observed chaotic data. Springer.
Afonso A (2005) Fiscal sustainability: the unpleasant European case. Finanzarchiv, 61, 19-44.
Agénor PR (2001) Fiscal policy, public debt sustainability, and solvency (lecture notes). World Bank. http://www1.worldbank.org/wbiep/macro-program/agenor/agenor lectures.htm.
Agénor PR, Montiel PJ (1999) Development macroeconomics (2nd ed.). Princeton, NJ: Princeton University Press.
Arghyrou MG, Tsoukalas JD (2011) The Greek Debt Crisis: Likely Causes, Mechanics and Outcomes, The World Economy. doi: 10.1111/j.1467-9701.2011.01328.x
Bajo-Rubio O, Diaz-Roldan CV, Esteve G (2004) Searching for threshold effects in the evolution of budget deficits: an application to the Spanish case. Economic Letters, 82, 239-243.
Bascard G, Razin A (1997) Indonesia’s fiscal position: Sustainability issues. In J. Hicklin, D. Robinson, & A. Singh (Eds.), Macroeconomic issues facing ASEAN countries. Washington: International Monetary Fund.
Blanchard O (1990) Suggestions for a New Set of Fiscal Indicators’, OECD Department of Economics and Statistics Working Papers, No. 79.
Bohn H (1995) The sustainability of budget deficits in a stochastic economy. Journal of Money, Credit and Banking, Vol 27 p 257-271.
Buiter WH, Patel UR (1992) Debt, deficits, and inflation: an application to the public finances of India. Journal of Public Economics 47, 171–205.
Buiter WH (2003) Two naked emperors? Concerns about the stability and growth pact and second thoughts about central bank independence. In IFS Annual Lecture.
Chalk N, Hemming R (2000) Assessing fiscal sustainability in theory and practice (IMF Working Paper, No. WP/00/81).
Corsetti G, Roubini N (1991) Fiscal deficits, public debt and government solvency: Evidence from OECD countries. Journal of Japanese and International Economy, 5(4), 354–380.
Croce E, Juan-Ramon VH (2003) Assessing Fiscal Sustainability: A Cross-Country Comparison, IMF Working Papers, No. 03/145.
Cuddington JT (1997) Analysing the Sustainability of Fiscal Deficits in Developing Countries’ (mimeo, Georgetown University).
Dickey DA, Fuller WA (1979) Distribution of the estimators for autoregressive time series with unit root. Journal of the American Statistical Association, 74, p 427-432
Dreher A, Herz B, Karb V (2006) Is There a casual link between currency and debt crises. Int. J. Fin. Econ. 11: 305–325.
Eaton J (1989) Foreign Public Capital Flows. In: Chenery, H., Srinivasan, T.N. (Eds.), Handbook of Development Economics, vol. 2. North Holland.
Eckmann JPS, Kamphorst SO, Ruelle D (1987) Recurrence Plots of Dynamical Systems. Europhys Lett 4 91, pp. 973-977.
Engle EF, Granger CWJ (1987) Co-integration and error correction: representation, estimation and testing. Econometrica, 55, p 251-276
Fincke B, Greiner A (2011) Debt Sustainability in Selected Euro Area Countries: Empirical Evidence Estimating Time-Varying Parameters. Studies in Nonlinear Dynamics & Econometrics, vol: 15, 3 1-23. Fitch Ratings (2011) Soverign Review and Outlook. Special report, June 30.
Gencay R, Dechert WD (1992) An algorithm for the n Lyapunov exponents of an n-dimensional unknown dynamical system. Physica D, 59 142-157
Gerson P, Nellor D (1997) Philippine fiscal policy: Sustainability, growth and savings. In J. Hicklin, D. Robinson, & A. Singh (Eds.), Macroeconomic issues facing ASEAN countries. Washington: International Monetary Fund.
Hakkio GS, Rush M (1991) Is the budget deficit too large ?. Economic Inquiry Vol 29 p 429-445.
Hamilton JD, Flavin M A (1986) On the limitations of government borrowing : A framework for empirical testing. American Economic Review, n 76 p 808-819.
Hegger R, Kantz H, Schreiber T (1999) Practical implementation of nonlinear time series methods: The TISEAN package, Chaos 9, 413.
Herz B, Tong H (2003) The interactions between debt and currency crises’ common causes or contagion? Discussion Papers in Economics No. 17-03, University of Bayreuth.
Husted S (1992) The emerging U.S. current account deficit in the 1980s: a cointegration analysis. Review of Economics and Statistics 74, 159–166.
Johansen S, Juselius K (1990) Maximum likelihood estimation and inferences on cointegration with approach. Oxford Bulletin of Economics and Statistics 1, 169–209.
Johansen S (1991) Estimation and hypothesis testing of cointegration vectors in gaussian vector autoregressive models. Econometrica, 59, p 1151-1181
Kantz H (1994) A robust method to estimate the maximal Lyapunov exponent of a time series. Physics Letters A, 185, 77-87.
Kantz H, Schreiber T (1997) Nonlinear time series analysis. Cambridge, UK: Cambridge University Press. McKinnon RI (1991) The Order of Economic Liberalization. Johns Hopkins University Press.
Kawiatowski D, Phillips PJB, Schmidt P, Shin Y (1992) Testing the null hypothesis of stationarity against the alternative of a unit root. J. Econometrics 54 159–178.
Makrydakis S, Tzavalis E, Balfoussias A (1999) Policy regime changes and long run sustainability of fiscal policy: an application to Greece. Economic Modelling 16, 71–86.
Martin GM (2000) US deficit sustainability: a new approach based on multiple endogenous breaks. Journal of Applied Econometrics, 15, 83-105.
Payne JE, Mohammadi H, Cak M (2008) Turkish budget deficit sustainability and the revenue-expenditure nexus. Applied Economics, 40, 823-830.
Phillips PCP, Perron P (1988) Testing for a Unit Root in Time Series Regressions. Biometrika 75, 335-346 Polackova-Brixi, H., Ghanem,H., Islam, R., (2001) Fiscal Adjustment and Contingent Liabilities: Case Studies of the Czech Republic and the Former Yugoslav Republic of Macedonia. World Bank Economists’ Forum: 49– 77.
Polak J (1997) The IMF monetary model at forty (IMF Working Paper, WP/97/49, Washington, DC). Reinhart CM, Rogoff KS, Savastano MA (2003) Debt intolerance. Brookings Papers on Economic Activity. Vol. 2003, No. 1, pp. 1-62
Reinhart CM, Rogoff KS (2008) This time is different: a panoramic view of eight centuries of financial crises. NBER Working Paper No. 13882, March.
Reinhart CM, Rogoff KS (2011) From financial crash to debt crisis. American Economic Review 101 (August): 1676–1706
Takens F (1981) Detecting strange attractors in turbulence. In: Dynamical systems and turbulence. Berlin: Springer; p. 366.
Tanner E, Liu P (1994) Is the budget deficit ‘too large’: some further evidence. Economic Inquiry 32, 511– 518.
Trehan B, Walsh CE (1991) Testing intertemporal budget constraints : theory and applications to U.S. federal budget and current account deficits. Journal of Money, Credit, and Banking Vol 23 p 206-223.
Westerlund J, Prohl S (2010) Panel cointegration tests of the sustainability hypothesis in rich OECD countries. Applied Economics 42, 1355-1364.
Wilcox DW (1989) The sustainability of government deficits: implications of present-value borrowing constraint. Journal of Money, Credit and Banking 21 (3), 291–306.
Wu JL (1998) Are budget deficits too large? Evidence from Taiwan. Journal of Asian Economics 9 (3), 519– 528. 2,80 3,30 3,80 4,30 4,80 5,30 5,80 6,30 1 999 … 1 999 … 1 999 … 2 000 … 2 000 … 2 000 … 2 001 … 2 001 … 2 001 … 2 002 … 2 002 … 2 002 … 2 003 … 2 003 … 2 003 … 2 004 … 2 004 … 2 004 … 2 005 … 2 005 … 2 005 … 2 006 … 2 006 … 2 006 … 2 007 … 2 007 … FR G UK
0 1 2 3 4 5 6 20 07 M0 7 20 07 M1 0 20 08 M0 1 20 08 M0 4 20 08 M0 7 20 08 M1 0 20 09 M0 1 20 09 M0 4 20 09 M0 7 20 09 M1 0 20 10 M0 1 20 10 M0 4 20 10 M0 7 20 10 M1 0 20 11 M0 1 20 11 M0 4 20 11 M0 7 20 11 M1 0 20 12 M0 2 20 12 M0 5 20 12 M0 8 20 12 M1 1 FR G UK