T.C.
BAHÇEŞEHİR ÜNİVERSİTESİ
CHURN MANAGEMENT OF
ELECTRONIC BANKING CUSTOMERS
Master Thesis
Oytun BİLGEN
İSTANBUL, 2009
T.C.
BAHÇEŞEHİR ÜNİVERSİTESİ
Institute of Sciences
Computer Engineering Graduate Program
CHURN MANAGEMENT OF
ELECTRONIC BANKING CUSTOMERS
Master Thesis
Oytun BİLGEN
SUPERVISOR: ASSOC. PROF.DR. ADEM KARAHOCA
T.C
BAHÇEŞEHİR ÜNİVERSİTESİ
Institute of SciencesComputer Engineering Graduate Program
Name of the thesis: CHURN MANAGEMENT OF ELECTRONIC BANKING
CUSTOMERS
Name/Last Name of the Student: Oytun BİLGEN Date of Thesis Defense: 05 June 2009
The thesis has been approved by the Institute of Sciences.
Director
Prof. Dr. Bülent ÖZGÜLER Signature
_ _ _ _ _ _ _ _ _ _ _ _ _ _ _
I certify that this thesis meets all the requirements as a thesis for the degree of Master of Science.
Head of Department
Prof. Dr. Bülent ÖZGÜLER
This is to certify that we have read this thesis and that we find it fully adequate in scope, quality and content, as a thesis for the degree of Master of Science.
Co-Supervisor Supervisor
Assoc. Prof. Dr. Adem KARAHOCA
Examining Committee Members
Prof. Dr. Nizamettin AYDIN _ _ _ _ _ _ _ _ _ _ _ _ _ _ _ Assoc. Prof. Dr. Adem KARAHOCA _ _ _ _ _ _ _ _ _ _ _ _ _ _ _ Asst. Prof. Dr. Yalçın ÇEKİÇ _ _ _ _ _ _ _ _ _ _ _ _ _ _ _
i
ACKNOWLEDGEMENTS
As promised my dearest Mum…
I am placing the dot for a two years M.Sc. study at Bahcesehir University, at the same time the comma; keeping the plans of a Ph.D.
I would like to record my gratitude to Dr. Adem KARAHOCA, who I believe is the person I found whenever I needed with his supervision, advice, and guidance from the early stage of this study and throughout my whole study at Bahcesehir University. His positive attitude against my work exceptionally inspires and enriches my growth as a M.Sc. researcher and scientist as I want to be. I will always remember him.
It was a great pleasure for me to work with Alper SEN, who is my previous manager. He has given ideas with his particular skills in Electronic Banking applications, as well as in handling customer satisfaction and associated tools.
Finally, my very special thanks go to Dilek AKAY, who is a best friend, a sister, an all-in-one peerless heart, for her endless support during my study and preparation of this thesis.
ABSTRACT
CHURN MANAGEMENT OF ELECTRONIC BANKING CUSTOMERS
Oytun BİLGEN
Institute of Sciences, Computer Engineering Graduate Program
Supervisor: Assoc. Prof. Dr. Adem Karahoca
June 2009, 43 pages
As the world goes through a paper-less environment, electronic banking solutions are more welcome by most of corporations. It is important that companies control their cash management electronically at all times. Internet banking services offer customers variety of functionalities as per each customer requirements. When we look from customer point of view, they select banking platforms by comparing their different services in terms of performance and reliability. Banking corporations must understand customer needs well enough to ensure that efficient service is provided among customers. Different business strategies are held by most of the banking corporations to monitor customer satisfaction. In most of the case, customers are the main point that is routing the new strategies to end up in a new service. Banking firms, monitor user activity, and try to get feedback as much as they can by using variety of evaluation methods. Aim of this thesis is to figure out customer intentions as per user activity data obtained over an internet banking platform. Intended Banking Corporation is being advised regarding the functionality that needs an improvement the most by analyzing the data. Analytic Hierarchy process will be used to figure out the appropriate approach. As per Fuzzy AHP, four different specialist’s comments on the priority of a data field is collected in a formula based approach and scoring is performed as per user activity parameters. In accordance with the experimental results, we can conclude the most important functionality that the customers found least satisfying and will be pointing the banking corporation to focus on that issue. Different specialists may raise different approaches as well; however the approaches being formulated in this thesis have end up in an acceptable meaning
iii
and are giving direct recommendations to the banking corporation. Basically, this study focuses on Electronic Banking functionalities, combines customer usage data to analyze customer intention as well as forming up an idea for banking corporations on which functionality to invest on mostly using AHP techniques. The origin of the data set that was involved in this study is generated from a global internet banking environment.
Key words: Electronic Banking (EB), EB Customer Analytics, Internet Banking Usage Statistics, Fuzzy AHP, Churn Management.
ÖZET
ELEKTRONİK BANKACILIKTA MÜŞTERİ KAYBI ANALİZİ
Oytun BİLGEN
Fen Bilimleri Enstitüsü, Bilgisayar Mühendisliği Yüksek Lisans Programı
Tez Danışmanı: Doç. Dr. Adem Karahoca
Haziran 2009, 43 Sayfa
Kağıtsız çalışma ortamları dünya üzerinde yaygınlaştıkça, elektronik bankacılık çözümleri bir çok kurum ve kuruluş tarafından daha fazla talep görmektedir. İnternet bankacılığı hizmetleri, her bir müşterinin ihtiyacına göre birçok servis sunmaktadır. Müşteri tarafından baktığımızda, müşteriler kendilerine en uygun olan platformu, performans ve güvenilirliğine göre belirlemektedirler. Böyle bir durumda, bankaların müşterilerinin ihtiyaçlarını net olarak anlaması, ve ihtiyaca uygun servis sağladıklarından emin olması gerekmektedir. Bankalar, müşteri memnuniyetini ölçebilmek için farklı işletme yöntemleri kullanmaktadırlar. Çoğu zaman, müşteriler yeni stratejilerin oluşmasında ve bu durumun yeni bir ürün ile sonuçlanmasında etkin rol oynamaktadır. Müşteri aktivitesini düzgün olarak izleyen bankalar, bu bilgilerden, birçok değerleme yöntemi ile en üst seviyede fayda sağlamaya çalışmaktadırlar. Bu tezin amacı, müşteriler tarafından sistem üzerinde oluşan sistem kullanım bilgisi( user activity database) kullanılarak, müşteri beklentilerini oluşturmaktır. Verilerin analizini takiben, ilgili banka, en çok yenilik gerektiren servisi ile ilgili bilgilendirilebilecektir. Verilerin analizi, Analitik Hiyerarşi Süreci kullanılarak gerçekleştirilecektir. Bulanık Analitik Hiyerarşi Mantığı ile dört farklı uzman görüşünden yola çıkılarak öncelikler belirlenecek ve oluşturulan formüller ile puanlama yapılacaktır. Deney sonuçlarına bakılarak, müşterilerin en az memnun olduğu servisler farklı yaklaşımlara göre belirlenecek ve hizmet sahibinin hangi servise odaklanması gerektiği bildirilecektir. Farklı uzmanlar, değişik yaklaşımlar oluşturabilmektedir, ancak bu tez için kullanılan uzman görüşleri gerçek değerler ile
v
kıyaslandığında ilgili kuruma doğru bilgi verdiği izlenmektedir. Özetle, bu çalışma, Analitik Hiyerarşi yöntemleriyle, Elektronik Bankacılık servislerine odaklanarak, müşteri kullanım bilgisini ve beklentilerini birleştiren bir yapı oluşturmaktadır. Bu çalışmada kullanılan veri kümesi, uluslararası hizmet veren bir finansal kuruma ait verilerden örneklenmiştir.
Anahtar Kelimeler: Electronic Banking (EB), EB Customer Analytics, Internet Banking Usage Statistics, Fuzzy AHP, Churn Management.
TABLE OF CONTENTS
1-INTRODUCTION ... 1
2- RESEARCH METHOD ... 4
2.1DATAMINING ... 4
2.2CHURNMANAGEMENT ... 6
2.3ANALYTICHIERARCHYPROCESS ... 7
2.4FUZZYAHP ... 8
2.5CALCULATIONOFAHPVALUESBYFUZZYAHPMODEL……… . 9
2.6PRIORITIZATIONWITHFUZZYAHPINCHURNMANAGEMENTOFEBCUSTOMERS ... 11
3- THE AHP MODEL ... 13
4- UNDERSTANDING CUSTOMER BEHAVIOUR ... 16
4.1APPROACHESDEFINEDBYSPECIALISTS ... 16
4.2FINALSCORESWITHPERCENTAGES ... 17
5-EXPERIMENTAL RESULTS ... 19
5.1THEDATASET ... 19
5.2CALCULATINGSCORES ... 22
5.3RISKSCORINGRESULTS……… ... 23
6-CONCLUSION AND FUTURE PLANS ... 26
REFERENCES ... 28
vii
LIST OF TABLES
TABLE 2.1 FUZZY AHP METHODS... 12
TABLE 3.1TRIANGULAR FUZZY CONVERSION SCALE ... 14
TABLE 3.2RANDOM INDEX VALUES ... 14
TABLE 4.1SEGMENTS AND PERCENTAGES ... 16
TABLE 4.2SPECIALISTS’ RATINGS ... 17
TABLE 4.3SAMPLE SCORES ... 18
TABLE 5.1DATA FIELDS AND MEANINGS ... 20
TABLE 5.2CR IS BEING CONSIDERED AT THE THRESHOLD%10 ... 21
TABLE 5.3WEIGHTS IN APPROACH CALCULATIONS ... 21
TABLE 5.4 PAIRWISE COMPARISON ... 21
TABLE 5.5SAMPLE OF RATING 1 ... 22
TABLE 5.6SAMPLE OF RATING 2 ... 22
TABLE 5.7SAMPLE OF RATING 3 ... 23
LIST OF FIGURES
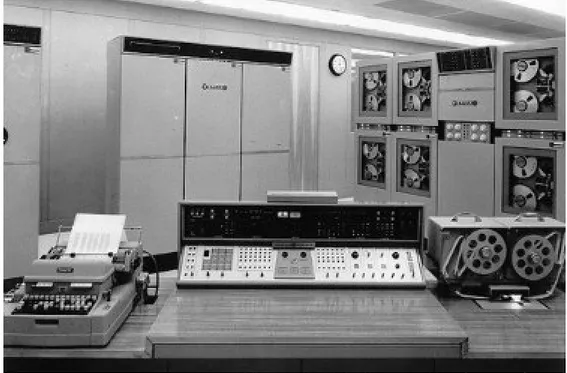
FIGURE 1.1CONSOLE OF GENERAL ELECTRIC'S COMMERCIAL ERMA ... 2
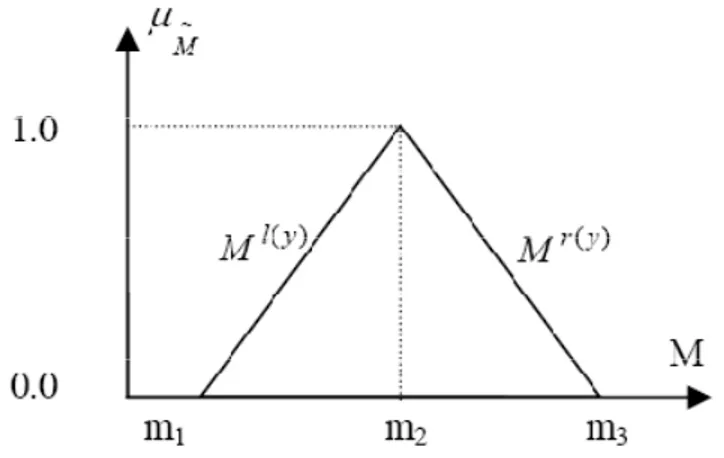
FIGURE 2.1AFUZZY TRIANGULAR MEMBERSHIP FUNCTION ... 9
FIGURE 3.1:AHPMODEL TO UNDERSTAND CUSTOMERS’ INTENTIONS ... 15
FIGURE 4.1 SAMPLE CUSTOMERS DISTRIBUTION ... 18
FIGURE 5.1RESULTS OF APPROACH -I- ... 24
FIGURE 5.2RESULTS OF APPROACH -II- ... 24
FIGURE 5.3RESULTS OF APPROACH -III- ... 25
ix
LIST OF SYMBOLS/ABBREVIATIONS
Analytic Hierarchy Process : AHP
Approach : APP
Automated Teller Machine : ATM
Electronic Banking : EB
Electronic Recording Method of Accounting : ERMA
Estimated Transaction Value : ETV
Exploratory Data Analysis : EDA
FEAHP : FUZZY EXTENDED AHP
Inquiries Run : IR
Magnetic Ink Character Reading : MICR
Rating : RA
Reports Run : RR
Secure Socket Layers : SSL
Stanford Research Institute : SRI
Year-to-date Inquiries Run : YTDIR
Year-to-date Reports Run : YTDRR
Year-to-date Transaction Value : YTDTV
1-INTRODUCTION
Nowadays Internet connection provides Online Banking applications, providing fast, convenient and secure access to banking services. In other words, an online banking service provides a secure and efficient method for the banking corporation to send and receive data in between customers. Data encryption protects data from being viewed by people who are not authorized users. Most of the online banking applications use Secure Sockets Layer (SSL) Version 3, a protocol designed to provide privacy between a Web client and server. SSL V.3 uses financial institution level 128-bit encryption, enabled by specialized digital certificates, allowing establishing a secure Internet session as requirement for SSL implementation in EB applications has also risen by VISA (Visa USA, Inc., 2008).
Browsing the history of Electronic banking, the first step was held in 1950s by the invention of the Electronic Recording Method of Accounting computer processing system also named as ERMA at the Stanford Research Institute. ERMA began as a project for the Bank of America in an effort to computerize the banking industry. ERMA computerized the manual processing of checks and account management and automatically updated and posted checking accounts. Stanford Research Institute also invented MICR (magnetic ink character recognition) as part of ERMA. MICR allowed computers to read special numbers at the bottom of checks that allowed computerized tracking and accounting of check transactions.
ERMA was first demonstrated to the public in September 1955, and first tested on real banking accounts in the fall of 1956. Production models (ERMA Mark II) of the ERMA computer were built by General Electric. Thirty-two units were delivered to the Bank of America in 1959 for full-time use as the bank's accounting computer and check handling system. ERMA computers were used into the 1970s (Stanford Research Institute, 2009).
As per Stanford Research Institute's website; The forty-year-old project ERMA, provided a vision of what business could expect from the application of data-processing machines, and illustrates how and why some of the key capabilities were invented, including bookkeeping, checks with pre-printed account numbers, optical character recognition (OCR or scanning), and robotic document sorting (ten checks per second). The automated teller machine (ATM)
2
is the natural descendant of this work, and illustrates the progression away from paper checks toward all electronic banking.
Bank of America has announced that ERMA will be produced by General Electric. General Electric has designed ERMA II transistors (i.e. solid state logic elements) by use of magnetic core memory. Simply ERMA follows below procedure in processing input; Numeric data input was read automatically from the original documents by use of the MICR method, and operational procedures will be managed by ERMA as per the data provided by the designated method.
1959 was the year where Bank of America started using General Electric’s first 32 ERMA computing systems. ERMA was proactively used by Bank of America as an accounting computer until 1970.
Figure 1.1 Console of General Electric's commercial ERMA
Briefly, ERMA has started an important business by means of financial systems support and growth. And year by year EB solutions has been developed quickly, resulting in extraordinary applications being delivered from banking corporations to customers. As much important as application properties, banks must monitor the whole process to ensure that customer satisfaction is being kept in acceptable limits.
Banks, providing such solutions to their clients will need to perform analytics on their customer based data, to serve better and satisfy them. One of the most important functions performed by a CRM system is to help predict customer behavior. Customer behavior prediction as implemented in most CRM systems consists of different methods and approaches as per the corporation needs.
Years after, virtual retail banking over the Internet was introduced in Singapore on 1997–1998 by the Development Bank of Singapore, the Post Office Savings Bank, the Overseas Chinese Banking Corporation, and the United Overseas Bank. First CRM studies as per EB related data is seen Singapore. The study covered customers using banking services for payment inquiry or transaction initiation purposes. In 2000, consumer attitudes toward the usefulness of and willingness to use Internet e-retail banking were identified and measured (Z. Liao, M. T.Cheung, 2002).
Analytic Hierarchy Process was used in measuring Critical Success Factors of E-Bank Portals. Because of the measurement, a multi levels and multi-criteria Fuzzy Analytic Hierarchy Process method were conducted in this case (M.M.A. Ellatif, M.M. Saleh, 2008).
Another work aims to present EB customers intentions in a time period as per their previous experiences. Churn Prediction Model in Retail Banking by using Fuzzy C-Means firstly proposed by D. Popović in October 2008. Clusters predicted based on fuzzy methods for churn prediction in retail banking. The study was done on the real data of 5000 clients of a retail bank. Real data are great strength of the study, as a lot of studies often use old, irrelevant or artificial data(D. Popović, 2008) . This thesis focused on the prediction engine that uses these sums performed best in churn prediction, applied to both balanced and non-balanced test sets, identifying the customer behavior on E-Banking usage.
4
2- RESEARCH METHOD
2.1 DATA MINING
Data Mining is an analytic process designed to explore and dealing with large amounts of data mostly business related in search of consistent patterns and/or systematic relationships between variables, and then to validate the findings by applying the detected patterns to new subsets of data.
Prediction is the ultimate aim of data mining techniques. And predictive data mining is the most common type of data mining and one that has the most direct business applications such as understanding Customer Behavior.
The process of data mining consists of three stages:
1. Exploration: initial exploration will collect the data set that is required to run data mining methods.
2. Building the model: the model will figure out the aim of the data mining study with the intended data set including pattern identification with validation/verification, 3. Deployment: when the generated model is applied, it will result in prediction results
(Berry& Linoff, 2000, Edelstein, H., A. 1999).
Exploration stage usually starts with data preparation involving cleaning data, data transformations, selecting subsets of records and - in case of data sets with large numbers of variables (i.e. fields) while performing some preliminary feature selection operations to bring the number of variables to a manageable range as per the statistical methods which are being considered.
Feature selection is important, since large amount of data contains fields that will not generate acceptable predictions. Feature selection must be applied prior to applying any mining techniques to ensure the data set contained in data mining method will deploy prediction results in the correct and/ or expected ranges.
Then, depending on the nature of the analytic problem, this first stage of the process of data mining may involve anywhere between a simple choice of straightforward predictors for a regression model, to elaborate exploratory analyses using a wide variety of graphical and statistical methods in order to identify the most relevant variables and determine the complexity and/or the general nature of models that can be taken into account in the next stage.
The Model building stage involves considering various models and choosing the best one based on their predictive performance. This approach explains the variability in question and produces stable results across samples. Although it sounds like a simple operation, generally it involves a very elaborate process. There are a variety of techniques developed to achieve that goal known as competitive evaluation of models. This approach applies different models to the same data set and then comparing their performance to choose the best. These techniques; which are often considered the core of predictive data mining include; Bagging (Voting, Averaging), Boosting, Stacking (Stacked Generalizations), and Meta-Learning.
As the final stage; Deployment involves using the model selected as best in the previous stage and applying it to new data in order to generate predictions or estimates of the expected outcome (Edelstein, H., A., 1999 & Han, J., Kamber, M. 2000).
The concept of Data Mining is becoming increasingly popular as a business information management tool where it is expected to reveal knowledge structures that can guide decisions in conditions of limited certainty. Recently, there has been increased interest in developing new analytic techniques specifically designed to address the issues relevant to business Data Mining such as Classification Trees, but Data Mining is still based on the conceptual principles of statistics including the traditional Exploratory Data Analysis (EDA) and modeling and it shares with them both some components of its general approaches and specific techniques (Pregibon, D., 1997 & Westphal, C., Blaxton, T., 1998).
However, an important general difference in the focus and purpose between Data Mining and the traditional Exploratory Data Analysis (EDA) is that Data Mining is more oriented towards applications than the basic nature of the underlying phenomena. In other words, Data Mining is relatively less concerned with identifying the specific relations between the involved variables. For example, uncovering the nature of the underlying functions or the specific types
6
of interactive, multivariate dependencies between variables are not the main goal of Data Mining( Hastie, T., Tibshirani, R., & Friedman, J. H. , 2001). Instead, the focus is on producing a solution that can generate useful predictions. Therefore, Data Mining accepts among others a "black box" approach to data exploration or knowledge discovery and uses not only the traditional Exploratory Data Analysis (EDA) techniques, but also such techniques as Neural Networks which can generate valid predictions but are not capable of identifying the specific nature of the interrelations between the variables on which the predictions are based (Weiss, S. M., & Indurkhya, N., 1997 & Witten, I. H., & Frank, E., 2000).
2.2 CHURN MANAGEMENT
Churn is the gross rate of customer loss during a given period. Formulating the customer loss rate, i.e. Churn can be stated as follows.
Monthly Churn= (C0 + A1-C1) / C0
Where:
C0 : Number of customers at the beginning of the month
C1: Number of customers at the end of the month
A1: Gross new customers during the month
A persistent challenge on both the cost and revenue sides is customer churn, the movement of customers from another bank to one another in search of better and reliable products and services. As markets become saturated and competition intensifies, customers have more choices and are eager to flex their selection power.
Churn rates have escalated with increased competition and deregulation. For banking corporations, increased customer churn has resulted in rising customer acquisition costs and lower average monthly transaction volumes. It also has translated into a renewed interest in customer satisfaction and retention, since it costs much more for an electronic banking department to acquire a new customer than to retain an existing one as each new customer requires a new payment integration infrastructure in between customer’s company and banking corporation. Banking corporations also should be able to identify customers that
generate unreasonably low margins and develop strategies to increase margins or divest of such customers. It is important for banking corporations that they run sophisticated Customer Relationship Management (CRM) and Churn Management techniques.
Churn is a significant global business issue and business sections must effectively manage to be viable, long-term market players (Carl Geppert, 2002) .
2.3. ANALYTICAL HIERARCHY PROCESS (AHP):
AHP is a well proven multi-attribute decision making methodology, especially powerful for those complex problems with asset of highly interrelated factors (Lin & Hsu, 2007 & Buckley, J. J., 1985).
With a pool of potential options, AHP make pair comparison and helps to determine which alternative is the better than the other criteria. If there is not any constraint for problem, AHP is enough for making decision. Such as, single source which is mentioned in this article.
If the value for alternative i and j are respectively w and i w , the preference of alternative is j
i to j is equal tow /i w .Hence the pairwise comparison matrix is; j
1 w /w1 w1/w2…….w1/w n 2 w /w1 w2/w2…….w2/w n n w /w1 w /n w2…….w /n w n [1] [2] [3]
As this matrix is consistent the weight of each element is its relative normalized amount (D.A. Chang, 1996): Weight of ith element =
n i i i w w 1The priority of alternative i to j for negative criteria, such as cost, is equal to w /j w , then the i
pairwise comparison matrix is;
As this matrix is also consistent, the weights of elements are the normalized amount of any columns, which is equal to the inverse normalized amount of the alternatives (Csutora, R., Buckley, J.J., 2001):
8
Weight of ith element (for negative criteria) =
n i i i w w 1 1 1 2.4. FUZZY AHPFuzzy set theory has proven advantages within fuzzy, imprecise and uncertain manner and looks like as human reasoning in its use of approximate information and uncertainty to generate decisions (Kubat & Yuce, 2006).
Fuzzy set theory implements classes and grouping of data with boundaries that are not sharply defined, in other word fuzzy. In conventional, AHP, the pairwise comparison is established using a nine-point scale which converts the human preferences between available alternatives as equally, moderately, strongly, very strongly or extremely preferred.
Even though the discrete scale of AHP has the advantages of simplicity and ease of use, it is not sufficient to take into account the uncertainty associated with the mapping of one’s
perception to a number (Kwong CK, Bai H., 2003). The linguistic assessment of human
feelings and judgments are vague and it is not reasonable to represent it in terms of precise numbers. It feels more confident to give interval judgments than fixed value judgments.
Hence, triangular fuzzy numbers are used to decide the priority of one decision variable over other. Synthetic extent analysis method is used to decide the final priority weights based on triangular fuzzy numbers and so-called as fuzzy extended AHP (FEAHP) (F. T. S Chan, N.Kumar, 2004).
The FEAHP is the fuzzy extension of AHP to efficiently handle the fuzziness of the data involved in the decision of best global supplier. It is easier to understand and it can effectively handle both qualitative and quantitative data in the multi-attribute decision making problems. Triangular fuzzy number can be figured out as shown below in figure 2.1.
Figure 2.1 A Fuzzy triangular membership function
A fuzzy set (Ross TJ., 1997 & Zadeh LA, 1995) is characterized by a membership function, which assigns to each object a grade of membership ranging between 0 and 1. In this set the general terms such as “large”, “medium”, and “small” each will be used to capture a range of numerical values.
A fuzzy number is a special fuzzy set, such that; }
), ( ,
{x x x R
M M Where the x value is lies on the R1 i.e. x and M(x) is
continuous from R1 to close interval [0, 1]. And M(x) is defined each fuzzy numbers membership function, which is shown as shown in below equation (F. T. S Chan, N.Kumar, 2004). otherwise a x a a a x a a x a a a a x x M 0 ) /( ) ( ) /( ) ( ) ( 3 3 2 2 3 2 1 1 2 1
2.5 CALCULATION OF FUZZY AHP VALUES BY FUZZY AHP MODEL
If object set is denoted by P=
p1,p2...pn
and the objective set is denoted by Q=
q1,q2...qn
Then according to extended concept analysis (Chang DY., 1992) each object is taken and extends analysis for each objective Oi is performed, respectively.
Hence the m extent analysis values for each object are obtained with the following signs:
oi m oi oi A A A1 , 2 ,.... i=1,2, ....,n, oi k A
k=(1,2,...m) are triangular fuzzy numbers. The value of fuzzy synthetic extent with respect to the ith object is defined as;
10 Equation 2.1 The value of
m k oi k A 1can be found by performing the fuzzy addition operation of m extent
analysis values from a particular matrix shown as;
m k oi k A 1 =
m k k m k k m k k a a a 1 3 1 2 1 1 , , Equation 2.2And the value of
n i m k oi k A 1 1 is shown as eq.2.3.
n i m k oi k A 1 1 = Equation 2.3Because of eq. 2.2 , we should transformed eq.2.3 such eq.2.4.
n i k n i k n i k a a a 1 1 1 2 1 3 1 , 1 , 1 Equation 2.4The degree of possibility of A1=
a11,a12,a13
A2
a21,a22,a23
is defined as;
min( ( ), ( ))
sup ) ( 1 2 2 1 x x A A V A A y x When a pair (x,y) exists such that x y and ( ) 2( ) 1
1 x A y A then we have ) (A1 A2 V =1 Equation 2.5 1 1 1 1
m k n i m k oi k oi k i A A F
n i n i k n i k k a a a 1 1 3 1 2 1 , ,Since A1 and A2 convex number. If a11 a22 then V(A1 A2)=1 and V(A2 A1) then )
(A2 A1
V =hgt(A1A2)A1(d) where d is the ordinate of the highest intersection point.
D between A1 and A2. When A1 A1=
a11,a12,a13
and A2
a21,a22,a23
so we compute the degree of possibility such as;) (A2 A1 V =hgt(A1A2) = ) ( ) ( 22 23 12 11 23 11 a a a a a a Equation 2.6
For the comparison of A1 and A2, both the value of V(A1 A2) and V(A2 A1) are required.
The degree possibility for a convex fuzzy number to be greater than j convex fuzzy numbers A i (i = 1, 2, . . . , j) can be defined by
V(A A1,A2,....Aj) V
(A A1)and(A A2)and...(A Aj)
=min(A Ai) , i = 1, 2, k.Equation 2.7
If,
m (Pi ) = min V(Fi Fj)
Equation 2.8
For j = 1, 2, . . . , n; j i. then the weight vector is given by WP = T
n P m P m P m( ), ( ),... ( )) ( 1 2
where Pi (i1,2,...n) are n elements. After normalizing WP, we get the normalized weight
vectors W = T n P m P m P m( ), ( ),... ( ))
( 1 2 where W is a non-fuzzy number and this gives the
priority weights of one alternative over other (F. T. S Chan, N.Kumar, 2004).
2.6 Prioritization with Fuzzy AHP in churn management of EB Customers
In this study, the extent analysis method is used for churn management in electronic banking system.
Knowledge is something hard to gather and yet a valuable part of an organization. The prior knowledge on a certain domain can be useful to gather the priority of the fraud attributes. Analytic Hierarchy Process which is developed by Thomas L. Saaty in 1970’s has a wide area of usage in complex decision environments. Analytical Hierarchy Process is used to estimate
12
the weights in many areas such as multi-criteria decision making, selection, evaluation, development (Bozbura F.Tunç, Beşkese A., 2007).
Table 2.1 Fuzzy AHP methods
Method Author Geometric mean method Buckley, J. J. 1985
Extent analysis method, which derives crisp weights
D.A. Chang,1996 Lambda-Max method (well-known
kmax method)
Csutora, R., Buckley, J.J., 2001 Logarithmic least squares method
(LLSM)
P.J.M. Van Laarhoven, W. Pedrycz,1983)
Modified fuzzy LLSM Ying-Ming Wang, Ying Luo, Zhongsheng Hua, 2008 Fuzzy preference programming method
(PPM)
L. Mikhailov, 2000 Fuzzy least squares priority method
(LSM)
R. Xu, 2000
Fuzzy logic is first introduced in 1965 by Lutfi Zadeh at the University of California Berkeley.
AHP and Fuzzy Logic techniques are combined due to the complexity and uncertainty of the decision making environments. Fuzzy scores are used to prioritize the attributes, by the decision makers. Different Fuzzy AHP methods can be found in the table 2.1.
3- THE AHP DESIGN
Analytic Hierarchy Process has three main steps (Tesfamariam and Sadiq, 2006):
1. Decomposing the problem into a hierarchy which contains the goal, criteria and features. 2. Construction of a pair wise comparison matrix for each level.
3. Making the matrix consistent and computing the priorities.
In the first step, a hierarchical model is decomposed according to the expert opinions. The decomposition of the hierarchy may have one or more levels. In each level of the hierarchy, there should be a separate comparison matrix which is used to compute the priorities of that level. In the second step, using the pairwise comparisons the fuzzy judgment matrix is constructed. ) 1 ,1 ,1 ( ... ) , , ( ... ) 1 ,1 ,1 ( ) , , ( ) , , ( ).... , , ( ) 1 ,1 ,1 ( ) ( 1 2 1 21 22 21 1 1 1 12 12 12 n n n n n n nxn ij u m l u m l u m l u m l a Equation 3.1
The calculation of the priority vector from the pairwise comparison with extent analysis method can be expressed in the following steps:
a) First to normalize the fuzzy comparison matrix, each row is summed in the fuzzy comparison matrix.
b) Theses sums are normalized. And after the normalization the degree of possibility is computed for each item. Finally the priority vector of the comparison matrix is normalized to give the sum one.
c) In the third step, the fuzzy judgment matrix is checked against consistency. The consistency index gives the inconsistency between the fuzzy judgments. After constructing the fuzzy judgment matrix the eigenvalues and eigenvectors are obtained by solving the comparison matrix equation.
(A-λI)W = 0 Equation 3.2
The maximum of the eigenvalues is used in the following formula. Consistency index (CI) is computed via the formula:
14
The inconsistency of the comparison matrix is consistency ratio (CR) is
CR = CI/RI Equation 3.4
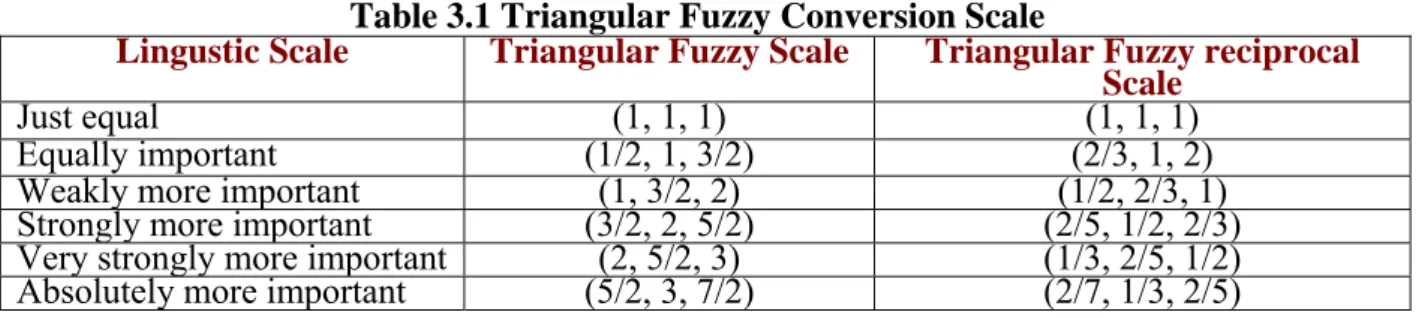
Table 3.1 Triangular Fuzzy Conversion Scale
Lingustic Scale Triangular Fuzzy Scale Triangular Fuzzy reciprocal
Scale
Just equal (1, 1, 1) (1, 1, 1)
Equally important (1/2, 1, 3/2) (2/3, 1, 2)
Weakly more important (1, 3/2, 2) (1/2, 2/3, 1)
Strongly more important (3/2, 2, 5/2) (2/5, 1/2, 2/3)
Very strongly more important (2, 5/2, 3) (1/3, 2/5, 1/2) Absolutely more important (5/2, 3, 7/2) (2/7, 1/3, 2/5)
The random index (RI) values are rated in the table 3.2 (Bozbura F.Tunç, Beşkese A., 2007). The threshold for the CR is 10%; if the CR is greater than %10 then the comparison matrix is revised to make the matrix consistent iteratively.
Table 3.2 Random Index VALUES
N 1 2 3 4 5
Random Index(RI) 0 0 0.52 0.89 1.11
N 6 7 8 9 10
Random Index(RI) 1.25 1.35 1.4 1.45 1.49
In this thesis, Fuzzy Analytic Hierarchy Process is used to define a high quality prioritization for e-banking customers’ intentions. First task is to fill out the questionnaires by the expert opinions about the customer churn indicators that put into a pairwise comparison matrix. The expert questionnaires organized into three levels as shown in figure 3.1 and each customer is scored with respect to those levels.
16
4- UNDERSTANDING CUSTOMER BEHAVIOUR
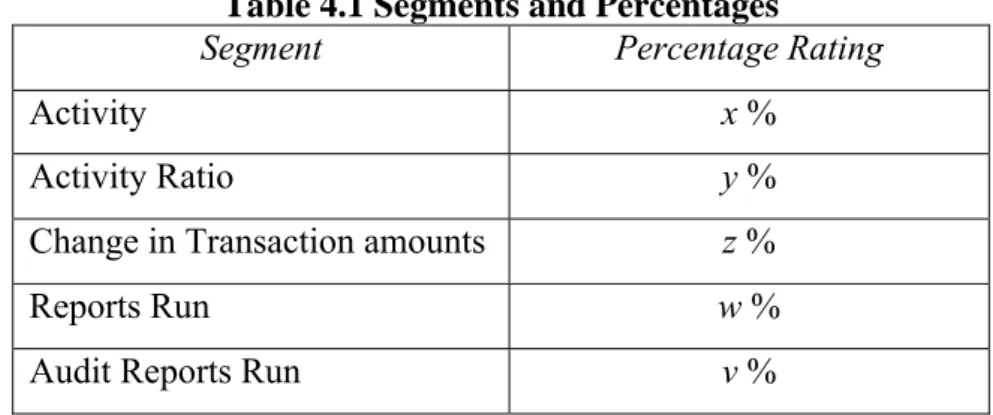
Specialist decisions are collected to figure out the AHP model scoring results. Each specialist is given a list of below fields and asked to wrtie their percentages. The percentage value is an indicator for importance of the valued segments and reflects the specialists’ idea.
Table 4.1 Segments and Percentages
Segment Percentage Rating
Activity x %
Activity Ratio y %
Change in Transaction amounts z %
Reports Run w %
Audit Reports Run v %
Once each specialist on the intended topic has returned with an appropriate rating score, the scoring rates are being passed inside our formula, to ensure that correct way of a decision support system is initiated.
4.1 APPROACHES DEFINED BY SPECIALISTS
Reporting functionality is an important factor in understanding customer intentions of internet banking platform usage. Most of the users are using with reporting functionalities when they connect through the online banking application. Throughout the scoring process the reporting functionality is calculated with the below formula;
100%
Transactions are also forming up an important factor in understanding customer intentions. Numbers of transactions are being reflected onto the formulated approach in two different manners;
$
$
Difference between x and y will be scored out to determine the number of transactions affect on customer behavior.
User activity is being monitored by four different fields of the data set. We get use of those data to identify user activity. Activity detection is being handled by two ways. First approach, calculates last week status and last two months status in together. Second approach determines a ratio by dividing users to total of Active users and joins a percentage based calculation.
Finally, although audit reports has a low affect on the overall system, we get use of the audit reports count to see the exact change in user activity monitoring comparing with the audit reports run.
4.2 FINAL SCORES WITH PERCENTAGES
Once all ratings are formed up for a single row (i.e. an EB customer) each calculated rating is reflected to a final score as per specialists’ percentages.
Table 4.2 Specialists’ ratings
Specialist 1 focuses on customer segment that uses internet banking platform both for payment inquiry and transaction initiation purposes, where Specialist 2 thinks that customers need reporting features more than they use payment initiation modules.
Specialist 3 focuses on customers with acceptable transaction volumes and that holds their user activity level high. The customers with high transaction volumes, but low in user activity are the segment that Specialist 4 focuses on.
Specialist 1 Specialist 2 Specialist 3 Specialist 4
Activity 20 % 10 % 30 % 15 %
Activity Ratio 10 % 10 % 15 % 10 %
Change in Transaction Amount 30 % 30 % 30 % 50 %
Reports Run 30 % 40 % 20 % 20 %
Conside thinking think th After ra each row rows are ering Audit g is that Au hat Audit Re atings are c w stored in e provided i 29 21 t Report fun udit Report eports Run r alculated w the EB cus in table belo Score-1 10 9.27217899 1.70761111 10 0 0 Figur nctionality, usage shou ratio should with percent stomer activ ow. Table 4 Score 5 19.27217 11.70761 5 0 0 re 4.1 Samp 18 the group uldn’t affect d affect mor tages, final vity databas 4.3 Sample e-2 S 7899 40.4 1111 32.2 ple Custom is separate t the scores e than Spec scores are e) as shown e Scores Score-3 15 48430378 29052755 15 0 0 mers Distrib ed into two s. Specialist cialist 3 and shown for n below. No Score-4 7.5 28.698589 16.914490 7.5 0 0 bution o segments. t 1 and Spe d Specialist 4 each custom ote that only
4 949 02 Overall ecialist 2 4 think. mer (i.e. y sample
5-EXPERIMENTAL RESULTS
The Data set is obtained from a multinational bank internet banking platform. The platform provides services to two different segments of customers. One segment provides services to customers that want to use Payment Inquiry services only. The other segment serves both Payment Inquiry and Transaction Initiation functionalities.
The customers that use the internet banking platform includes local companies in Turkey and worldwide multinational corporations. Users access the EB application worldwide via internet.
Each user is identified by a Safeword Card (i.e. token device) on the system and activities are being tracked as per the serial number assigned to the device.
The Data Set contains 13 fields related to Reports and Inquiry module and Transactions module. User Activity counts is also available within the Data Set.
5.1 THE DATA SET
Fields listed above are grouped into formulas and will be conducted in different approaches to present user intentions.
Each field is formulated in different groups and distinct percentages are assigned to end up with 4 different result sets, each consisting of 5 different ranks.
20
Table 5.1 Data Fields and Meanings Abbreviation Meaning
LastWeekStatus Client is active last week ActiveUsers Number of active users
AuditableActions Number of audit reporting functionality usage ReportsRun Number of reports run
TransactionsCount Total number of transactions YTDReportsRun Year to date number of reports run YTDTransactions Year to date total number of transactions m2MonthsStatus Client is active in the last 2 months Users Total number of defined users InquiriesRun Total number of inquiries run
TxnDollarValueEs Estimated value of transactions in USD YTDInquiriesRun Year to date total number of inquiries run
YTDTxnDollarValue Year to date estimated value of transactions in USD
These ranks correspond to each one of four approaches are showing the overall evaluation of an Electronic Banking project manager.
Once the iterations with the revision of the fuzzy comparison matrix are complete, finally consistency is determined, CI= 0.123188. Table 5.2 indicates that, Transactions field is very strongly important to understand if the churners are loyal. Hopeless churners are grouped with respect to Client Activity, User Activity, and Reporting where as Auditing field has low priority in understanding customers’ intentions.
Table 5.2 CR is being considered at the threshold 10%
Client Activity User Activity Reporting Transactions Auditing
Weights (1/2, 2/3, 1) (1, 3/2, 2) (1/2, 2/3, 1) (2/5, 1/2, 2/3) (1, 1, 1) Extend Weights 0.23907 0.121271 0.0379367 0.146482 0.45524
Each expert has weighted the fields in the data set that will present an overall score for a customer forming up four different approaches as shown in table 5.3.
Table 5.3 Weights in Approach Calculations
App.1 App.2 App.3 App.4
Client Activity 0.2 0.1 0.3 0.15
User Activity 0.1 0.1 0.15 0.1
Reporting 0.3 0.3 0.3 0.5
Transactions 0.3 0.4 0.2 0.2
Auditing 0.1 0.1 0.05 0.05
The typical hierarchy of the AHP model consists of focus, criteria, sub criteria and alternatives (Saaty, T. L., 1999 & Saaty, T. L., R. W., 2005). There should not include too many criteria in a hierarchy (Saaty, T. L., 1999). This is an attempt to find the relative importance among the criteria (Lin & Hsu, 2007). Determine normalized weights and synthesizes the priorities. The experts have provided following scores to e-banking usage attributes and decision problem structure is build up. In the following step the pairwise comparison matrix is constructed.
Table 5.4 Pairwise Comparison
Client Activity User Activity Reporting Transactions Auditing Client Activity (1, 1, 1) (1/3, 2/5, 1/2) (5/2, 3, 7/2) (3/2, 2, 5/2) (1/2, 2/3, 1) User Activity (1/3, 2/5, 1/2) (1, 1, 1) (2/7, 1/3, 2/5) (2/7, 1/3, 2/5) (1, 3/2, 2) Reporting (5/2, 3, 7/2) (2/7, 1/3, 2/5) (1, 1, 1) (1/3, 2/5, 1/2) (1/2, 2/3, 1) Transactions (3/2, 2, 5/2) (2/7, 1/3, 2/5) (1/3, 2/5, 1/2) (1, 1, 1) (2/5, 1/2, 2/3) Auditing (1/2, 2/3, 1) (1, 3/2, 2) (1/2, 2/3, 1) (2/5, 1/2, 2/3) (1, 1, 1)
Each value that stored within the EB usage database is reflected into the overall scoring result. Every single row is studied by the AHP approach formula and ratings are collected in accordance with specialists’ percentage scorings.
22
5.2 CALCULATING SCORES
Every single row has 5 different ratings calculated as described below where a single row represents a customer’s distinct internet banking platform activity.
1. User Activity is calculated as per LastWeekStatus and m2MonthsStatus field. If the customer is active in the last week or within two months time period, the customer is rated as at least 50. If the intended customer is active in both, then it is rated a 100. Inactive customers hold zero rating in this calculation.
Table 5.5 Sample of Rating 1 LastWeekStatus m2MonthsStatus RA1
Inactive Active 50
Active Active 100
Active Active 100
Inactive Active 50
Inactive Inactive 0
2. User activity is monitored with the values of Active Users and total users defined for a customer. Simply, this calculation shows customer activity ratio by dividing active user number to total number of users defined under a customer. RA2 is formed showing customer activity ratio.
Table 5.6 Sample of Rating 2 ActiveUsers Users RA2
0 4 0
1 4 25
1 8 12.5
0 6 0
0 7 0
3. User activity database stores the number of inquiries and Reports run by an EB customer in four different fields, where the first two shows last inquiry and reports run activity, and the other two represents year to date totals of inquiries and reports run by the EB customer. Simply, the total of current inquiry and reports run is divided by year to date totals, and then passed a percentage rating forming up R3 as the Inquiries and Reports run ratio of an EB customer.
Table 5.7 Sample of Rating 3
InquiriesRun ReportsRun RA3
0 0 0
25 0 22.32142857
0 9 1.244813278
0 0 0 0 0 0
Table 5.8 Sample of Year to Date values YTDInquiriesRun YTDReportsRun 18 126 90 22 358 365 374 9 35 7
4. Transaction volumes of an EB customer is rated by using Transaction Dollar values and total number of transactions initiated. Like Inquiries and Reports run, Transaction related records are also stored in the EB Customer database as per latest and year to date status. If an EB customer is using the internet banking application only for report and inquiry purposes, then transaction related records will be zero.
5.3 RISK SCORING RESULTS
Risk scoring figures has been generated in order to present electronic banking customers’ intentions.
Each of four scores are grouped into four different Customer intentions, each named from A to D where A shows the customer group with the highest scores. Reporting and transactions have the highest priority, 10% of customers are loyal, and where as 23% stands as hopeless.
We can standing When c significa n conclude g at the lost compared w ant decrease F that custom side. F with Approa e in loyal cu Figure 5.1 R mers are no igure 5.2 R
ach -I- resu ustomers’ p 24 Results of A ot likely to Results of A ults, Priorit percentage a Approach -o use the r Approach -I ty with tran and an incre -I- reporting fa II- nsactions sh ease in hope acility as 67 how that th eless segmen 7 % are here is a nt.
For tho Activity custome Approac reportin se custome y and Repo ers are not l
ch -IV- only ng functiona Fi ers, using p orting. Hope likely to use F y consider ality of e-ba igure 5.3 R payment inq eless percen e the reporti Fig. 5.4 Res Reporting i anking servi Results of A quiry functi ntage is as ing function sults of App in priority a ices extreme pproach -I ionalities, p much as lo nalities. proach -IV and 2% as l ely requires III- priority is c oyal custom V- oyal custom s modificatio considered a mers. 39% o mers proves on. at Client of active s that the
26
6-CONCLUSION AND FUTURE PLANS
Fuzzy Analytic Hierarchy Process is successfully applied to electronic banking customer data. Using the pairwise fuzzy comparison of electronic banking functionalities such as transaction initiation, reporting, and auditing, which are gathered from expert opinions, the priorities of the indicators are determined.
AHP results show that reporting functionality is important for more than half of customers and needs to be improved to increase customer satisfaction.
The consistency of the Fuzzy AHP is determined by repeating several iterations of the pairwise comparison matrix.
Since most of the customers that are involved in this study are working with the other banks as well, the results can be used the banking corporation (owning the data set) to decide on improvement investment for the current internet banking platform.
As per the studied values and obtained results, this banking corporation may lose customers due to reporting and inquiry functionalities which are also confirmed by the usage rates for those services. However, electronic banking customers with high transaction values appear to be loyal since most of them are multinational companies and use the service worldwide.
Electronic banking customers’ usage results can be used in developing software that will help, banking corporations to predict customer intentions and improve services. This software can be implemented as a future work and data mining methods can be integrated into the application. The application can accept data using import functionality.
Our future plans also include the following studies:
Specialist ratings can be input automatically via the application that will be generated. And a result the application will display churns as per each group of specialists.
By providing a data set of different time periods (yearly basis) expected revenue increase/ decrease can be predicted. As this function will only customers that use the internet banking platform for transaction initiation purposes, customers that use
reporting functionality only will not be covered. The data set must be cleaned from payment inquiry customers prior to processing the intended prediction models.
If the global access database is provided, country based churns can be studied. This study might highlight for the banking corporation in deciding for new investments worldwide.
28
REFERENCES
Berry M. & Linoff G., 2000. Mastering data mining. New York: Wiley.
Bozbura F.T. & Beşkese A., 2007. Prioritizing of organizational capital measurement indicators using fuzzy AHP. International Journal of Approximate Reasoning. 44(2)
Buckley, J. J., 1985. Fuzzy hierarchical analysis. Fuzzy Sets and Systems. 17(3), pp. 233-247.
Chan F.T.S. & Kumar N., 2004. Global supplier development considering risk factors using fuzzy extended AHP based approach
Chang D.A., 1996. Application of the extent analysis method on fuzzy AHP. European J.
Oper. Res. 95, pp. 649-655.
Chang D.Y., 1992. Extent analysis and synthetic decision. Optimization techniques and
applications. vol. 1. p. 352.
Csutora, R. & Buckley, J.J., 2001. Fuzzy hierarchical analysis: the Lambda-Max method.
Fuzzy Sets and Systems. 120, pp. 181-195.
Edelstein H.A., 1999. Introduction to data mining and knowledge discovery. Crows Corp.
Ellatif M.M.A. & Saleh M.M., 2008. Measuring Critical Success Factors of E-Bank Portals Using Fuzzy AHP & VBA.
Fayyad U.M. , Shapiro G. , Smyth P., & Uthurusamy R., 1996. Advances in knowledge
discovery & data mining. Cambridge, MA: MIT Press
Geppert C., 2002. Customer Churn Management. KPMG International, p.7.
Han J. & Kamber M., 2000. Data mining: Concepts and Techniques. New York: Morgan-Kaufman
Hastie T., Tibshirani R., & Friedman J. H., 2001. The elements of statistical learning : Data
mining, inference, and prediction. New York: Springer
Kubat C. & Yuce B., 1996. Supplier Selection with Genetic Algorithm and Fuzzy AHP. pp. 1385-1386.
Kwong C.K. & Bai H., 2003. Determining the importance weights for the customer requirements in QFD using a fuzzy AHP with an extent analysis approach. IIE Transactions. 35(7), 619–6.
Liao Z. & Cheung M.T., 2002. Internet-based e-banking and consumer attitudes: An empirical study. Information & Management Volume 39. Issue 4, pp. 283-295.
Lin H.Y. & Hsu P.Y., 2007. Application of the Analytic Hierarchy Process on Data Warehouse System Selection Decisions for Small and Large Enterprises in Taiwan. Int. J. of
the Computer, the Internet and Management. 15(3), pp 73-93.
Pregibon, D., 1997. Data Mining. Statistical Computing and Graphics. 7- 8
Ross T.J., 1997. Fuzzy logic with engineering applications. New York: McGraw-Hill Book
Saaty T.L., 1999. Decision Making for Leaders: The Analytic Hierarchy Process for
Decisions in a Complex World. Pittsburg: RWS Publications.
Saaty T.L. & Saaty R. W., 2005. Decision Making In Complex Environments: The Analytic
Hierarchy Process (AHP) for Decision Making and The Analytic Network Process (ANP) for Decision Making with Dependence and Feedback. Pittsburg: RWS Publications.
Tesfamariam S. & Sadiq R., 2006. Risk-based environmental decision-making using fuzzy analytic hierarchy process (F-AHP). Stochastic Environmental Research and Risk Assessment. v21, pp. 35-50.
Van Laarhoven P.J.M. & Pedrycz W., 1983. A fuzzy extension of Saaty’s Priority theory, Fuzzy Sets and Systems. 11, pp. 229-241.
30
Visa USA Inc., 2008. Operating Regulations: General Rules, Volume 1, p. 166.
Wang Y.M. , Luo Y., & Hua Z., 2008. On the extent analysis method for fuzzy AHP and its applications. European Journal of Operational Research. 186(2), pp. 735-747.
Weiss S. M. & Indurkhya N., 1997. Predictive data mining: A practical guide. New York: Morgan-Kaufman.
Westphal C. & Blaxton T., 1998. Data mining solutions. New York: Wiley.
Witten I. H. & Frank E., 2000. Data mining. New York: Morgan-Kaufmann.
CURRICULUM VITAE
Name and Surname: Oytun BİLGEN
Address: Selahattin Pınar st. 4/2 Kalamış Kadıköy 34786 İstanbul
Birth Date and Place: 31 January 1980, Istanbul
Language(s): English(Fluent), German(Intermediate)
Primary School: Istek Vakfı Primary School, 1991
High School: Fenerbahçe High School, 1998
Bachelor of Science: Eastern Mediterranean University, 2004
Master Of Science: Bahçeşehir University, 2009
Institute: Institute of Sciences
Program: Computer Engineering Graduate Program
Publications:
[1] O.Bilgen, A. Karahoca, and D. Karahoca, October 2009. Churn Management of Electronic Banking Customers, 2nd International Conference on Risk Analysis and Crisis Response
Conference Proceedings China Peking University
[2] O. Bilgen and M. Demirer, June 2008. Use of Pseudo-Random Generators in Global Positioning System, Small Satellites, New Missions and New Technologies organized by
Turkish Air Force Academy Aeronautics and Space Technology Institute Conference Proceedings, p. 46
[3] O. Bilgen and M. Demirer, December 2007. Küresel Navigasyon Sistemlerinde Konum Kestirimi, Otomasyon, pp. 196- 202
[4] O. Bilgen and M. Salamah, December 2003. Delay Analysis in Connexion by Boeing,
Bilişim Ar-Ge Proje Pazarı Middle East Technical University Conference Proceedings, p.22 [5] O. Bilgen and M. Salamah, October 2003, Karakutu aydınlanıyor , Otomasyon, pp. 132- 134
Work Experience:
Atlasjet Airlines Inc. May 2009- present
Citi Corporate Banking March 2007- May 2009
Atlasjet Airlines Inc. May 2006- March 2007
Citigroup Technology September 2005- May 2006
Ars Operandi Ltd. February 2005- August 2005