DECREASE IN NON-AGRICULTURAL UNEMPLOYMENT HAS
CONTINUED
Seyfettin Gursel
*, Gokce Uysal
∗∗and Aysenur Acar
∗∗∗Executive Summary
According to the labor market statistics released by TurkStat, non-agricultural unemployment rate is 12
percent in the period of December 2011. Seasonally adjusted labor market data shows that
non-agricultural unemployment rate decreased to 11.2 percent. According to the seasonally adjusted data, the
correction that we had been expecting in construction continues and agricultural employment decreased
by 107 thousand during December 2011.
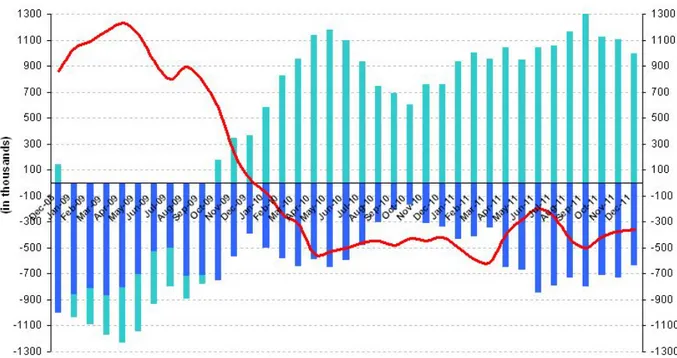
The number of unemployed persons in non-agricultural decreased by 362 thousand
compared to previous year
According to the labor market statistics released by TurkStat on the 15
thof March, non-agricultural
employment has reached 18 million 79 thousand in the period of December 2011 (November – December
– January). During the period of December 2011, non-agricultural labor force increased by 635 thousand
(3.2 percent), non-agricultural employment increased by 997 thousand (5.8 percent) on a year-on-year
basis. The number of unemployed persons in non-agricultural decreased by 362 thousand to 2 million
465 thousand on a year-on-year basis. (Figure 1)
Figure 1 Year-on-year changes in non-agricultural labor force, employment and unemployment
Source: TurkStat, Betam
*
Prof. Seyfettin Gürsel, Betam, Director, [email protected]
∗∗ Assoc. Prof. Gökçe Uysal, Betam, Vice Director, gokce.uysal @bahcesehir.edu.tr ∗∗∗ Aysenur Acar, Betam, Research Assistant, [email protected]
Labor Market Outlook:
March 2012
Seasonally adjusted non-agricultural unemployment decreased to 11.2 percent
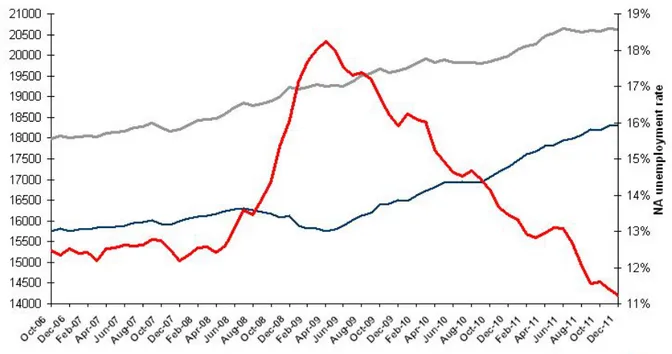
According to seasonally adjusted series, non-agricultural labor force decreased by 21 thousand to 20
million 631 thousand in December (Figure 2, App. 1 Table 1). Non-agricultural employment increased by
16 thousand and reached 18 million 314 thousand. Consequently, the number of unemployed persons in
non-agricultural sectors decreased by 37 thousand and seasonally adjusted non-agricultural
unemployment rate decreased from 11.4 percent to 11.2 percent. According to the seasonally adjusted
data, decrease in non-agricultural unemployment is caused partly by decreases in non-agricultural labor
force.
Figure 2 Seasonally adjusted non-agricultural labor force, employment and unemployment
Source: TurkStat, Betam
According to Kariyer.net data, non-agricultural unemployment
may decrease in the
period of January 2012
1The application per vacancy series released by Kariyer.net indicated stagnation in December; we observe
a slight decrease in non-agricultural unemployment in January 2012. If the increase in non-agricultural
labor force slows down further, we can observe a slight decrease in non-agricultural unemployment.
1
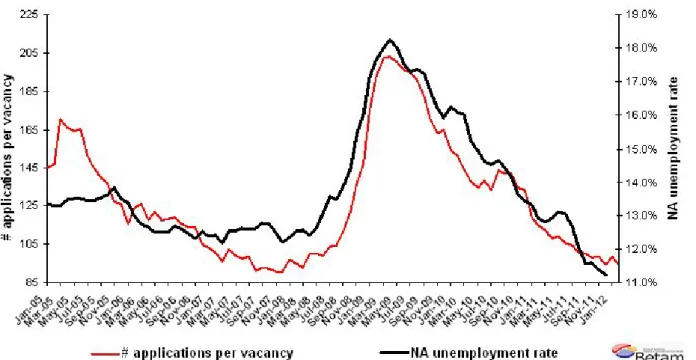
Starting from April, Betam will be using a new series released by Kariyer.net on application per vacancy. Kariyer.net collects this data via their website which is one of the largest job search engines in Turkey. Given the lack of data on vacancies in Turkey, we believe that this new series will provide useful insight to the labor market in Turkey. It provides information on the number of unemployed who are actively seeking work as well as the number of jobs that are available in the labor market. A decrease in applications per vacancy may be caused by an increase in vacancies or by a decrease in the number of applications. An increase in vacancies signals economic growth while decreasing number of applications indicates a decrease in number of people looking for a job. Figure 3 illustrates the seasonally adjusted non-agricultural unemployment rate and deseasonalized calendar day adjusted application per vacancy (Kariyer.net) series. It is clear that these series are highly correlated (almost 90 percent).
Figure 3 Non-agricultural unemployment rate and application per vacancy (SA)
Data source: Kariyer.net, TurkStat, Betam
Employment loss in construction continues
According to seasonally adjusted figures, correction in construction employment has been continuing
(App. 1 Table 2, App. 2 Figure 4)
2. Employment losses in construction accumulated to over 133 thousand
in the last three periods. These losses were counterbalanced by increases in manufacturing and service
employment.
Seasonally adjusted agricultural employment that decreased over 100 thousand in the period of
December 2011.
2
Seasonal adjustment procedure is applied to each sector of employment series separately. Hence the sum of these series may differ from the seasonally adjusted series of total employment. The difference stems from the non-linearity of the seasonal adjustment process.
Appendix 1: Table 1 Seasonally adjusted non-agricultural labor force indicators (in thousands)
Labor force Employment Unemployment Unemployment rate Monthly changes
November-08 19002 16079 2923 15.4% Labor force Employment Unemployment
December-08 19218 16136 3082 16.0% 216 57 159 January-09 19178 15893 3285 17.1% -40 -243 203 February-09 19219 15820 3399 17.7% 41 -73 114 March-09 19293 15817 3476 18.0% 74 -3 77 April-09 19258 15745 3513 18.2% -36 -73 37 May-09 19267 15800 3467 18.0% 10 55 -45 June-09 19257 15881 3376 17.5% -10 81 -91 July-09 19361 16012 3348 17.3% 104 131 -28 August-09 19516 16127 3389 17.4% 156 114 41 September-09 19561 16194 3366 17.2% 44 68 -23 October-09 19665 16381 3283 16.7% 104 187 -83 November-09 19591 16416 3175 16.2% -73 35 -108 December-09 19632 16506 3126 15.9% 40 90 -49 January-10 19687 16490 3197 16.2% 55 -16 71 February-10 19798 16613 3185 16.1% 111 123 -12 March-10 19917 16728 3189 16.0% 119 115 4 April-10 19827 16810 3017 15.2% -90 82 -172 May-10 19886 16916 2970 14.9% 60 106 -47 June-10 19826 16930 2896 14.6% -60 14 -74 July-10 19829 16948 2881 14.5% 3 19 -15 August-10 19826 16919 2907 14.7% -3 -30 26 September-10 19793 16934 2859 14.4% -33 15 -48 October-10 19858 17051 2807 14.1% 65 117 -52 November-10 19920 17200 2721 13.7% 62 149 -87 December-10 19989 17302 2687 13.4% 68 102 -33 January-11 20131 17448 2683 13.3% 142 147 -5 February-11 20214 17600 2614 12.9% 83 152 -68 March-11 20266 17669 2596 12.8% 51 70 -18 April-11 20461 17814 2647 12.9% 196 145 51 May-11 20535 17843 2692 13.1% 74 29 45 June-11 20649 17951 2698 13.1% 114 108 6 July-11 20605 17994 2610 12.7% -44 44 -88 August-11 20557 18077 2480 12.1% -47 83 -130 September-11 20590 18209 2381 11.6% 33 133 -99 October-11 20577 18189 2388 11.6% -13 -20 7 November-11 20652 18298 2354 11.4% 75 109 -34 December-11 20631 18314 2317 11.2% -21 16 -37
Appendix 1: Table 2 Seasonally adjusted sector of employment (in thousands)
Agriculture Manufacturing Construction Service Monthly changes
November-08 5114 4291 1215 10545 Agriculture Manufacturing Construction Service
December-08 4971 4242 1237 10638 -143 -49 22 93 January-09 4985 4127 1263 10548 14 -115 26 -90 February-09 5015 4096 1256 10484 30 -31 -7 -64 March-09 4989 4016 1262 10553 -26 -80 6 69 April-09 5008 3976 1229 10531 19 -40 -33 -22 May-09 5152 3961 1259 10579 144 -14 29 48 June-09 5250 3975 1285 10620 99 14 26 41 July-09 5336 4036 1302 10680 86 61 17 60 August-09 5307 4057 1305 10745 -29 21 3 65 September-09 5397 4123 1305 10732 89 66 0 -13 October-09 5452 4169 1364 10823 55 46 59 90 November-09 5506 4215 1391 10803 54 46 27 -19 December-09 5580 4286 1409 10805 74 71 18 2 January-10 5675 4324 1389 10809 96 39 -20 4 February-10 5651 4379 1366 10888 -24 55 -23 79 March-10 5610 4353 1413 10995 -41 -26 47 106 April-10 5672 4408 1442 10991 62 54 29 -3 May-10 5593 4481 1426 11039 -79 73 -17 48 June-10 5703 4532 1426 10993 110 51 0 -46 July-10 5675 4544 1463 10947 -28 13 37 -46 August-10 5656 4493 1412 10978 -19 -51 -51 31 September-10 5673 4454 1415 11011 17 -39 3 33 October-10 5805 4462 1450 11068 131 7 35 57 November-10 5860 4631 1514 11034 55 169 64 -34 December-10 6035 4634 1554 11090 175 3 40 56 January-11 6035 4700 1541 11215 1 66 -13 125 February-11 6169 4720 1571 11327 134 20 30 112 March-11 6185 4828 1590 11287 16 108 19 -40 April-11 6082 4838 1635 11394 -103 10 45 107 May-11 6044 4778 1678 11433 -38 -60 42 39 June-11 6073 4693 1709 11582 30 -85 31 149 July-11 6098 4681 1710 11618 25 -12 1 36 August-11 6176 4656 1778 11629 78 -25 68 11 September-11 6148 4677 1783 11729 -29 21 5 99 October-11 6184 4630 1701 11787 37 -47 -82 58 November-11 6165 4668 1662 11943 -20 38 -39 156 December-11 6058 4694 1624 11955 -107 26 -38 12
Appendix 2: Figure 4 Employment changes in sectors (in thousand)
3Source: TurkStat, Betam
3