NON-AGRICULTURAL UNEMPLOYMENT RATE DECREASED
Seyfettin Gürsel* Gökçe Uysal∗∗ ve Ayşenur Acar∗∗∗Abstract
Seasonally adjusted labor market data shows that the non-agricultural unemployment rate decreased from 11.7 percent in the period of January 2013 to 11.6 percent in the period of February 2013. We observe that in the manufacturing sector, the increase in employment has been accelerating since the last quarter of 2012. Service employment increased by 55 thousand as well. Kariyer.net series indicate that this slow but consistent decline might continue in the period of March 2013.
LABOR MARKET HIGHLIGHT How rigid is the labor market in Turkey?
Labor market rigidity can be measured via various indicators. OECD uses the ratio of minimum wage to mean or median wage as a measure of labor market rigidity. The ratio of minimum wage to median wage in Turkey is 0.71, the highest ratio among the OECD countries. According to this measure, minimum wage is closer to the mean wage in Turkey compared to other countries such as Poland, Romania, and Hungary. Given that Turkey is not competitive enough, the taxes on labor should be reduced and regional minimum wages should be introduced. Despite low growth, both employment and labor force have been strongly increasing in non-agricultural sectors
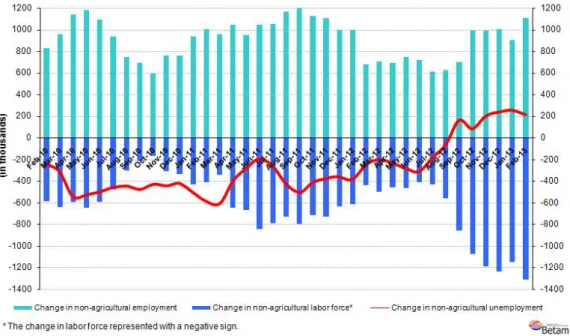
Figure 1 Year-on-year changes in non-agricultural labor force, employment and unemployment
Source: TurkSTAT, Betam
According to the data released by TurkSTAT, non-agricultural labor force increased by 1 million 315 thousand (6.4 percent) and non-agricultural employment increased by 1 million 104 thousand (6.2 percent) in the period of February 2013 (Figure 1). Despite a growth rate below 3 percent, there is a remarkable increase in employment.
* Prof. Dr. Seyfettin Gürsel, Betam, Director, [email protected]
∗∗ Yrd. Doç. Dr. Gökçe Uysal, Betam, Vice Director, [email protected] ∗∗∗ Ayşenur Acar, Betam, Research Assistant, [email protected]
Labor Market Outlook:
May 2013
The year-on-year increase in non-agricultural employment has been the strongest in the past year. On the other hand, the increase in non-agricultural labor force is the strongest annual increase since January 2005.
Seasonally adjusted non-agricultural unemployment continues to decrease
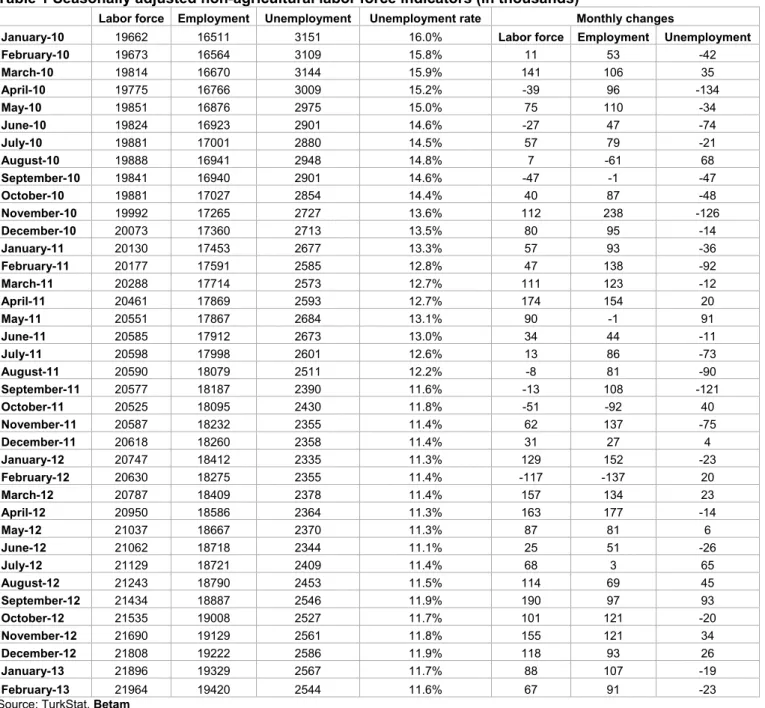
According to seasonally adjusted data, the non-agricultural labor force increased by 67 thousand to reach 21 million 964 thousand in the period of February 2013 compared to the period of January 2013 (Figure 2, Table 1). Non-agricultural employment increased by 91 thousand and reached 19 million 420 thousand. Consequently, the number of persons unemployed in non-agricultural sectors decreased by 23 thousand and non-agricultural unemployment rate fell slightly to 11.6 percent.
Figure 2 Seasonally adjusted non-agricultural labor force, employment and unemployment
Source: TurkStat, Betam
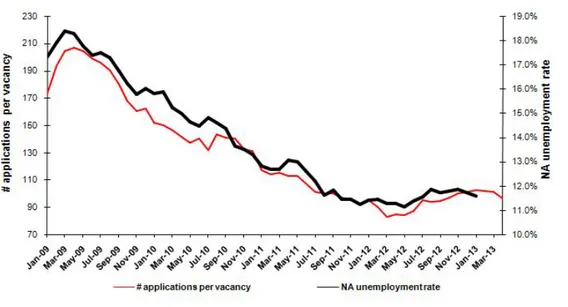
According to Kariyer.net data, non-agricultural unemployment might decrease in the period of March 2013
Application per vacancy calculated by using series released by Kariyer.net1 indicates that non-agricultural unemployment rate might continue to decrease in the period of March 2013.
Figure 1 Seasonally adjusted non-agricultural unemployment rate and application per vacancy
Source: Kariyer.net, TurkStat, Betam
1 Betam has been calculating application per vacancy using series released by Kariyer.net for a while. Seasonal and calendar adjustment
procedure is applied to application per vacancy series. A decrease in applications per vacancy may be caused by an increase in vacancies or by a decrease in the number of applications. An increase in vacancies signals economic growth while decreasing number of applications indicates a decrease in number of people looking for a job.
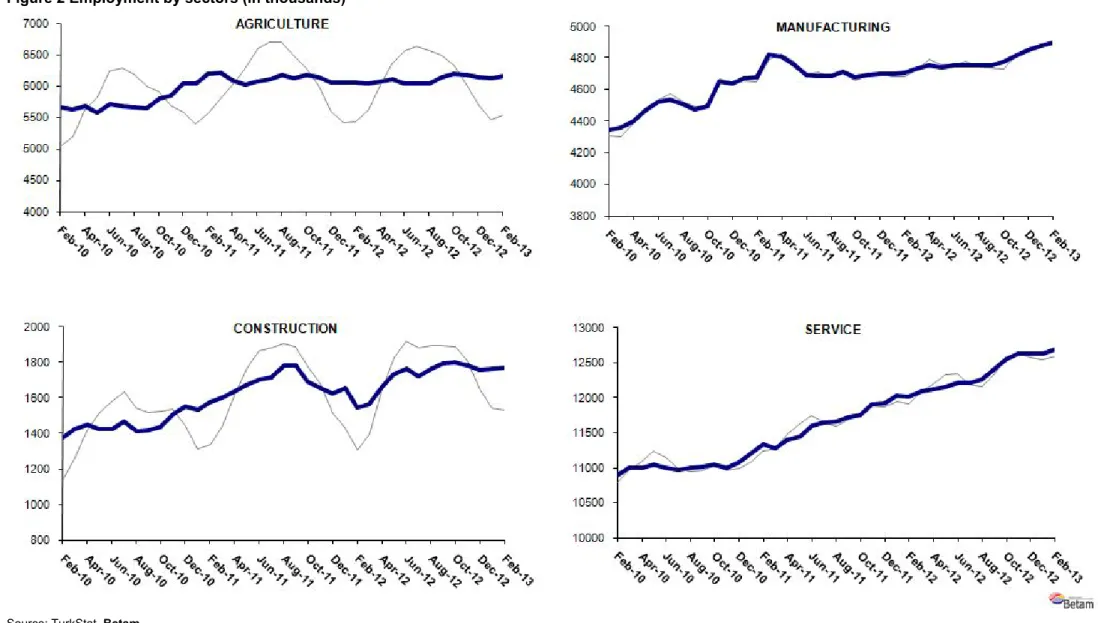
Figure 2 Employment by sectors (in thousands)2
Source: TurkStat, Betam
Manufacturing employment has been continuing to increase
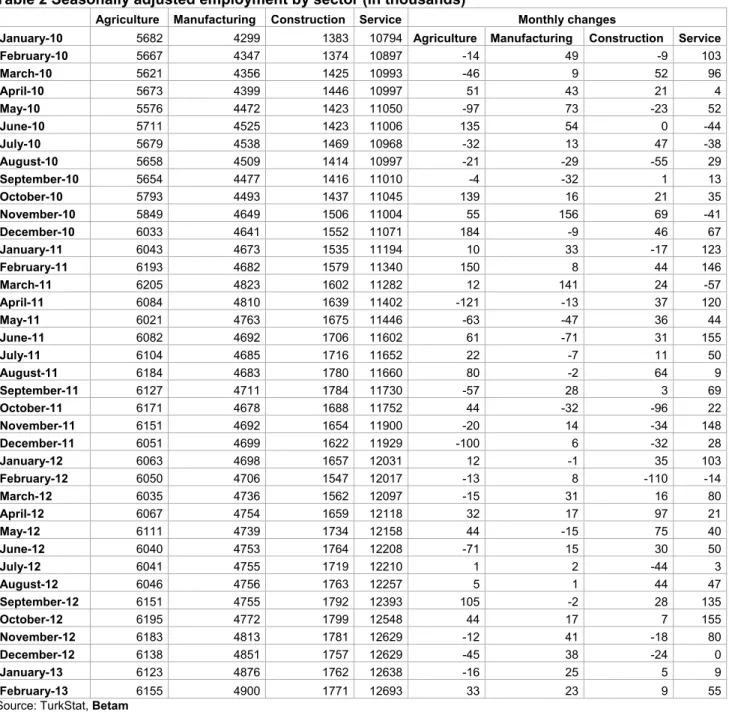
We observe employment increases in all sectors from January 2013 to February 2013 (Table 2, Figure 4)3. Even though the increase in service employment seems to have slowed down, there was still an increase of 55 thousand in the period of February 2013. Construction employment and agricultural employment increased by 9 thousand and 33 thousand respectively. Meanwhile manufacturing employment increased by 23 thousand. The increase in
manufacturing employment has been accelerating since the last quarter of 2012. Consistent increases in manufacturing production index in January and February 2013 have reflected on service employment.
3 Employment in each sector is seasonally adjusted separately. Hence the sum of these series may differ from the seasonally adjusted series of
LABOR MARKET HIGHLIGHT
How rigid is the labor market in Turkey?Labor market rigidity is a widely disputed issue. There is a simple reason why: A common measure of labor market rigidity or flexibility does not exist. However, the OECD has been using various indicators such as the level of firing and hiring costs, the prevalence of part-time jobs, the ratio of minimum wage to mean or median wage in order to measure the degree of labor market rigidity. Figure A presents the ratios of minimum wages to mean wages and median wages in various countries in 2011, calculated by the OECD. One should note that the OECD uses median earnings comprising all income types obtained by workers instead of the median wage, to facilitate the international comparison. We would like to remind the reader that earnings do not reflect only wages but also taxes, payments for working overtime, bonus payments, etc. As such, they reflect the labor costs. Since the OECD uses the Wage Structure Survey, a firm-level survey, the informally employed workers and their wages are not included in its calculations. Thus, comparison of rigidity or flexibility is restricted to formal labor markets.
Generally speaking, the closer the minimum wage to mean/median wage, i.e. the smaller the difference between mean/median wage and minimum wage, the more rigid the labor market. Minimum wage sets the floor of wages in labor market. Thus, wages in the labor market cannot be less than minimum wage. One could think that if the
minimum wage is set close to the mean/median wage, those with lower skill sets and lower productivity levels are paid relatively higher wages.
Figure A Ratio of minimum wage to mean and median wage in various countries (2011)
Source: OECD: http://stats.oecd.org/Index.aspx?DatasetCode=MIN2AVE
In Figure A, the ratios of minimum wages to median wages (minimum wage / median wage) in OECD countries are presented in ascending order. The ratios of minimum wages to mean wages (minimum wage / mean wage) are presented for each country as well. Given that the wage distribution is normal, median wages provide a better measure of central tendency. Clearly, among the OECD countries, Turkey has the highest ratio of minimum wage to median wage at 0.71. It is remarkable that the ratio of minimum wage to median wage is around 0.50 in countries such as Poland, Romania, Hungary, which were among the Eastern Bloc and are considered to be generous welfare states.
Turkey is the 10th among 24 countries in terms of the ratio of minimum wage to mean wage (minimum wage / mean
wage = 0.38). In other words, mean wages are relatively higher than median wages in Turkey. This is a common finding. A higher share of low wage workers leads to a lower median wage than the mean wage. However, the difference is strikingly higher in Turkey.
This would be a good point to remember that wages of informal workers are not included in the calculations. Given that the wages of informal workers are lower than those of formal workers, the ratio of minimum wage to both the mean wage and median wage will be higher when informal workers are included.
Consequently, the formal labor market in Turkey, along with France, is the most rigid among the OECD countries in terms of the ratio of minimum wage to median wage. The least rigid countries are the Czech Republic and the US in terms of this measure. What should be done in the formal labor market in Turkey? Either median earnings should increase or gross minimum wage should be decreased. The first option is not acceptable for the economy in Turkey which already suffers from low competitiveness. Inevitably, gross minimum wage should be reduced. There are two ways to do this: either the tax burden on wages should be reduced or regional minimum wages should be introduced. Probably, both policies should be implemented simultaneously. We will analyze regional labor market rigidities in Turkey in the next month’s labor market highlight.
Table 1 Seasonally adjusted non-agricultural labor force indicators (in thousands)
Labor force Employment Unemployment Unemployment rate Monthly changes
January-10 19662 16511 3151 16.0% Labor force Employment Unemployment
February-10 19673 16564 3109 15.8% 11 53 -42 March-10 19814 16670 3144 15.9% 141 106 35 April-10 19775 16766 3009 15.2% -39 96 -134 May-10 19851 16876 2975 15.0% 75 110 -34 June-10 19824 16923 2901 14.6% -27 47 -74 July-10 19881 17001 2880 14.5% 57 79 -21 August-10 19888 16941 2948 14.8% 7 -61 68 September-10 19841 16940 2901 14.6% -47 -1 -47 October-10 19881 17027 2854 14.4% 40 87 -48 November-10 19992 17265 2727 13.6% 112 238 -126 December-10 20073 17360 2713 13.5% 80 95 -14 January-11 20130 17453 2677 13.3% 57 93 -36 February-11 20177 17591 2585 12.8% 47 138 -92 March-11 20288 17714 2573 12.7% 111 123 -12 April-11 20461 17869 2593 12.7% 174 154 20 May-11 20551 17867 2684 13.1% 90 -1 91 June-11 20585 17912 2673 13.0% 34 44 -11 July-11 20598 17998 2601 12.6% 13 86 -73 August-11 20590 18079 2511 12.2% -8 81 -90 September-11 20577 18187 2390 11.6% -13 108 -121 October-11 20525 18095 2430 11.8% -51 -92 40 November-11 20587 18232 2355 11.4% 62 137 -75 December-11 20618 18260 2358 11.4% 31 27 4 January-12 20747 18412 2335 11.3% 129 152 -23 February-12 20630 18275 2355 11.4% -117 -137 20 March-12 20787 18409 2378 11.4% 157 134 23 April-12 20950 18586 2364 11.3% 163 177 -14 May-12 21037 18667 2370 11.3% 87 81 6 June-12 21062 18718 2344 11.1% 25 51 -26 July-12 21129 18721 2409 11.4% 68 3 65 August-12 21243 18790 2453 11.5% 114 69 45 September-12 21434 18887 2546 11.9% 190 97 93 October-12 21535 19008 2527 11.7% 101 121 -20 November-12 21690 19129 2561 11.8% 155 121 34 December-12 21808 19222 2586 11.9% 118 93 26 January-13 21896 19329 2567 11.7% 88 107 -19 February-13 21964 19420 2544 11.6% 67 91 -23
Table 2 Seasonally adjusted employment by sector (in thousands)
Agriculture Manufacturing Construction Service Monthly changes
January-10 5682 4299 1383 10794 Agriculture Manufacturing Construction Service
February-10 5667 4347 1374 10897 -14 49 -9 103 March-10 5621 4356 1425 10993 -46 9 52 96 April-10 5673 4399 1446 10997 51 43 21 4 May-10 5576 4472 1423 11050 -97 73 -23 52 June-10 5711 4525 1423 11006 135 54 0 -44 July-10 5679 4538 1469 10968 -32 13 47 -38 August-10 5658 4509 1414 10997 -21 -29 -55 29 September-10 5654 4477 1416 11010 -4 -32 1 13 October-10 5793 4493 1437 11045 139 16 21 35 November-10 5849 4649 1506 11004 55 156 69 -41 December-10 6033 4641 1552 11071 184 -9 46 67 January-11 6043 4673 1535 11194 10 33 -17 123 February-11 6193 4682 1579 11340 150 8 44 146 March-11 6205 4823 1602 11282 12 141 24 -57 April-11 6084 4810 1639 11402 -121 -13 37 120 May-11 6021 4763 1675 11446 -63 -47 36 44 June-11 6082 4692 1706 11602 61 -71 31 155 July-11 6104 4685 1716 11652 22 -7 11 50 August-11 6184 4683 1780 11660 80 -2 64 9 September-11 6127 4711 1784 11730 -57 28 3 69 October-11 6171 4678 1688 11752 44 -32 -96 22 November-11 6151 4692 1654 11900 -20 14 -34 148 December-11 6051 4699 1622 11929 -100 6 -32 28 January-12 6063 4698 1657 12031 12 -1 35 103 February-12 6050 4706 1547 12017 -13 8 -110 -14 March-12 6035 4736 1562 12097 -15 31 16 80 April-12 6067 4754 1659 12118 32 17 97 21 May-12 6111 4739 1734 12158 44 -15 75 40 June-12 6040 4753 1764 12208 -71 15 30 50 July-12 6041 4755 1719 12210 1 2 -44 3 August-12 6046 4756 1763 12257 5 1 44 47 September-12 6151 4755 1792 12393 105 -2 28 135 October-12 6195 4772 1799 12548 44 17 7 155 November-12 6183 4813 1781 12629 -12 41 -18 80 December-12 6138 4851 1757 12629 -45 38 -24 0 January-13 6123 4876 1762 12638 -16 25 5 9 February-13 6155 4900 1771 12693 33 23 9 55