Turkish Journal of Agriculture - Food Science and Technology
Available online, ISSN: 2148-127X | www.agrifoodscience.com | Turkish Science and TechnologyEvaluation of Agricultural Mechanization Level of Karaman Province
Ender Kaya1,a,*, Aykut Örs2,b1Vocational School of Technical Sciences Karamanoğlu Mehmetbey University, 70100 Karaman, Turkey
2Provincial Coordination Unit, Agriculture and Rural Development Institute, 42110 Konya, Turkey
* Corresponding author A R T I C L E I N F O A B S T R A C T Research Article Received : 15/09/2019 Accepted : 02/12/2019
The main purpose of this study is to determination of agricultural structure and mechanization features of agricultural enterprises in Karaman province. The main material of the study is statistical data of Turkish Statistical Institute (TSI) of 2009 – 2018 years for Karaman province. According to the data of Karaman province in 2009 and 2018, the average tractor power is 34.92 kW and 35.33 kW; the average tractor power per cultivated areas 2.45 kWha-1 and 1.93 kWha-1; the number of
tractors per 1,000 ha is 52.27 and 40.76; the cultivated area per tractor is 19.13 ha and 24.54 ha, respectively. The number of equipment per tractor is 10.66 and 9.86, and the number of combine harvester per 1,000 ha is 0.47 and 0.55.
Keywords: Agricultural structure Combine harvester Mechanization level Tractor Karaman
Türk Tarım – Gıda Bilim ve Teknoloji Dergisi, 8(1): 260-265, 2020
Karaman İlinin Tarımsal Mekanizasyon Düzeyinin Değerlendirilmesi
M A K A L E B İ L G İ S İ Ö Z
Araştırma Makalesi
Geliş : 15/09/2019 Kabul : 02/12/2019
Bu çalışmanın amacı; Karaman ilindeki tarım işletmelerinin tarımsal yapı ve mekanizasyon özelliklerinin belirlenmesidir. Çalışmanın materyalini Karaman iline ait Türkiye İstatistik Kurumu’nun (TUİK) 2009-2018 yıllarındaki istatistiksel verileri oluşturmuştur. Karaman ilinin 2009 ve 2018 yılları verileri sırasıyla ortalama traktör gücü 34,92 kW ve 35,33 kW işlenen alana düşen traktör gücü 2,45 kWha-1 ve 1,93 kWha-1, 1,000 ha alana düşen traktör sayısı 52,27 adet ve
40,76 adettir. Bir traktöre düşen işlenen alan 19,13 ha ve 24,54 ha, bir traktöre düşen ekipman sayısı 10,66 adet ve 9,86 adet, 1.000 ha alana düşen biçerdöver sayısı 0,47 adet ve 0,55 adet olarak belirlenmiştir. Anahtar Kelimeler: Tarımsal mekanizasyon Biçerdöver Mekanizasyon düzeyi Traktör Karaman a
[email protected] https://orcid.org/0000-0003-4689-1040 b [email protected] https://orcid.org/0000-0002-3810-6981
261 Introduction
The use of machinery in agriculture increases the effectiveness and economic efficiency of technological applications and improves working conditions (Baran et al., 2014).
The machine selection and planning is becoming more and more important because of diversification of the mechanization applications in agricultural enterprises. The profitable production of agricultural enterprises depends on the suitability and economic use of these machines consisting of tractors and agricultural machines. Therefore, the right choice and use of mechanization investments, which have a large share in the production expenses, is an important factor for the enterprises (Işık, 1988).
The development of agriculture is directly related to the use of production technologies in agriculture. Increasing agricultural productivity, income and reducing production costs are possible by increasing the use of new and modern technologies in agriculture. A country's level of agricultural development is directly related to the use of production technologies used in agriculture. Increasing product yield is possible by increasing producer income, reducing production costs and increasing the use of new and modern technologies in agriculture (Sessiz et al., 2012).
To increase the product yield by the machines used in agriculture, optimization of features like land size, product design, production techniques, capacity of the machines used, power of tractors, tractor-machine compatibility, trained personnel and etc. is required (Yavuzcan et al., 1986).
The level of agricultural mechanization may vary depending on the region's technical equipment and economic structure. The main power source is the tractor in agricultural production. Therefore, the tractor power per unit area is the most widely used criterion to determine the mechanization level. Careful determination of these criteria will allow the realization of the mechanization level dimension (Sabancı and Akıncı, 1994).
Materials and Method Material
Karaman province is in the south of the Central Anatolia Region between 37.11 northern latitudes and 33.15 eastern longitudes. Konya is located to the north, Mersin to the south, Ereğli to the east, Silifke to the southeast, and Antalya to the west. It is 1,033 meters above sea level. The overall surface area of the province is 8,869 km². Karaman has 6 districts including the central district. The districts of the Karaman province areAyrancı, Başyayla, Ermenek, Kazımkarabekir and Sarıveliler (Anonymous, 2019a).
The main material of the study is statistical data of Turkish Statistical Institute (TSI) of 2009–2018 years for Karaman province. Dataused in the study are agricultural fields, number of tractors, number of harvesters, number of agricultural machinery and equipment drawn by tractor or animal.
Method
Many criteria are used to determine the level of mechanization of agricultural enterprises. The use of these criteria alone is inadequate in determining the degree of mechanization of enterprises (Kadayıfçılar et al., 1990).
The source of power used in Turkey is tractors. The most accurate criterion in determining the mechanization level is the tractor power of kWha-1. In addition, the other criteria
used to determine the level of mechanization are tractor 1,000ha-1, ha tractor-1, equipment-tractor-1 and the number
of combine harvester 1,000 ha-1(Sabancı and Akıncı, 1994;
Işık et al., 2003; Koçak, 2006; Koçtürk and Onurbaş Avcıoğlu, 2007; Altıkat and Çelik, 2011; Eryılmaz et al., 2014).
In the study, by using TSI data for 2009-2018, tractor power per unit area (kWha-1), agricultural area per tractor
(ha tractor-1), number of tractors per unit agricultural area
(tractor 1,000ha-1), the number of equipment per tractor
(equipment- tractor-1) and the number of combine
harvesters per unit agricultural area (combine harvester 1,000ha-1) values were calculated for Karaman province
Excel program and evaluated numerically. Results and Discussion
Tractor is important in terms of increasing utilization of modern agricultural technology, spreading usage in production, providing economy and improving working conditions (Yalçın, 1990).
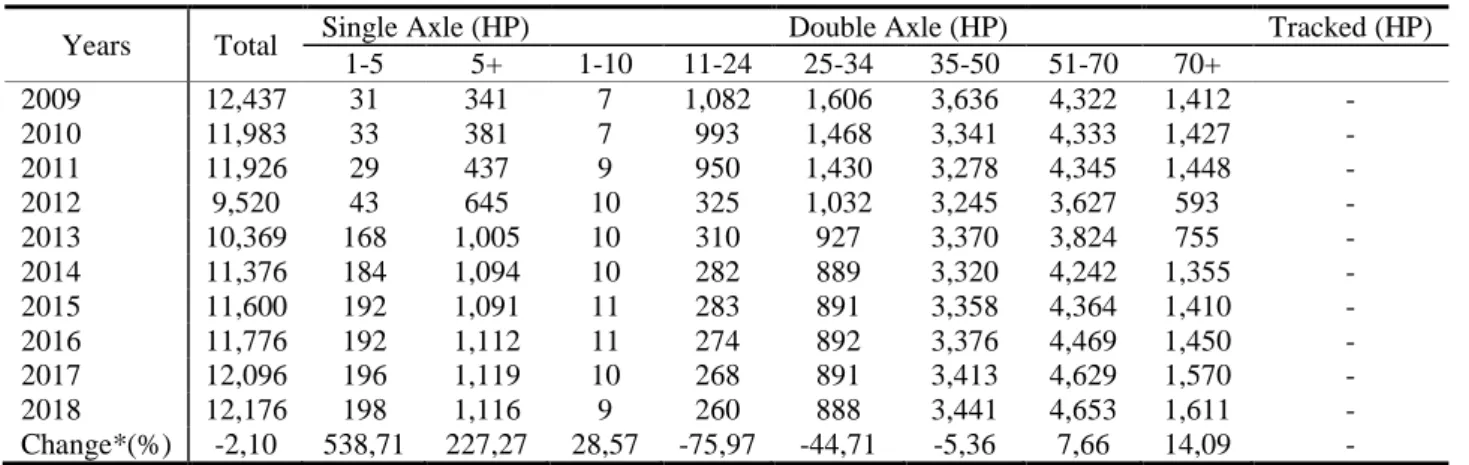
The number of tractors of Karaman province between 2009 and 2018 in the last decade is given in Table 1 according to power groups. The number of tractors is 12,437 according to 2009 data and 12,176 according to 2018 data. While the number of tractors decreased from 2009 to 2012, it entered an upward trend after 2013.When the range of 1-5 HP in single axle tractors is examined by years, it has continuously increased from 2009 to 2018.Single-axle tractors with more than 5 HP also increased continuously in 2009-2018 and reached 1,116 by 2018.The number of tractors in the 1-10 HP group with double axles is very low. While it was 7 in 2009, it increased to 9 in 2018.When the tractors between 11-24 HP were examined, the number decreased from 1,082 in 2009 to 260 in 2018.The number of tractors in the 25-34 HP range was 1,606 in 2009 and 888 in 2018.The number of tractors in the 35-50 HP range decreased from 3,636 in 2009 to 3,441 in 2018.The tractor group in the range of 51-70 HP, which was 4,322 in 2009, dropped to 3,627 in 2012 and by increasing in the following years it reaches to 4,653 in 2018.
When the number of single axle tractors of Karaman province is compared for 2009 and 2018; 538.71% increase in 1-5 HP group and 227.27% increase in tractors with more than 5 HP is observed. For double axle tractors; 28.57% increase in 1-10 HP group, 75.97% decrease in 11-24 HP group, 44.71% decrease in 25-34 HP group, 5.36% decrease in 35-50 HP group, 7.66% increase in 51-70 HP group and 14.09% increase in the group over 70 HP is observed.
The number of combine harvesters of Karaman province is given in Table 2. When we examine Table 2, it is seen that the number of combine harvester, which was 112 in 2009, increased to 164 in 2018. In combine harvesters;183.33%, 50.00%, 16.67% increase is observed for 0-5, 6-10, 11-20 age groups respectively and 16.67% decrease for over the age of 21 group.
262 Table 1. Number of tractors in Karaman for last decade
Years Total Single Axle (HP) Double Axle (HP) Tracked (HP)
1-5 5+ 1-10 11-24 25-34 35-50 51-70 70+ 2009 12,437 31 341 7 1,082 1,606 3,636 4,322 1,412 - 2010 11,983 33 381 7 993 1,468 3,341 4,333 1,427 - 2011 11,926 29 437 9 950 1,430 3,278 4,345 1,448 - 2012 9,520 43 645 10 325 1,032 3,245 3,627 593 - 2013 10,369 168 1,005 10 310 927 3,370 3,824 755 - 2014 11,376 184 1,094 10 282 889 3,320 4,242 1,355 - 2015 11,600 192 1,091 11 283 891 3,358 4,364 1,410 - 2016 11,776 192 1,112 11 274 892 3,376 4,469 1,450 - 2017 12,096 196 1,119 10 268 891 3,413 4,629 1,570 - 2018 12,176 198 1,116 9 260 888 3,441 4,653 1,611 - Change*(%) -2,10 538,71 227,27 28,57 -75,97 -44,71 -5,36 7,66 14,09 - Source: Anonymous (2019b); *Calculated values
Table 2. Number of combine harvesters in Karaman for last decade
Years Total Age groups of combine harvester
0-5 6-10 11-20 21< 2009 112 18 34 36 24 2010 112 18 34 36 24 2011 116 21 35 36 24 2012 125 26 38 38 23 2013 135 28 39 43 25 2014 142 32 41 44 25 2015 145 36 43 42 24 2016 150 41 44 42 23 2017 163 48 50 44 21 2018 164 51 51 42 20 Change*(%) 46.43 183.33 50.00 16.67 -16.67
Source: Anonymous (2019b); *Calculated values
Agricultural machinery and equipment of Karaman province between 2009 and 2018 are given in Table 3.Machines with an increase in decade change are tractor plow with disc, cultivator, roller, disc harrow, toothed harrow, combicure (mixed harrow), weed harrow, farm manure spreading machine, binder, baling machine, haymaker, potato lifter, combined sugar beet harvester, tractor drawn mower, weed silage machine, corn silage machine, corn harvesting machine, feed grinder, mulcher, engine pulverizator, pollinator, atomizer, electrical pump, deep-well pump, milking plant, milking machine (portable), trailer (agricultural truck), water tanker (used in agriculture), subsoiler, rotary tiller, stone picker, levee making machine, earth auger, animal or tractor drawn hoeing machine, pneumatic seeder, universal drill (mechanical) (including beet seeder), stubble drill, straw baler and hay making machine, straw conveyor and unloader, motor scythe, product classification machine (except selector), feed spreading trailer, drip irrigation system, bucket (used in agriculture).Machines with a decrease in 10-year change are primitive plow, animal plow, reversible plow, furrow opener plough, plow for stubble with disc (oneway), reversible plow for stubble, rotary cultivator, tractor drawn seed drill, combined seed drill, chemical fertilizer spreading machine, mowing machine, flail, beet lifter, selector (fixed or portable), pulverizator carried on shoulder, self-propelled engine pulverizator with stretcher and duster, tail shaft movable pulverizator, centrifugal pump, motor-pump (thermal), sprinkler system, cream separator, grader, straw threshing machine (thrasher) and churn. The most significant decrease is in animal plow and primitive plow
and it is related to increase of the use of mechanization in agriculture.
Tractor power groups and average tractor power of Karaman province are given in Table 4. When the Table 4 is examined, the total tractor power in 2009 was 582,984.00HP and in 2018 it was 577,389.50 HP. The average tractor power was calculated as 46.87 HP in 2008 and 47.42 HP in 2018.
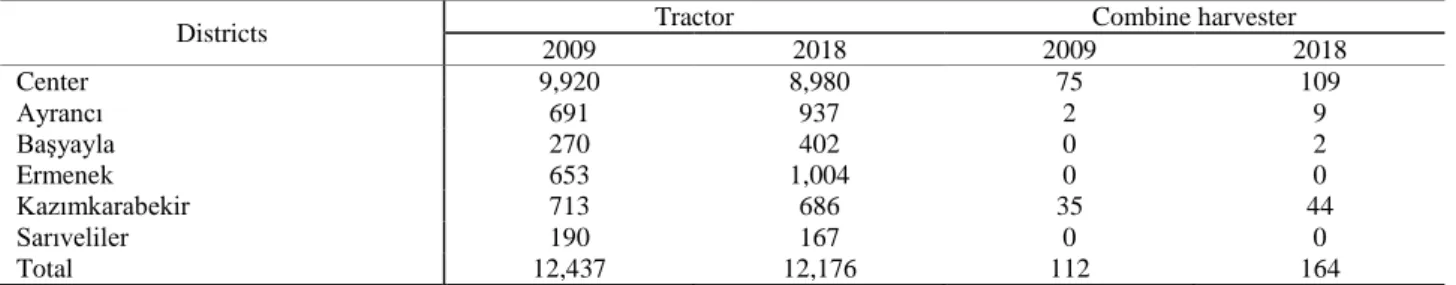
When Table 5 is examined, the district which has the highest number of tractors in 2009 is the Central district with 9,920 units, while Sarıveliler district with 190 units has the least tractor presence. In 2018, while the number of tractors in the central district decreased to 8,980, the minimum number of tractors was again in the Sarıveliler district and fell to 167. It was determined that the number of tractors in the Karaman province decreased by 2.10%.
Many criteria are used to determine the level of agricultural mechanization. The most commonly used ones are: Tractor engine power per total agricultural area, agricultural area per tractor, number of tractors per 1,000 ha agricultural area, amount of equipment per tractor (Kadayıfçılar et. al., 1990; Yavuzcan, 1994). When the Table 6 is examined, the number of tractors per 1,000 hectares area decreased from 52.27 in 2009 to 40.76 in 2018.The unit area processed by a tractor increased from 19.13 ha in 2009 to 24.54 ha in 2018.The power value per unit area decreased from 2.45 kW in 2009 to 1.93 kW in 2018.The number of equipment per unit tractor decreased from 10.66 in 2009 to 9.86 in 2018. The number of combine harvesters per 1,000 hectares increased from 0.47 in 2009 to 0.55 in 2018.
263 Table 3. Change in the number of agricultural machinery and equipment of Karaman province for last decade
Agricultural Machinery And Equipment 2009 2018 Decade Change*(%)
Primitive plow 1,685 1,181 -29.91
Animal plow 1,179 389 -67.01
Reversible plow 10,902 9,686 -11.15
Furrow opener plough 1,971 1,706 -13.44
Tractor plow with disc 874 901 3.09
Plow for stubble with disc (oneway) 2,093 1,781 -14.91
Reversible plow for stubble 2,042 1,277 -37.46
Rotary cultivator 2,395 2,209 -7.77
Cultivator 7,515 8,406 11.86
Roller 1,446 1,771 22.48
Disc harrow 1,280 1,699 32.73
Toothed harrow 679 778 14.58
Combicure (Mixed harrow) 105 189 80.00
Weed harrow 229 345 50.66
Animal drawn seed drill 90 - -100.00
Tractor drawn seed drill 4,495 4,145 -7.79
Combined seed drill 5,667 5,636 -0.55
Farm manure spreading machine 2 41 1,950.00
Chemical fertilizer spreading machine 8,396 7,663 -8.73
Mowing machine 3,039 1,288 -57.62 Binder 9 37 311.11 Baling machine 46 149 223.91 Haymaker 48 62 29.17 Flail 200 117 -41.50 Potato lifter 1 6 500.00
Sugar beet lifter 1,128 1,042 -7.62
Combined sugar beet harvester 213 355 66.67
Tractor drawn mower 224 310 38.39
Weed silage machine 59 182 208.47
Corn silage machine 151 341 125.83
Corn harvesting machine 20 23 15.00
Selector (fixed or portable) 27 23 -14.81
Feed grinder 115 245 113.04
Mulcher 11 60 445.45
Pulverizator carried on shoulder 5,347 4,876 -8.81
Self-propelled engine pulverizators with stretcher and duster 210 199 -5.24
Tail shaft movable pulverizator 6,900 6,616 -4.12
Engine pulverizator 774 813 5.04 Pollinator 14 21 50.00 Atomizer 118 187 58.47 Centrifugal pump 1,972 1,930 -2.13 Electrical pump 1,339 1,707 27.48 Motor-pump (Thermal) 2,541 1,654 -34.91 Deep-well pump 1,923 3,453 79.56 Sprinkler system 11,589 4,772 -58.82 Cream separator 5,814 1,143 -80.34 Milking plant 8 92 1,050.00
Milking machine (portable) 965 2271 135.34
Trailer (agricultural truck) 13,435 13,988 4.12
Water tanker (used in agriculture) 1,254 1,469 17.15
Subsoiler 99 197 98.99 Rotary tiller 2,239 2,268 1.30 Stone picker 5 20 300.00 Grader 579 467 -19.34 Ditchingmachine 6 20 233.33 Earth auger 95 167 75.79
Animal or tractor drawn hoeing machine 3,251 3,710 14.12
Pneumatic seeder 186 1,109 496.24
Universal drill (mechanical) (ıncluding beet seeder) 82 140 70.73
Stubble drill 2 19 850.00
Straw threshing machine (thrasher) 7,432 2,114 -71.56
Straw baler and hay making Machine 254 325 27.95
Straw conveyor and unloader 45 361 702.22
Motor scythe 145 811 459.31
Product dryer 2 2 -
Fruit harvesting machines - 7 -
Product classification machine (except selector) 8 10 25.00
Feed spreading trailer 8 107 1,237.50
Drip irrigation system 3,952 7,270 83.96
Churn 1,568 1,389 -11.42
Bucket (used in agriculture) 105 308 193.33
264 Table 4. Tractor power groups and average tractor power of Karaman province
Power Groups (HP)
TP 1-5 5< 1-10 11-24 25-34 35-50 51-70 70<
ATP 2.5 5 5.5 17.5 29.5 42.5 60.5 70
Years Tractor Numbers by Power Groups (HP)
2009 31 341 7 1,082 1,606 3,636 4,322 1,412 2010 33 381 7 993 1,468 3,341 4,333 1,427 2011 29 437 9 950 1,430 3,278 4,345 1,448 2012 43 645 10 325 1,032 3,245 3,627 593 2013 168 1,005 10 310 927 3,370 3,824 755 2014 184 1,094 10 282 889 3,320 4,242 1,355 2015 192 1,091 11 283 891 3,358 4,364 1,410 2016 192 1,112 11 274 892 3,376 4,469 1,450 2017 196 1,119 10 268 891 3,413 4,629 1,570 2018 198 1,116 9 260 888 3,441 4,653 1,611
Years Total Tractor Powers * (HP)
2009 77.50 1,705 38.50 18,935.00 47,377.00 154,530.00 261,481.00 98,840.00 2010 82.50 1,905 38.50 17,377.5 43,306.00 141,992.50 262,146.50 99,890.00 2011 72.50 2,185 49.50 16,625.00 42,185.00 139,315.00 262,872.50 101,360.00 2012 107.50 3,225 55.00 5,687.50 30,444.00 137,912.50 219,433.50 41,510.00 2013 420.00 5,025 55.00 5,425.00 27,346.50 143,225.00 231,352.00 52,850.00 2014 460.00 5,470 55.00 4,935.00 26,225.50 141,100.00 256,641.00 94,850.00 2015 480.00 5,455 60.50 4,952.50 26,284.50 142,715.00 264,022.00 98,700.00 2016 480.00 5,560 60.50 4,795.00 26,314.00 143,480.00 270,374.50 101,500.00 2017 490.00 5,595 55.00 4,690.00 26,284.50 145,052.50 280,054.50 109,900.00 2018 495.00 5,580 49.50 4,550.00 26,196.00 146,242.50 281,506.50 112,770.00
Years Total Tractor Powers*(HP) The Average Tractor Power* (HP) The Average Tractor Power* (kW)
2009 582,984.00 46.87 34.92 2010 566,738.50 47.30 35.23 2011 564,664.50 47.35 35.27 2012 438,375.00 46.05 34.31 2013 465,698.50 44.91 33.46 2014 529,736.50 46.57 34.69 2015 542,669.50 46.78 34.85 2016 552,564.00 46.92 34.96 2017 572,121.50 47.30 35.24 2018 577,389.50 47.42 35.33
TP: Tractor Power, ATP: The Average Tractor Power, Source: Anonymous (2019b), * Calculated values Table 5. Tractor and combine harvester numbers of Karaman province
Districts Tractor Combine harvester
2009 2018 2009 2018 Center 9,920 8,980 75 109 Ayrancı 691 937 2 9 Başyayla 270 402 0 2 Ermenek 653 1,004 0 0 Kazımkarabekir 713 686 35 44 Sarıveliler 190 167 0 0 Total 12,437 12,176 112 164 Source: Anonymous (2019b.)
Table 6. Calculated agricultural mechanization level indicators of Karaman province
Level of Mechanization* Years NT NCH AA ATP T H K E CH 2009 12,437 112 237,957 46.87 52.27 19,13 2.45 10.66 0.47 2010 11,983 112 233,527 47.30 51.31 19,49 2.43 11.26 0.48 2011 11,926 116 234,752 47.35 50.80 19,68 2.41 11.39 0.49 2012 9,520 125 281,307 46.05 33.84 29,55 1.56 14.25 0.44 2013 10,369 135 305,185 44.91 33.98 29,43 1.53 13.34 0.44 2014 11,376 142 309,247 46.57 36.79 27,18 1.71 10.72 0.46 2015 11,600 145 306,412 46.78 37.86 26,41 1.77 10.28 0.47 2016 11,776 150 301,749 46.92 39.03 25,62 1.83 10.18 0.50 2017 12,096 163 298,500 47.30 40.52 24,68 1.92 9.89 0.55 2018 12,176 164 298,756 47.42 40.76 24,54 1.93 9.86 0.55
NT: Number of Tractors, NCH: Number of Combine Harvester, AA: Agricultural Area (ha), ATP: Average Tractor Power (kW), T: Tractor / 1,000 ha, H: ha/ Tractor, K: kW/ ha, E: Equipment / Tractor, CH: Combine Harvester / 1,000 ha, Source: Anonymous (2019b), * Calculated values
265 Conclusions
Almost all of the 12,176 tractors in Karaman province consist of two axle tractors. Tractors with 26-50 kW and over 50 kW power are preferred for tractor power size. In the distribution of tractors by district, it was observed that the most tractors were located in Center and Ermenek districts.
In a survey conducted in Karaman province, tractor engine power was 54.90 kW, power per unit area was 3.39 kWha-1 and the number of tractors per 1,000 hectares was
found to be 61.75 (Yıldız et al., 2007).
When 2018 data in Table 6 and the results of the study of Yıldız et al. (2007) compared, it is seen that 13.62% decrease in tractor power by 47.42 kW in 2018; 43.07% decrease in power per unit area by 1.93 kWha-1 in 2018;
33.99% decrease in the number of tractors per 1,000 hectares by 40.76% in 2018.
When the number of machinery and equipment in Karaman province was examined, it was concluded that the tillage machines and equipment were widely used.
When the data of 2018 drill machines are examined, an increase of 496.24% is observed in pneumatic drills, 70.73% in universal drills (mechanical) and 850.00% in stubble drills. The reason why stubble drill has increased by 850.00% is that the Ministry of Agriculture and Forestry has supports as a grant to increase the use of stubble drill. Its use is expected to increase further in the coming years. In particular, tail shaft movable pulverizators are used in Karaman province. The numbers are 6,616. There was also an increase of 4.12% in engine pulverizators. Pulverizators carried on shoulder can be used both in vineyards and gardens easily. These pulverizators are 4,876 in number.
74.58% of the sugar beet harvest in the province is made with sugar beet lifter. The remaining 25.42% is harvested with combined beet harvester. When the 2018 data is considered, it is seen that the combined beet harvester has increased by 66.67%.
When the number of machinery and equipment for animal husbandry mechanization in 2018 is analyzed; there is an increase in farm manure spreading machine 1,950.00%, binder 311.11%, baling machine 223.91%, weed silage machine 208.47%, corn silage machine 125.83% and feed grinder 113.04%.The reason for the increase of these numbers is; as the feed is among the most important expense items in animal husbandry, it is due to the willingness of the producers to produce their own feeds and the purchase of these machines through governmental supported grants.
Agricultural mechanization is expensive and long-term investments for enterprises. Especially for subsistence family enterprises, the use of agricultural mechanization is low. For this purpose, agricultural mechanization usage levels of both enterprises and regional areas should be determined (Oğuz et al., 2017). The average age of the agricultural machinery park should be studied and their economic life should be questioned (Keleş and Hacıseferoğulları, 2016).
In Karaman province, common machinery usage systems should be established for agricultural machinery.
For joint machinery use, neighbor assistance should be used from models in developed countries such as contracting, machine associations, cooperatives, companies, producer associations, and state-owned joint use. Establishing machinery parks support in the IPARD program which is given by the Agriculture and Rural Development Support Institution within this scope should be focused on.
References
Anonymous. 2019a. http://www.karaman.gov.tr/ilin-cografi-bilgileri, [Date of access:05.07.2019]
Anonymous2019b. https://biruni.tuik.gov.tr/bitkiselapp/tarimalet.zul, [Date of access:01.07.2019]
Altıkat S, Çelik A. 2011. Iğdır İlinin Tarımsal Mekanizasyon Özellikleri. Iğdır Üniversitesi Fen Bilimleri Enstitüsü Dergisi, 1(4): 99-106, Iğdır.
Baran MF, Gökdoğan O, Durgut MR. 2014. Batı Marmara Bölgesi’nin Tarımsal Mekanizasyon Özellikleri, Türk Tarım ve Doğa Bilimleri Dergisi, 1(4): 561-567.
Eryılmaz T, Gökdoğan O, Yeşilyurt MK. 2014. Yozgat İlinin Tarımsal Mekanizasyon Durumunun İncelenmesi, Türk Tarım ve Doğa Bilimleri Dergisi, 1(2): 262–268.
Işık A. 1988. Sulu Tarımda Kullanılan Mekanizasyon Araçlarının Optimum Makina ve GüçSeçimine Yönelik İşletme Değerlerinin Belirlenmesi ve Uygun Seçim Modellerinin
Oluşturulması Üzerinde Bir Araştırma. Çukurova
Üniversitesi Fen Bilimleri Enstitüsü, Doktora Tezi, Adana. Işık E, Güler T, Ayhan A. 2003. Bursa İline İlişkin Mekanizasyon
Düzeyinin Belirlenmesine Yönelik Bir Çalışma. Uludağ Üniversitesi Ziraat Fakültesi Dergisi,17 (2): 125-136. Kadayıfçılar S, Öztürk R, Acar Aİ. 1990. Tarımsal Mekanizasyon
Derecesinin Değerlendirilmesi. Tarım Makineleri ve Bilimi ve Tekniği Dergisi, Cilt 2, No:1, 1-4.
Keleş İ, Hacıseferoğulları H. 2016. Konya İli Çumra İlçesi Tarım İşletmelerinin Tarımsal Yapı ve Mekanizasyon Özelliklerinin Belirlenmesi, Selçuk Tarım Bilimleri Dergisi, 3(1): 48-58. Koçak M. 2006. Bitlis İlinin Tarımsal Mekanizasyon Durumu,
Sorunları ve Çözüm Önerileri. Ankara Üniversitesi. Fen Bilimleri Enstitüsü. Yüksek Lisans Tezi. Ankara.
Koçtürk D, Onurbaş Avcıoğlu A. 2007. Türkiye’de İllere ve Bölgelere Göre Tarımsal Mekanizasyon Düzeyinin Belirlenmesi. Tarım Makinaları Bilimi Dergisi. 3(1) 17-24. Oğuz C, Bayramoğlu Z, Ağızan S, Ağızan K. 2017. Tarım
İşletmelerinde Tarımsal Mekanizasyon Kullanım Düzeyi, Konya İli Örneği, Selçuk Tarım ve Gıda Bilimleri Dergisi, 31 (1): 63-72.
Sabancı A, Akıncı İ. 1994. Dünyada ve Türkiye’de Tarımsal Mekanizasyon Düzeyi ve Son Gelişmeler. Tarımsal Mekanizasyon 15. Ulusal Kongresi, 20-22 Eylül, Antalya. Sessiz A, Eliçin AK, Esgici R, Tantekin F. 2012. Tarım
Makineleri Hibe Programının Diyarbakır İlinin
Mekanizasyon Gelişimine Katkısı. 27. Tarımsal
Mekanizasyon Ulusal Kongresi, 5-7 Eylül, 33-38, Samsun. Yalçın ÖF. 1990. Ankara İlinde Traktör Mülkiyeti ve Rasyonel
Kullanımı Üzerine Bir Araştırma, Ankara Üniversitesi Ziraat Fakültesi Yayınları, 1179 s,Ankara.
Yavuzcan G, Keskin R, Ayık M, Acar Aİ, Çelik A, Vatandaş M, 1986. Tarımsal mekanizasyon sorunları ve çözüm yolları. GAP Tarımsal Kalkınma Sempozyumu Bildiri Kitabı, Ankara Üniversitesi Basımevi, 453-467.
Yıldız MU, Dilay Y, Özkan A. 2007. Karaman İlinin Tarımsal Mekanizasyon Seviyesinin Belirlenmesi, Tarım Makinaları ve Bilimi ve Dergisi, 3 (4): 211-215.