1530-9932/20/0800-0001/0 # 2020 American Association of Pharmaceutical Scientists
Research Article
Polymeric Nanoparticle
Versus Liposome Formulations: Comparative
Physicochemical and Metabolomic Studies as
L
-Carnitine Delivery Systems
Merve Yaşacan,1,2
Açelya Erikçi,3Cemil Can Eylem,4Samiye Yabanoğlu Çiftçi,5Emirhan Nemutlu,4 Kezban Ulubayram,1,6andİpek Eroğlu1,6,7
Received 14 August 2020; accepted 12 October 2020
Abstract. L-Carnitine has attracted much more attention especially in the treatment of crucial diseases such as diabetes, regional slimming, and obesity because of its metabolic activities. However, because of its short half-life, low bioavailability, and inability to be stored in the body, frequent dosing is required. In this study, L-carnitine-loaded liposome (lipo-carnitine) and PLGA nanoparticle (nano-(lipo-carnitine) formulations were prepared and characterized. For lipo-carnitine and nano-carnitine formulations, particle size values were 97.88 ± 2.96 nm and 250.90 ± 6.15 nm; polydispersity index values were 0.35 ± 0.01 and 0.22 ± 0.03; zeta potential values were 6.36 ± 0.54 mV and − 32.80 ± 2.26 mV; and encapsulation efficiency percentage values were 14.26 ± 3.52% and 21.93 ± 4.17%, respectively. Compara-tive in vitro release studies of novel formulations and solution ofL-carnitine revealed thatL -carnitine released 90% of its content at the end of 1st hour. On the other hand, lipo--carnitine and nano-carnitine formulations maintained a controlled-release profile for 12 h. The in vitro efficacy of the formulations on cardiac fibroblasts (CFs) was evaluated by metabolomic studies and pathway analysis. Besides the prolonged release, lipo-carnitine/nano-carnitine formulations were also found to be effective on amino acid, carbohydrate, and lipid metabolisms. As a result, innovative nano-formulations were successfully developed as an alternative to conventional preparations which are available on the market.
KEY WORDS: nanoparticle(s); liposome(s); polyglycolic acid (PLGA); controlled release; drug delivery system(s).
INTRODUCTION
L-Carnitine is a naturally occurring compound in the
human body and also a critical co-factor in fatty acid metabolism; it facilitates the entrance of long-chain fatty acids into mitochondria, where it is metabolized for energy production. Although it is both endogenously and
exogenously supplied in the body, dietary ingestion is the main source ofL-carnitine (1,2).L-Carnitine is also available as a dietary supplement for the promotion of weight loss (3), athletic performance improvement (4,5), anti-aging process (6,7), and treatment of some diseases such as cardiovascular disorders (8), cancer (9,10), type 2 diabetes (11,12), HIV infection (13,14), and male infertility (15,16). The bioavail-ability of L-carnitine after oral administration is 5–18%
(17,18); but on the other hand, bioavailability depending on dietary intake from food was found to be higher (18). L
-Carnitine is abundant in red meat and dairy products, even though these sources are falling short ofL-carnitine levels due
to artificial feeding and mass production of meat in the market. In addition, there is a relationship between high-level cardiovascular diseases and high-level meat consumption (19). Several formulations of L-carnitine including oral solution, capsule, tablet, and intravenous forms are available on the market and continue to increase remarkably. There-fore, this commercial supplement is a promising product for athletes and those who aim to lose weight. Since it cannot be stored in the body and it has poor bioavailability together with short half-life span (30–60 min), frequent dosing over a long period of time is required to achieve an effective impact Supplementary Information The online version contains
supplemen-tary material available at https://doi.org/10.1208/s12249-020-01852-4.
1Nanotechnology and Nanomedicine Division, Institute for Graduate
Studies in Science and Engineering, Hacettepe University, Ankara, Turkey.
2ASELSAN Inc., Teknopark Istanbul, 34906, Istanbul, Turkey. 3Department of Biochemistry, Faculty of Pharmacy, Lokman Hekim
University, Ankara, Turkey.
4Department of Analytical Chemistry, Faculty of Pharmacy,
Hacettepe University, Ankara, Turkey.
5Department of Biochemistry, Faculty of Pharmacy, Hacettepe
University, Ankara, Turkey.
6Department of Basic Pharmaceutical Sciences, Faculty of Pharmacy,
Hacettepe University, Ankara, Turkey.
7To whom correspondence should be addressed. (e–mail:
(18,20). The increasing tendency to consume L-carnitine supplements also results in potential health risks. Based on this, novel drug delivery systems that will enhance the therapeutic strength and efficiency of this supplement while at the same time avoiding undesirable toxic effects may be required.
Over the past decades, serious developments have been recorded in the application of nanotechnology (liposomes, polymeric nanoparticles, microcapsules, etc.) for drug deliv-ery, targeting, controlled release, and enhancement of drug solubility. These systems are capable of elaborating the bioavailability and half-life of the active molecules while decreasing side effects by controlling the release mechanisms. Among these nano-drug delivery systems, liposomes are one of the most rewarding ones due to the compositional and structural similarity between their lipid bi-layered structures and cellular membranes; thus, they maintain enhanced penetration of the active molecules (21–25). As conferred in many researches, liposomes are self-assembled concentric lipid-bilayer vesicles enclosing packages of water and are originally considered for their amphiphilic nature: polar head groups covalently linked to hydrophobic hydrocarbon tails. All hydrocarbon tails are being preserved from water molecules while the hydrophilic phospholipid head parts contact with the surrounding aqueous medium (26–29). From another perspective, polymeric nanoparticles are widely used in the field of drug delivery because of their biocompatible, biodegradable, non-immunogenic characteristics in addition to excellent controlled-release properties (30–33). The most commonly used polymers for the formation of nanoparticles are chitosan, polylactide, polycaprolactones, and poly(lactic-co-glycolic acid). Many formulation parameters like prepara-tion method, molecular weight and copolymer ratio, homog-enization speed, and time as well as drug-polymer ratio might significantly affect the particle size distribution, surface morphology, release characteristics, and stability of the nanoparticles (34,35).
For years, several studies have been conducted in the field of biochemistry, biotechnology, and cell physiology to investigate cellular metabolism (36). The monitorization of the changes in cellular metabolisms plays a crucial role in the identification of underlying mechanisms of diseases like cancer, metabolic syndromes, and neurodegenerative disor-ders. Therefore, improvement of a suitable analytical method is very prudent for quantification of intercellular metabolism (37). Omic technologies are generally defined as analytical
methods utilized for the quantification of intracellular metab-olism. Cellular metabolism is characterized by intracellular metabolite levels, nutrient uptake rate, intracellular metabolic rates (pathways), and metabolite secretion rates as well as the activities on these cellular cycles (38). Metabolomics is characterized as the process of identification, detection, and also quantification of metabolites. Metabolite levels enable us to know the status of intracellular events, thus reflecting the phenotype of cells or tissues depending on the environmental/ genetic changes. On the other hand, metabolomic analysis does not reveal the whole metabolic story; thus, additional complemental factors are required for the clarification of reaction pathways (39–41). Intracellular biochemical pro-cesses and changes in the cellular functions at the molecular level are investigated by pathway analysis. Therefore, there is
a chance of gathering information regarding the molarflow of a reaction happening in the network via this analysis (38). Metabolomic studies have a great potential when it comes to pharmacological sciences particularly in the area of drug discovery, drug development, drug interaction mechanisms, and drug effectiveness as well as drug release/response systems.
In this study, we have focused on the formulation of L -carnitine-loaded liposomes (lipo-carnitine) and PLGA nano-particles (nano-carnitine) for oral use, in order to maintain an enhanced metabolomic profile with respect to freeL-carnitine
and overcome challenges encountered in the delivery of L -carnitine, for example, low bioavailability, necessity of frequent dosing (due to short half-life), and maintenance of a therapeutic plasma level with reduced toxicity. The effect of formulation parameters on the zeta potential (ZP), particle size (PS), polydispersity index (PDI), encapsulation efficiency (EE%), and in vitro release characteristics was investigated in detail. Metabolites, which are the compounds of intracellular metabolism, have been detected and quantified by snapshots in the metabolomic studies. In accordance with cell culture studies of the intracellular metabolomic and pathway analysis, different metabolite groups were screened and the impacts of free L-carnitine and L-carnitine contained in nano-carrier
systems at the cellular level were compared. Benefitting from the metabolomic studies, a detailed comparison of the impacts ofL-carnitine-loaded nano-systems and free L
-carni-tine on amino acid, carbohydrate, and lipid metabolisms was carried out.
MATERIALS AND METHODS Materials
L-Carnitine hydrochloride (≥ 98.0%) standard,
choles-terol, Resomer RG502H, poly(D,L-lactide-co-glycolide),
Pluronic F68, methoxyamine hydrochloride (~ 98%), aceto-nitrile, and dialysis tubing cellulose membrane were pur-chased from Sigma-Aldrich (USA). Soybean phospholipid (Lipoid S100) and phosphatidylcholine (Phospholipon 90G) were purchased from Lipoid GmbH (Germany). Chloroform, ethanol, methanol, sodium dihydrogen phosphate, Tween 80, pyridine, phosphoric acid, sodium 1-heptanesulfonate, tetra-hydrofuran, and ethyl acetate were purchased from Merck (Germany). Human cardiac fibroblasts and DMEM (Dulbecco’s modified Eagle medium) were provided from Lonza (Sweden). A bicinchoninic acid (BCA) assay kit was obtained from Boster (USA). Ultrapure water was obtained through a Milli-Q system (USA), and all other chemicals were extra pure or of chromatographic grade.
Quantification ofl-Carnitine by Chromatography
The high-performance liquid chromatography (HPLC HP1200, Hewlett Packard GmbH, Germany) system was equipped with a vacuum degasser, a quaternary pump, a column oven, an UV detector, and an injector with a loop of 100 μL. Peak areas were integrated by OpenLab software system automatically. The elution was carried out by using a C18 column (300 mm × 4.6 mm, 5 μm particle size). All
isocratic conditions with mobile phase comprising 0.05 M phosphate buffer (pH 2.4):methanol (450:50 (v,v)), including 0.56 mg/mL of sodium 1-heptanesulfonate. The mobile phase was pumped at a flow rate of 1.0 mL/min. Signal detection wasfinalized at a wavelength of 200 nm after the injection of 60 μL of the sample. Two different sets of L-carnitine
reference solutions were prepared at 2 mg/mL concentration in water. Reference solution 1 was injected in 6 and reference solution 2 was injected in 2 consecutive lines. The analysis was continued by checking the compatibility between refer-ence solution 1 and referrefer-ence solution 2 (98–102%). L
-Carnitine HCl stock standard solution was prepared in the concentration 20 mg/mL using ultra-pure water. Standard solutions were diluted at concentration levels of 50, 100, 200, 500, 1000, 2000, and 2500μg/mL over 6 replicates.
Method Validation
The abovementioned analytical method has been vali-dated through parameters such as linearity, specificity, precision, accuracy, robustness, limit of detection (LOD), limit of quantification (LOQ), and stability according to the ICH guideline (42). For this purpose, linearity was evaluated by determining seven different standard solutions within a concentration range of 50–2500 μg/mL. The solution concen-trations versus absorbance units were plotted on a calibration curve. The intercept, slope, and coefficient of determination (r2) were determined and simple linear regression statistics
was performed by applying the least squares method. The regression coefficient and intercept’s significance were tested using t tests.
The specificity tests of the analytical method were applied to investigate the capability of this analytical method to selectively separateL-carnitine HCl from other substances existing in the medium. Dilution solution, placebo solution, reference solution, test solution, and phosphate buffer solution (PBS, pH 7.4) as well as in vitro release medium solution were prepared, and the chromatograms were com-pared. For recovery studies, 3 different standard concentra-tions of L-carnitine HCl (50, 500, and 2500 μg/mL) were analyzed in triplicate by spiking their own placebo. Accuracy test solutions were prepared in 3 different days as done in the recovery test. For the repeatability studies, reference solu-tions (2 mg/mL) were prepared in double and 6 consecutive injections were carried out for thefirst one and 2 consecutive injections for the second one in the same day (intraday). To check the reproducibility, freshly prepared reference solu-tions were analyzed at 3 different days (intraday); all results were compared in terms of RSD%.
Conditions of robustness analysis were set as follows: flow rate (± 0.1 mL/min), mobile phase methanol volume % (± 2%), UV detection wavelength (± 5 nm), and sodium 1-heptanesulfonate concentration in buffer (± 0.25 mM). The parameters were compared with the standard method’s peak area and retention time measurements by the calculation of standard deviation and RSD%.
The sensitivity of the analytical method was determined by the calculation of the LOD and LOQ parameters. LOD and LOQ were defined over the signal/noise (S/N) ratio. LOQ solution was prepared at 5 μg/mL concentration and injected for 6 replicates. The consecutiveness of the injections
was evaluated in terms of RSD% and S/N was ensured it is≥ 10. LOD solution was prepared in 1.5μg/mL concentration and checked if S/N is < 3.
Last but not the least, the stability parameter was investigated after the preparation of 500μg/mL concentration solution, which was kept at ambient temperature for 48 h. Finally, peak areas were compared using assay analysis.
Preparation of Nano-carnitine and Lipo-carnitine Formulations
Preparation of PLGA Nanoparticles
L-Carnitine HCl–loaded PLGA nanoparticles were
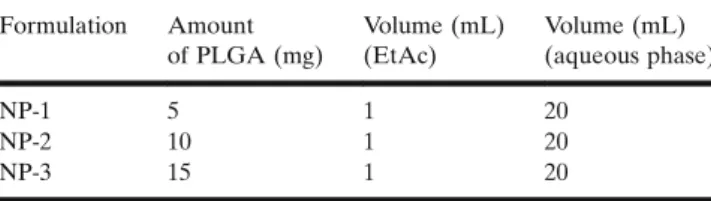
pre-pared by water-in-oil-in-water (W/O/W) double emulsion method. Different proportions of PLGA polymer (0.25, 0.50, 0.75 mg/mL) were used to prepare nanoparticle formulations in order to examine the effect on encapsulation efficiencies (Table I). Two hundred microliters L-carnitine HCl stock solution (20.000 mg/mL) was added dropwise into three different concentrations (5 mg/mL, 10 mg/mL, 15 mg/ mL) of polymer solutions dissolved in ethyl acetate (EtAc) and the mixture homogenized with ultra-turrax (Pro200 Homogenizer, ProScientific, USA) at 10,000 rpm for 1.5 min to prepare primary emulsion. The primary emulsion was added dropwise to 2% (w/v) Pluronic F68 aqueous solution (5 mL) by means of a syringe followed by mixing with the help of the ultra-turrax at 20,000 rpm for 2 min to obtain a secondary emulsion. Finally, secondary emulsion was added to the 0.5% (w/v) Pluronic F68 solution (15 mL) and stirred (100 rpm, 30 min) to fabricate the nanoparticles. In order to remove residual solvent, the emulsion was additionally stirred overnight at + 4°C. Nanoparticle suspension was initially centrifuged at 5000 rpm at + 4°C for 5 min in order to remove macro residues. At the second step, the remaining suspension was centrifuged at 50,000g at + 4°C for a period of 45 min to obtain precipitated nanoparticles.
Preparation of Liposomes
Liposome formulations were prepared by thin film hydration method (43,44) using two different lipids (Lipoid S100, Phospholipon 90G) having different lipid ratios (2 mg/ mL, 4 mg/mL, 20 mg/mL) as presented in TableII. Briefly, a
selected amount (50, 100, 500 mg) of specific lipid and cholesterol as stabilizer (0.6 mg/mL, 1.2 mg/mL, 6 mg/mL, respectively) were dissolved in 25 mL of chloroform:Tween 80 (1:1 M ratio) solution in a round-bottomed 100-mLflask. The organic solvent was evaporated by a rotary evaporator (Buchi R-114, Marshall Scientific, NH, USA) in a 40°C water bath, 100 rpm for 1 h under vacuum. Thin lipid film was obtained (45) then hydrated with API (2 mg/mL) that has been previously dissolved in 25 mL distilled water for 30 min with the help of a magnetic stirrer (200 rpm) to achieve a crude dispersion of liposomes. Liposomal suspension was sonicated (Bandelin Sonopuls HD 2070, Berlin, Germany) for 15 min and 35 min/2 cycles at 50% of amplitude (46). Liposomes were centrifuged at 20,000g rotation speed and + 4°C for 1 h.
Characterization of PLGA Nanoparticles and Liposomes Particle Size Distribution, Zeta Potential, and Polydispersity Index
The particle size distribution, polydispersity index, and zeta potential of liposomes of the nanoparticle formulations were figured out at 25°C using the dynamic light scattering method with the aid of Malvern Zetasizer Nano ZS (Malvern Instruments Ltd., UK). The formulations’ zeta potential values were achieved by measurement of either the surface ionization on the nanoparticles in a water-based dispersion medium or the surface charge organized by the surface-adsorbed ions. In order to obtain this, an electricalfield was performed to the nanoparticles and the movement speeds of these particles (depending on this electrical field) were determined using the Malvern Nano-ZS device.
TGA/DSC and FTIR/ATR Analysis
For understanding the thermal and polymorphologic characteristics of nanoparticles and liposomes, thermal gravimetric/differential scanning calorimetric analysis (TGA/ DSC) was conducted (TA Instruments, Q600 SDT, USA). Derivative thermal gravimetry (DTG) thermograms were drawn by taking the first derivatives of the data obtained from TGA analysis. DTG curves were obtained under this condition: temperature ranging from 25 to 500°C and a heating rate of 20 mL/min under 1.5 bar N2 atmosphere.
Fourier transform infrared spectroscopy/attenuated total reflectance (FTIR/ATR) (Thermo Fisher, Nicolet is50, USA) was used to confirm the encapsulation of L-carnitine
HCl inside nanoparticles and liposomes. Freeze-dried sam-ples in contact with the ATR crystal were scanned in the IR range from 650 to 4000 cm−1.
Morphological Evaluations
Morphological analyses of liposomes and nanoparticles were performed by using a scanning electron microscope (SEM) (Tescan, GAIA 3, Czech Republic). Nanoparticles and liposomes were coated with a thin gold-palladium alloy layer (~ 2 nm thickness) by spraying method prior to SEM analysis.
Encapsulation Efficiency
After the separation of the supernatant phase as mentioned in the“Preparation of PLGA Nanoparticles” and
“Preparation of Liposomes” sections, solutions were analyzed
for the quantification of active pharmaceutical ingredient (API) by HPLC. The encapsulation efficiency (EE%) was evaluated with the ratio of quantified drug amount to initial drug amount.
Formulation Stability
The stability of the nanoparticles and liposomes was investigated for 3 months at temperatures + 4°C and 25°C, by means of characterization of particle size, zeta potential, and polydispersity index as well as encapsulation efficiency analysis. Samples were analyzed in each month, and the results were statistically compared using the significance level of p = 0.05.
In Vitro Release Studies
L-Carnitine HCl–loaded nanoparticles,L-carnitine HCl–
loaded liposomes (n = 6), and the control group of the two samples that contains the same concentration of L-carnitine
HCl aqueous solution (2 mg/mL) were packed (2 mL) into cellulose acetate dialysis membranes (Sigma-Aldrich, 33 mm, MW cut-off 14,000; USA). The membranes were placed in 6 mL of PBS (pH 7.4) inflasks. These flasks were positioned in a water bath over a magnetic stirrer (37 ± 0.5°C) that rotates at 100 rpm. Since these formulations are intended for oral use and taking the gastrointestinal transit time into consideration, at predetermined time intervals (0, 1, 2, 4, 6, 8, and 12 h), 0.5 mL of samples was withdrawn and then replaced with a fresh medium immediately in order to sustain sink conditions. The amount ofL-carnitine HCl in the samples
was analyzed by validated HPLC method. The cumulative released amount ofL-carnitine HCl was plotted against time, and the release profiles were determined.
Cell Culture Studies
Cardiac fibroblasts (CFs) were cultured in DMEM supplemented with 10% fetal bovine serum, 100 U/mL penicillin, and 100 mg/mL streptomycin (complete medium). Then, the cells were incubated at 37°C in a humidified incubator and 5% CO2. After the cells reached approximately
80% confluency, the groups were arranged and stimulated as follows: (i) control (no treatment), (ii) 2 mg/mL free L
-carnitine HCl in aqueous solution, (iii)L-carnitine HCl loaded in PLGA nanoparticles (nano-carnitine) with 17% encapsu-lation efficiency at a concentration of 2 mg/mL, and (iv) L -Table I. Polymeric Nanoparticle Compositions
Formulation Amount of PLGA (mg) Volume (mL) (EtAc) Volume (mL) (aqueous phase) NP-1 5 1 20 NP-2 10 1 20 NP-3 15 1 20
NPpolymeric nanoparticle formulations
Table II. Liposome Compositions Prepared Using Different Lipid Concentrations
Formulation Lipid name Lipid concentration
Lipo-1 Phospholipon 90G 2 mg/mL Lipo-2 4 mg/mL Lipo-3 20 mg/mL Lipo-4 Lipoid S100 2 mg/mL Lipo-5 4 mg/mL Lipo-6 20 mg/mL
carnitine HCl loaded in liposomes (lipo-carnitine) with 17% encapsulation efficiency at a concentration of 2 mg/mL. Each group had three repeated samples and stimulated for 6 days. Metabolomic Evaluation
Metabolomic analysis has been investigated in order to evaluate the efficacy of this new treatment option at cellular level. Metabolites are the intermediates produced during biochemical reactions and converted to other compounds without any accumulations in living cells. In this study, the metabolomic analysis has been performed by gas chromatography-mass spectroscopy (GC-MS) (Shimadzu GC/MS QP2010, Japan) technique and examined in two parts: the first part involved the identification/quantification of the metabolites, and the second part involved the evaluation of the functionality of the metabolites via pathway analysis of substrates that were metabolized to sub-products through various metabolic ways. For metabolomic analysis, the cells were extracted using 1 mL of methanol:water (9: 1, v/v) solution and stored in Eppendorf tubes. Afterwards, 500 μL of this solution was evaporated to dryness at + 4°C u s i n g a v a c u u m c e n t r i f u g e . T h e r e s i d u a l s w e r e methoxyaminated using 20μL of methoxamine hydrochloride in pyridine (10 mg/0.5 mL) for 90 min at 30°C and derivatized using 80μL of N-methyl-N-(trimethylsilyl)trifluoroacetamide (MSTFA) at 37°C for 30 min. At the end of this period, the solutions were transferred to GS-MS vials for analysis. This method was carried out using ultra-split/splitless injector that has been equipped with a N2carrier gas system. The elution
was obtained by an Agilent 122-5532G DB5-MS (30 m, 0.25 mm, 0.25μm, 95% dimethyl/5% dimethylpolysiloxane) column at 290°C MSD transition temperature with aflow rate of 0.99 mL/min, 1μL injection volume, and 5.90 min solvent delay time. Analysis time was set as 37.5 min.
Statistical Analysis
Statistical data analysis was conducted using a one-way ANOVA followed by a multi-parametric Tukey’s post hoc test with p < 0.05 as the minimal level of significance.
RESULTS AND DISCUSSION
Analytical Method Validation forl-Carnitine HCl
Linearity of the analytical method was evaluated by simple linear regression. The developed HPLC method was found to be linear within a concentration range of 50– 2500μg/mL with an r2value of 1. Using t test, the intercept was found to be statistically not different from zero (pintercept= 0.097); however, the slope happened to be
statistically different from zero (pslope= 5.53 × 10⁻¹²). The
calibration curve used in the quantification of L-carnitine HCl was calculated as y = 0.8526x− 6.9401. The sensitivity parameter of the analytical method was investigated through the calculation of the signal-to-noise ratio (S/N) for the limit of detection (LOD) and limit of quantification (LOQ). LOD and LOQ solutions were prepared at 1.5μg/mL and 5 μg/mL, respectively. The S/N of theL-carnitine HCl peak obtained
from the LOD solution was found to be < 3, and the mean S/
N of the L-carnitine HCl peak of the LOQ solution was calculated at 10.7 with RSD% being 3.74 after 6 consecutive injections. These results might be classified as compatible with the approach specified in the European Pharmacopoeia (EP) and International Conference on Harmonization (ICH) (47,48).
The selectivity of the method was tested with comparison of standard, placebo, and L-carnitine HCl–loaded product
chromatograms. No interfering peaks were observed in chromatograms originating from either the chemicals, the reagents used in the analytical method, or the excipients added in formulations. The chromatographic conditions were detected to be specific for the detection and the quantification ofL-carnitine HCl (Supplemental1).
The accuracy and precision of the analytical method were investigated at three concentrations ofL-carnitine HCl determined as low, medium, and high (50, 500, and 2500μg/ mL). The accuracy of the method was evaluated by recovery capability. For all the abovementioned concentration points (low, medium, and high concentrations), recovery of L
-carnitine HCl varied within the range of 98.8–100.8% (Supplemental 2). Precision of the method was evaluated over the repeatability and intermediate precision at three concentrations and lower RSD% (< 2%) values with intra-and inter-day studies (Supplemental 3). The low RSD% values proved that the method precision was sufficient for the quantification ofL-carnitine.
The robustness of the method was evaluated with RSD% values of L-carnitine HCl peak areas obtained with a
combination of 6 consecutive injections at optimum condi-tions and 6 consecutive injeccondi-tions at altered chromatographic conditions. The lower RSD% (< 2%) values showed that there is no difference between optimum conditions and altered conditions except for flow rate which has high RSD% compared to the others. Therefore, the flow rate must be set carefully to prevent any variation in the analysis (Supplemental4).
Finally, as for the investigation of stability of the analytical method, 500μg/mL standard solution was prepared and allowed to stand at room temperature for 48 h. After the analysis, the consistency between peak area values was found to be 98.5%.
Characterization of Formulations
Particle Size/Zeta Potential/Polydispersity Index
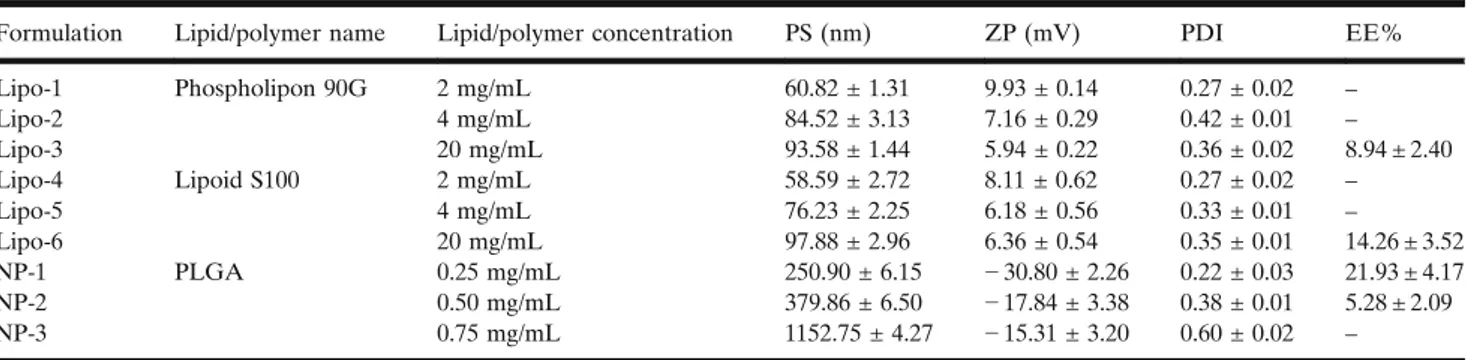
Measurements of nano- and lipo-carnitine formulations were carried out over 3 replicates, and the results were expressed as mean PS, ZP, and PDI with the RSD values (TableIII). PS of the L-carnitine HCl–loaded PLGA
nano-particles increased significantly with increasing concentration (p < 0.05) of lipid/polymer. ZPs varied between− 2.43 and − 32.86 depending on polymer concentration. ZP is a critical parameter with regard to quality as well as an important indicator of the stability of the suspensions. Nanoparticle formulations that were prepared by Pluronic F68 yielded negatively charged nanoparticles, and this was in accordance with thefindings in the literature (49,50).
The size of the drug-loaded liposomes varied between 50 and 100 nm, and PDI values ranged from 0.27 to 0.42. As
expected, PS increased depending on the increasing amount of lipid; meanwhile, PDI was found to be higher. One of the main reasons for the low stability of drug-loaded liposomes is the increment in lipid surface oxidation and loss of polarity over time (51). ZPs range between 6 and 10 mV, and this value correlated with the slightly positive values found in the literature (52,53). Not only Phospholipon 90G and Lipoid S100 but also Tween 80, which is a surface-active reagent, was in neutral form in our formulations. Cholesterol was used as stability enhancer in the formulations (with a molar ratio of 10/1 in the liposome samples). Positive ZP results are expected in liposomes prepared with neutral lipids that have low cholesterol contents (lipid:cholesterol, 9:1 M ratio) (54).
Encapsulation Efficiency
To determine the encapsulation efficiency ofL-carnitine,
centrifugation was performed following the preparation of liposomes and nanoparticles; the amount of freeL-carnitine in
the aqueous outer phase was determined by HPLC (TableIII).
In PLGA-based nanoparticles, L-carnitine loading was achieved in NP-1 and NP-2 formulations. As the amount of polymer increased, the nanoparticle size increased excessively out of control. Therefore, the NP-1 (nano-carnitine) formula-tion with moderate PS (250.9 ± 6.15 nm) and the highest ZP (− 30.80 ± 2.26 mV) as well as the highest encapsulation efficiency (21.93% ± 4.17) was selected for further studies.
According to previous literature data, encapsulation values of hydrophilic molecules entrapped in PLGA NP’s were similar to our results (55), but lower. In addition to that, although the molecule is small, it is hydrophilic in nature, thus limiting the encapsulation into hydrophobic polymers (55). In order to overcome this, we enhanced the encapsulation by the incorporation of Tween 80 in liposome formulations and of Pluronic F68 in nanoparticle formulations.
L-Carnitine was not encapsulated in any liposome
formulation except Lipo-3 and Lipo-6. Encapsulation effi-ciency increased with increasing lipid amount in the formu-lation. Phospholipon 90G–based liposomes contained ~ 90% phosphatidylcholine while Lipoid S100-Soy phosphatidylcho-line contained ~ 100% phosphatidylchophosphatidylcho-line. Phosphatidylcho-line consists of long saturated fat chains.
As the phosphatidylcholine content increases, the lipo-some becomes more stable. In fact, it becomes much difficult
forL-carnitine to move out of the liposomal structure; hence, the more active ingredient remained trapped inside the structure. In the light of the information above, the experi-mental studies were continued using Lipo-6 (lipo-carnitine) with the highest encapsulation efficiency (14.26 ± 3.52%). FTIR/ATR Results
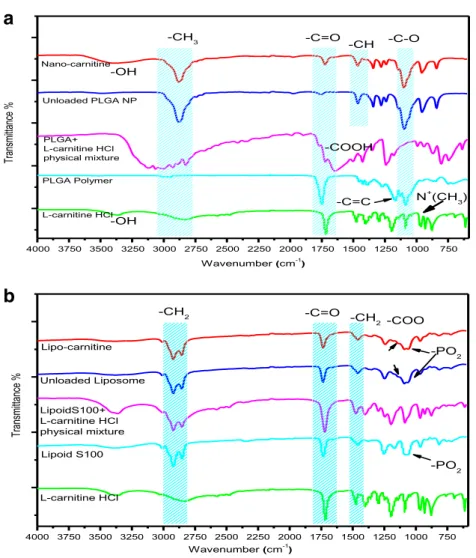
Figure1a illustrates the IR spectra of L-carnitine HCl, nano-carnitine, and PLGA samples. L-Carnitine and
nano-carnitine exhibited OH stretching at 3429.76 cm−1. C–O stretching at the 1145.13 cm−1 band was observed intensely in unloaded PLGA NP and nano-carnitine. The high peak at 2878.83 cm−1 observed in nano-carnitine and unloaded PLGA NP spectra was due to the CH3stretching.
The peak observed at the 1728.77 cm−1 band (C=O stretching) was strongly evident in the spectra ofL-carnitine
and PLGA polymer; however, the peak was found to be decreased and moderate in the spectra of unloaded PLGA NP and nano-carnitine, respectively. Since the PLGA polymer chains were converted to spherical form during nanoparticle synthesis, it is assumed that only C=O stretching in the outer shell structure could be detected. Information on the electron absorbed from the spherical structure cannot be obtained, because the FTIR/ATR technique saves IR data directly from the microsphere surface. The intensity of this peak in the loaded nano-carnitine spectrum was increased compared to that in the unloaded one. With respect to this, it can be concluded thatL-carnitine did not just partially enter into the structure, but it also formed structures bound/ absorbed to nanoparticles during synthesis. On the other hand, the characteristic N (CH3) stretching (moderate
intensity) was observed in the L-carnitine spectrum at
928.90, 879.15 cm−1, and because it is less obvious in the nano-carnitine spectrum, it was concluded that L-carnitine
was partially encapsulated in PLGA NPs.
Figure 1 b presents the IR spectra of L-carnitine HCl,
lipo-carnitine, unloaded liposome, and lipidic samples. Spe-cific ethylene structure (2930.75, 2852.04 cm−1) was observed
in the spectrum of lipo-carnitine, unloaded liposome, lipoid S100 +L-carnitine HCl physical mixture, and Lipoid S100. In all spectra, intense ester carbonyl group C=O stretching at the 1730 cm−1 band was changed depending on the number of repeating groups in the substance. The spectra of the loaded and unloaded liposomal structures were almost identical. One Table III. PS, ZP, PDI, and EE% Values of Formulations
Formulation Lipid/polymer name Lipid/polymer concentration PS (nm) ZP (mV) PDI EE%
Lipo-1 Phospholipon 90G 2 mg/mL 60.82 ± 1.31 9.93 ± 0.14 0.27 ± 0.02 – Lipo-2 4 mg/mL 84.52 ± 3.13 7.16 ± 0.29 0.42 ± 0.01 – Lipo-3 20 mg/mL 93.58 ± 1.44 5.94 ± 0.22 0.36 ± 0.02 8.94 ± 2.40 Lipo-4 Lipoid S100 2 mg/mL 58.59 ± 2.72 8.11 ± 0.62 0.27 ± 0.02 – Lipo-5 4 mg/mL 76.23 ± 2.25 6.18 ± 0.56 0.33 ± 0.01 – Lipo-6 20 mg/mL 97.88 ± 2.96 6.36 ± 0.54 0.35 ± 0.01 14.26 ± 3.52 NP-1 PLGA 0.25 mg/mL 250.90 ± 6.15 − 30.80 ± 2.26 0.22 ± 0.03 21.93 ± 4.17 NP-2 0.50 mg/mL 379.86 ± 6.50 − 17.84 ± 3.38 0.38 ± 0.01 5.28 ± 2.09 NP-3 0.75 mg/mL 1152.75 ± 4.27 − 15.31 ± 3.20 0.60 ± 0.02 –
can say that L-carnitine was encapsulated within the inner layer of the liposomal structure due to its hydrophilic structure. Consequently, thefingerprint region vibrations of
L-carnitine could not be detected. This also goes to support the conclusion that FTIR/ATR provides information on vibration obtained, from the surface of the material.
Thermal Behavior of Nano-carnitine and Lipo-carnitine Structures
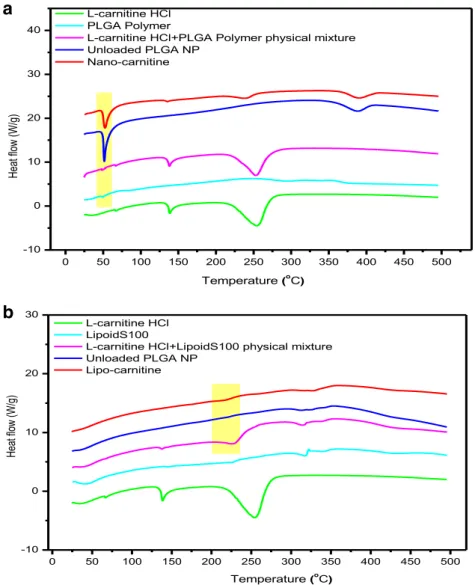
Unloaded and L-carnitine-loaded liposomes as well as PLGA NPs were lyophilized and their thermal properties analyzed. Derivative thermal gravimetry (DTG) thermo-grams were drawn from the first derivative of the data obtained from TGA analysis. Figure2a shows DTA curves ofL-carnitine HCl, nano-carnitine, unloaded PLGA NPs, and PLGA polymeric structures.L-Carnitine HCl started to melt
around 220°C, and a sharp endothermic melting peak was detected at 250°C. Tg was observed at 50°C as mentioned in the literature (56,57). Thermograms of L-carnitine encapsu-lated and unloaded PLGA NPs revealed similar findings except that the endothermic melting peak of L-carnitine at 250°C became apparent in the case of encapsulated PLGA
NPs. DTA curves ofL-carnitine HCl, lipo-carnitine, unloaded liposome, and Lipoid S100 lipidic structures are shown in Fig.2b.
The Lipoid S100 thermogram exhibited an endothermic melting peak at ~ 50°C and at 317°C; the degradation of the lipidic structure caused an exothermic curve. In the physical mixture, the endothermic melting peak of L-carnitine was observed suppressively at 225°C. The aforementioned peak was not observed in the case of the unloaded liposome structure, even though the peak was very slightly recorded in the lipo-carnitine structure. Similar thermogram results were obtained in the analysis of lyophilized formulations. When low percentage encapsulation is observed, it is safe to conclude that the active substance was loaded into liposomes in amorphous order during the encapsulation (54).
Surface Morphology
A scanning electron microscopy (SEM) study was performed to investigate the surface characteristics of nano-sphere formulations. Figure 3 shows SEM images of L
-carnitine loaded and unloaded PLGA–based NPs. It has been observed that PLGA-based nanoparticles were not
a
b
Fig. 1. FTIR/ATR spectra of a nano-carnitine, unloaded PLGA NP, PLGA andL-carnitine HCl physical mixture, PLGA polymer, andL-carnitine HCl and b lipo-carnitine, unloaded liposome, Lipoid S100 andL-carnitine HCl physical mixture, Lipoid S100, andL-carnitine HCl
aggregated but homogeneously distributed and also had a spherical structure with a smooth surface.
Due to the increase in temperature generated as a result of an electron beam applied on the sample, deformations and coalescence were observed (Fig.3g) especially in the images of the liposomal structures. According to SEM investigations, Lipoid S100–soy phosphatidylcholine–based liposomes ap-peared to have a spherical structure with smooth surfaces. In Vitro Release Studies
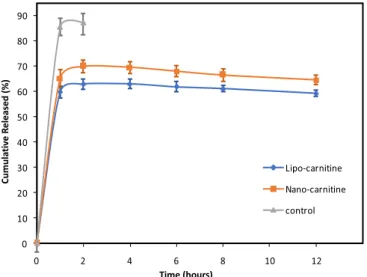
In vitrorelease studies were done by dialysis membrane method, and cumulative released percentages ofL-carnitine were plotted against time for the purpose of characterizing the in vitro release tendency for discriminating the effect of formulation types as shown in Fig. 4. Approximately 90% release was achieved at the end of thefirst hour in the case of the control group. In the meantime, a sustained-release
profile was observed in liposome and nanoparticle formula-tions. A burst effect release was observed at the end of the first hour for both formulations, and the amounts of L -carnitine released for liposome and nanoparticle formulations were 59.90% and 65.19%, respectively.
Stability Studies
Stability tests were carried out for nano-carnitine and lipo-carnitine formulations for a period of 3 months (Fig.5). At the end of the 3rd month under a temperature of + 4°C, no difference was observed in any macroscopic evaluations conducted or both nano-carnitine and lipo-carnitine formula-tions. Nevertheless, at the end of the 2nd month, the polydispersity index of lipo-carnitine formulation was in-creased due to the sedimentation at 25°C. The particle size of formulations, conditioned at + 4°C, did not evolve signif-icantly (p 0.05).
a
b
Fig. 2. DTA curves of a nano-carnitine, unloaded PLGA NP, PLGA andL-carnitine HCl physical mixture, PLGA polymer, and L-carnitine HCl and b lipo-carnitine, unloaded liposome, Lipoid S100 andL-carnitine HCl physical mixture, Lipoid S100, andL-carnitine HCl
GC-MS-Based Metabolomic Evaluation
For metabolomic analysis, chromatograms were col-lected with the help of Shimadzu LabSolution software installed on the GC-MS instrument. The GC-MS chromato-grams were deconvoluted to obtain the peaks of the metabolites using MSDIAL software, and the retention times were corrected to form data matrices. Retention index libraries allowed to 128 metabolites identification from cardiacfibroblast cell lines. Metabolites were compared with ttest after normalization procedures. The data was visualized with the aid of partial least squares discriminant analysis (PLS-DA) graphs. The presence of metabolites causing differentiation was revealed by the PLS-DA graph (Fig.6a), and the results were transferred to variable important in project graph (Fig. 6b); this variable represents a list of molecules that have the greatest effect on the separation of metabolomic profiles.
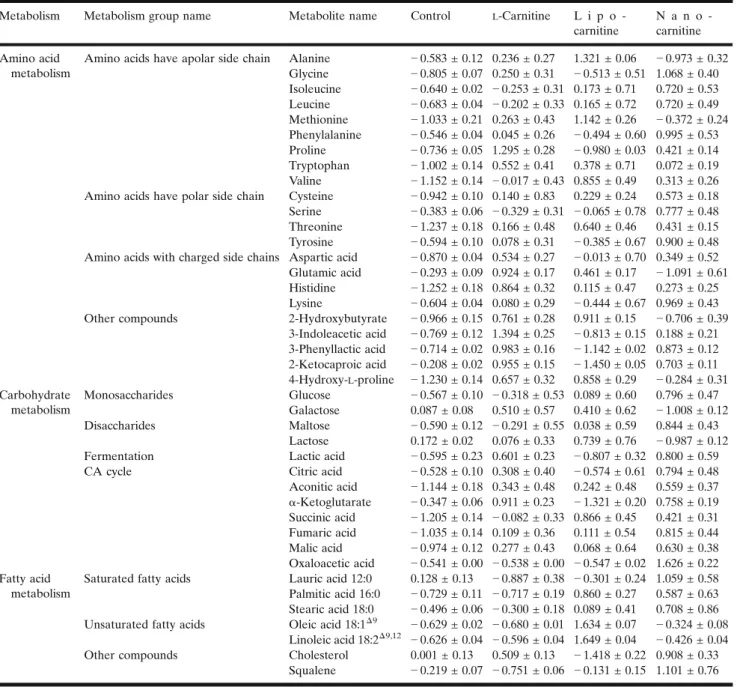
Metabolite levels belonging to the control group (ex-posed to no medium other than DMEM), free L-carnitine,
nano-carnitine, and lipo-carnitine formulation groups are summarized in TableIV. To evaluate the metabolisms of the detected metabolites, the metabolites belonging to amino acid, carbohydrate, and lipid metabolisms were identified and the rate of differentiation of metabolites in groups are classified in TableIV.L-Carnitine is an amino acid synthesized endogenously from lysine and is therefore expected to have an effect on the content of the hypothetical amino acid pool.
L-Carnitine-free solution was used for the control group; lipo-carnitine and nano-lipo-carnitine formulations were found to cause an increase in amino acid levels as shown in TableIV
(p < 0.05). The structure of the side chains carried by the amino acids (apolar, polar, or charged) tends to be affected by the formulation. For instance, lipo-carnitine and nano-carnitine formulations were found to be more efficient in terms of increasing the level of amino acids that possess apolar side chain compared to the solution form. Lipo-carnitine formulation was found to be the most effective group in terms of increasing the levels of methionine and threonine amino acids which are produced by the aspartate
a
b
d
c
e
f
g
h
Fig. 3. SEM images of a, b unloaded; c, dL-carnitine-encapsulated, PLGA NPs; e, f unloaded; g, hL-carnitine-encapsulated, liposomes
Fig. 4. In vitro drug release profiles of nano-carnitine formulations, lipo-carnitine formulations, and control group (n = 6, error bars indicate standard deviations)
pathway (p < 0.05). 2-Hydroxybutyrate, a product of catabo-lism that occurs in both of these two amino acids, was found to increase with lipo-carnitine than the other groups (p < 0.05). This explains why lipo-carnitine is significant in increasing the levels of methionine and threonine amino acids.
Not only the production of these two amino acids but also their catabolism was increased by lipo-carnitine. Nano-carnitine was found to be the most efficient in terms of increasing the level of amino acids that carry polar side chains as well as increasing phenylalanine anabolism. On the other hand, lipo-carnitine was effective in inhibiting 3-phenyllactic acid formation and, hence, phenylalanine catabolism (p < 0.05). 2-Ketoisocaproic acid (an intermediate product in-volved in the metabolism of the leucine amino acid) showed a significant decrease in lipo-carnitine (p < 0.05), but on the contrary showed an effective increase in nano-carnitine.
As a result, one can conclude that the nano-carnitine formulation increased leucine anabolism in the most effective manner (p < 0.05), while the lipo-carnitine formulation reduced catabolism in the most effective way (p < 0.05). Hydroxyproline, which is formed by proline hydroxylase enzyme activity during the posttranslational modification of proline, together with glycine amino acid are the building blocks of collagen which is the main component of the extracellular matrix. Free L-carnitine, lipo-carnitine, and
nano-carnitine were found to be efficient on the levels of the different building blocks of collagen, and these
formulations forced an increase in the amino acid levels of proline, 4-hydroxy-L-proline, and glycine, respectively (p < 0.05).
Glucose levels were increased in cells stimulated with free L-carnitine and L-carnitine-loaded formulations as com-pared to the control group; the greatest effect was observed in the nano-carnitine (p < 0.05). Similarly, the level of maltose formed by the binding of glucose with a glycosidic bond was highest in the case of nano-carnitine. Nano-carnitine was found to be the most sufficient formulation when it comes to increasing citric acid (CA) cycle intermediates (aside α-ketoglutarate) (p < 0.05).
As in all metabolic pathways, in order to interpret lipid metabolism, it is necessary to examine the characteristics of the cell being studied. Effective pathways in lipid metabolism include biological membrane synthesis, cholesterol synthesis, and β-oxidation of fatty acids in CFs. Nano-carnitine, especially lipo-carnitine formulations, caused an increase in the level of unsaturated fatty acids (p < 0.05). On the contrary, free L-carnitine had no significant effect on
unsat-urated fatty acids (p > 0.05).
Lipo-carnitine not only increased the amount of unsatu-rated fatty acids but also decreased the amount of cholesterol. Squalene is formed by the combination of two 15-carbon farnesyl pyrophosphates formed as a result of condensation of isoprene units in the cholesterol synthesis step, and this product forms the basis of the carbon skeleton of 30-carbon cholesterol. An increase in both cholesterol and squalene
a
b
c
d
Fig. 5. Stability results in terms of a encapsulation efficiency %, b polydispersity index, c particle size (nm), and d zeta potential (± mV) for nano-carnitine and lipo-carnitine formulations
levels by nano-carnitine stimulation suggested that squalenes are directly related to cholesterol synthesis.
Pathway Analysis
The pathways associated with the metabolite sets show significant differences in terms of metabolome profiling, fold discovery rate (FDR), and impacts as depicted in Table V. Although the identified metabolites are related to many pathways, only the statistically significant (p < 0.05) pathways were evaluated.
α-Ketoglutarate, a CA cycle intermediate, also associates with glutathione, arginine, and proline metabolism. Another CA cycle intermediate called oxaloacetic acid plays an important role in aspartate asparagine metabolism. Given the information provided above, the instantaneous levels of the metabolites in metabolomic analysis as seen in TableIV
are crucial. For example, lipo-carnitine’s α-ketoglutarate level signified the over-synthesis of this compound in the previous step and may activate subsequent pathways associated with it. The significant increment in the instantaneous level of oxaloacetic acid in nano-carnitine showed that this metabolite also activated pathways to which it was bound (aspartate asparagine metabolisms).
The pathways interacting in CF lines were presented in the order of their effects and in direct proportion to the size of the marks as represented in Fig. 7. Glutathione metabo-lism, urea cycle, beta-oxidation of long-chain fatty acids,
methyl histidine metabolism, malate aspartate shuttle, and spermine and spermidine biosynthesis as well as other mechanisms seemed to be effective as observed from the graph. Urea was also formed from aspartate, glutamate, ornithine, and arginine compounds which were all found to be significantly effective pathways. The biosynthesis of sperm and spermidine was classified as a proliferation indication (58).
In this study, formulation, method optimization, analyt-ical quantification, and analytanalyt-ical method validation studies were carried out for theL-carnitine in thefirst stage. ForL -carnitine-loaded liposome formulations, particle size in-creased with increasing lipid concentration. ZP values of liposomes were not found to be high negative/positive values because the lipids were not anionic/cationic in character (52,59). Tween 80 formed a hydrogen bond with the hydrophilic parts of liposomes, increased the flexibility between the phospholipids, reduced surface tension, and consequently increased the encapsulation efficiency of lipo-carnitine (60). For the nanoparticle formulation, Pluronic F68 surfactant reduced the surface tension by adhering to the water–oil interface, thereby increasing the degree of binding ofL-carnitine to the polymer leading to higher encapsulation
(61,62). Particle size increased when PLGA polymer concen-tration was increased. The particle size distribution was observed to be monodisperse, and spherical structures were confirmed in the case of each formulation. Unlike the control groups, a sustained-release profile was observed in the case of
a
b
Fig. 6. The effects ofL-carnitine with different nanocarrier systems on the metabolomic profile of cardiac fibroblast cell lines. Control group,L-carnitine, nano-carnitine, and lipo-carnitine formulation’s a PLS-DA score graph of metabolite levels obtained from GC-MS analysis and b VIP data graph for 25 metabolites with the highest differentiating effect
nano-carnitine and lipo-carnitine formulations during the in vitro release studies. For liposomes, a burst release that was observed in the first stage depended on the rapid
penetration of the L-carnitine (adsorbed on the liposome
surface as well as located in the boundary phase,) in the dissolution medium. The controlled release observed was as a Table IV. Significantly Altered Metabolites Based onL-Carnitine Treatment
Metabolism Metabolism group name Metabolite name Control L-Carnitine L i p o -carnitine
N a n o -carnitine Amino acid
metabolism
Amino acids have apolar side chain Alanine − 0.583 ± 0.12 0.236 ± 0.27 1.321 ± 0.06 − 0.973 ± 0.32 Glycine − 0.805 ± 0.07 0.250 ± 0.31 − 0.513 ± 0.51 1.068 ± 0.40 Isoleucine − 0.640 ± 0.02 − 0.253 ± 0.31 0.173 ± 0.71 0.720 ± 0.53 Leucine − 0.683 ± 0.04 − 0.202 ± 0.33 0.165 ± 0.72 0.720 ± 0.49 Methionine − 1.033 ± 0.21 0.263 ± 0.43 1.142 ± 0.26 − 0.372 ± 0.24 Phenylalanine − 0.546 ± 0.04 0.045 ± 0.26 − 0.494 ± 0.60 0.995 ± 0.53 Proline − 0.736 ± 0.05 1.295 ± 0.28 − 0.980 ± 0.03 0.421 ± 0.14 Tryptophan − 1.002 ± 0.14 0.552 ± 0.41 0.378 ± 0.71 0.072 ± 0.19 Valine − 1.152 ± 0.14 − 0.017 ± 0.43 0.855 ± 0.49 0.313 ± 0.26 Amino acids have polar side chain Cysteine − 0.942 ± 0.10 0.140 ± 0.83 0.229 ± 0.24 0.573 ± 0.18 Serine − 0.383 ± 0.06 − 0.329 ± 0.31 − 0.065 ± 0.78 0.777 ± 0.48 Threonine − 1.237 ± 0.18 0.166 ± 0.48 0.640 ± 0.46 0.431 ± 0.15 Tyrosine − 0.594 ± 0.10 0.078 ± 0.31 − 0.385 ± 0.67 0.900 ± 0.48 Amino acids with charged side chains Aspartic acid − 0.870 ± 0.04 0.534 ± 0.27 − 0.013 ± 0.70 0.349 ± 0.52 Glutamic acid − 0.293 ± 0.09 0.924 ± 0.17 0.461 ± 0.17 − 1.091 ± 0.61 Histidine − 1.252 ± 0.18 0.864 ± 0.32 0.115 ± 0.47 0.273 ± 0.25 Lysine − 0.604 ± 0.04 0.080 ± 0.29 − 0.444 ± 0.67 0.969 ± 0.43 Other compounds 2-Hydroxybutyrate − 0.966 ± 0.15 0.761 ± 0.28 0.911 ± 0.15 − 0.706 ± 0.39
3-Indoleacetic acid − 0.769 ± 0.12 1.394 ± 0.25 − 0.813 ± 0.15 0.188 ± 0.21 3-Phenyllactic acid − 0.714 ± 0.02 0.983 ± 0.16 − 1.142 ± 0.02 0.873 ± 0.12 2-Ketocaproic acid − 0.208 ± 0.02 0.955 ± 0.15 − 1.450 ± 0.05 0.703 ± 0.11 4-Hydroxy-L-proline − 1.230 ± 0.14 0.657 ± 0.32 0.858 ± 0.29 − 0.284 ± 0.31 Carbohydrate metabolism Monosaccharides Glucose − 0.567 ± 0.10 − 0.318 ± 0.53 0.089 ± 0.60 0.796 ± 0.47 Galactose 0.087 ± 0.08 0.510 ± 0.57 0.410 ± 0.62 − 1.008 ± 0.12 Disaccharides Maltose − 0.590 ± 0.12 − 0.291 ± 0.55 0.038 ± 0.59 0.844 ± 0.43 Lactose 0.172 ± 0.02 0.076 ± 0.33 0.739 ± 0.76 − 0.987 ± 0.12 Fermentation Lactic acid − 0.595 ± 0.23 0.601 ± 0.23 − 0.807 ± 0.32 0.800 ± 0.59 CA cycle Citric acid − 0.528 ± 0.10 0.308 ± 0.40 − 0.574 ± 0.61 0.794 ± 0.48 Aconitic acid − 1.144 ± 0.18 0.343 ± 0.48 0.242 ± 0.48 0.559 ± 0.37 α-Ketoglutarate − 0.347 ± 0.06 0.911 ± 0.23 − 1.321 ± 0.20 0.758 ± 0.19 Succinic acid − 1.205 ± 0.14 − 0.082 ± 0.33 0.866 ± 0.45 0.421 ± 0.31 Fumaric acid − 1.035 ± 0.14 0.109 ± 0.36 0.111 ± 0.54 0.815 ± 0.44 Malic acid − 0.974 ± 0.12 0.277 ± 0.43 0.068 ± 0.64 0.630 ± 0.38 Oxaloacetic acid − 0.541 ± 0.00 − 0.538 ± 0.00 − 0.547 ± 0.02 1.626 ± 0.22 Fatty acid metabolism
Saturated fatty acids Lauric acid 12:0 0.128 ± 0.13 − 0.887 ± 0.38 − 0.301 ± 0.24 1.059 ± 0.58 Palmitic acid 16:0 − 0.729 ± 0.11 − 0.717 ± 0.19 0.860 ± 0.27 0.587 ± 0.63 Stearic acid 18:0 − 0.496 ± 0.06 − 0.300 ± 0.18 0.089 ± 0.41 0.708 ± 0.86 Unsaturated fatty acids Oleic acid 18:1Δ9 − 0.629 ± 0.02 − 0.680 ± 0.01 1.634 ± 0.07 − 0.324 ± 0.08
Linoleic acid 18:2Δ9,12 − 0.626 ± 0.04 − 0.596 ± 0.04 1.649 ± 0.04 − 0.426 ± 0.04 Other compounds Cholesterol 0.001 ± 0.13 0.509 ± 0.13 − 1.418 ± 0.22 0.908 ± 0.33
Squalene − 0.219 ± 0.07 − 0.751 ± 0.06 − 0.131 ± 0.15 1.101 ± 0.76 Mean ± SE; normalized peak areas
Table V. Altered Pathways Based onL-Carnitine Treatment
Pathway name Match status p FDR Impact
Alanine, aspartate, and glutamate metabolism 6/24 9.49 × 10⁻⁶ 7.59 × 10⁻⁶ 0.533
Aminoacyl-tRNA biosynthesis 8/75 1.99 × 10⁻⁶ 0.008 0.113
Glutathione metabolism 5/38 0.001 0.028 0.049
Arginine and proline metabolism 7/77 0.001 0.028 0.329
result of the diffusion of L-carnitine (located in the core) through the lipid layers (63,64).
Tween 80 facilitated the relaxation of the lipid layers, resulting in diffusion of the active substance; meanwhile, the sustained-release profile was achieved when lipid vesicles started to erode (65). For PLGA nanoparticles, receptor phase penetration into the nanoparticle surface caused burst release ofL-carnitine adsorbed on the surface. A sustained-release profile was observed after the penetration of the release medium into the nanoparticular structure. Following this, pores were formed on the matrix, allowing the polymer to degrade/erode, thereby allowingL-carnitine to diffuse from
the polymer matrix (66–68).
In order to evaluate the effects of the formulations at the cellular level, instantaneous metabolome levels were deter-mined using CF lines. Therefore, a wider spectrum of metabolites at the cellular level was investigated with and without formulations. Based on the results, we concluded that the efficacy of nano-formulation systems (after classifying the metabolites) depends on the metabolisms.
In amino acid metabolism, the lipo-carnitine and nano-carnitine were more effective on the level of amino acids that carry apolar side chains as compared to the solution form. Regarding the level of polar side chain carrying amino acids, increments were observed in the case of nano-carnitine formulation. In carbohydrate metabolism, both formulations were influential on monosaccharides/disaccharides. Nano-carnitine formulation was found to be the most effective
formulation based on the metabolic profiles obtained for the CA cycle (except for α-ketoglutarate). Lipo-carnitine formulation caused a significant decrease in α-ketoglutarate levels compared to the other formulations. α-Ketoglutarate causes glutamate formation (from the CA cycle to glutamate pathway), and the formed glutamate is used for the synthesis of glutamine, proline, and arginine. An increase in the level of glutamate was detected when lipo-carnitine formulation is used, and the decrease observed in ketoglutarate was due to the use of some amount of α-ketoglutarate for glutamate production.
Lipo-carnitine caused an increase especially in the level of unsaturated fatty acids. Liposomal structures are similar to cellular membranes, and it is suspected that the cell mem-brane becomes enlarged and disrupted when lipo-carnitine is being taken into the cell. Therefore, the activation of the synthesis of unsaturated fatty acids in the use of lipo-carnitine formulation indicated that these compounds were synthesized to be used in rearranging the membrane structure. It was found that lipo-carnitine was highly effective on the synthesis of unsaturated fatty acids, while nano-carnitine formulation was highly effective on amino acid metabolism as well as on the increment of the levels of CA cycle intermediates except α-ketoglutarate.
CONCLUSION
In conclusion, although there are several studies avail-able on the effects of L-carnitine on fatty acid oxidation Fig. 7. Interacting pathways in CF lines based onL-carnitine treatment
metabolism and physical performance, we have presented information on the metabolic level (activities) ofL-carnitine
by developing formulations. Liposomal formulations of L -carnitine were found very effective in the synthesis of unsaturated fatty acids, while PLGA formulations exhibited effectivity in amino acid metabolism. Formulations were characterized and utilized for controlled-release kinetics, physicochemical analyses, and CF cell culture studies by evaluating the metabolomic studies. Outcomes may have a potential for a predictable drug delivery system. Further investigations including in vivo studies may pave the way to demonstrate the efficacy of these liposomal and nanoparticular drug delivery systems for varied applications. ACKNOWLEDGMENTS
The authors would like to thank HUNIKAL – HUNITEK Central Laboratories for their valuable support in the experimental part.
COMPLIANCE WITH ETHICAL STANDARDS
Conflict of Interest The authors declare that they have no conflicts of interest.
REFERENCES
1. Bremer J. Carnitine-metabolism and functions. Physiol Rev. 1 9 8 3 ; 6 3 ( 4 ) : 1 4 2 0– 8 0 . h t t p s : / / d o i . o r g / 1 0 . 1 1 5 2 / physrev.1983.63.4.1420.
2. Rebouche CJ, Seim H. Carnitine metabolism and its regulation in microorganisms and mammals. Annu Rev Nutr. 1998;18:39– 61.https://doi.org/10.1146/annurev.nutr.18.1.39.
3. Pooyandjoo M, Nouhi M, Shab-Bidar S, Djafarian K, Olyaeemanesh A. The effect of (L-) carnitine on weight loss in adults: a systematic review and meta-analysis of randomized controlled trials. Obes Rev. 2016;17(10):970–6. https://doi.org/ 10.1111/obr.12436.
4. Brass EP. Supplemental carnitine and exercise. Am J Clin Nutr. 2000;72(2):618S–23S.https://doi.org/10.1093/ajcn/72.2.618S. 5. Brass EP, Hiatt WR. The role of carnitine and carnitine
supplementation during exercise in man and in individuals with special needs. J Am Coll Nutr. 1998;17(3):207–15. https:// doi.org/10.1080/07315724.1998.10718750.
6. Ames BN, Liu J. Delaying the mitochondrial decay of aging with acetylcarnitine. Ann N Y Acad Sci. 2004;1033:108–16. https://doi.org/10.1196/annals.1297.073.
7. Montgomery SA, Thal LJ, Amrein R. Meta-analysis of double blind randomized controlled clinical trials of acetyl-L-carnitine versus placebo in the treatment of mild cognitive impairment and mild Alzheimer’s disease. Int Clin Psychopharmacol. 2003;18(2):61–71. https://doi.org/10.1097/00004850-200303000-00001.
8. Brevetti G, Diehm C, Lambert D. European multicenter study on propionyl-L-carnitine in intermittent claudication. J Am Coll Cardiol. 1999;34(5):1618–24. https://doi.org/10.1016/S0735-1097(99)00373-3.
9. Cruciani RA, Dvorkin E, Homel P, Culliney B, Malamud S, Shaiova L, et al. L-Carnitine supplementation for the treatment of fatigue and depressed mood in cancer patients with carnitine deficiency: a preliminary analysis. Ann N Y Acad Sci. 2004;1033:168–76.https://doi.org/10.1196/annals.1320.016. 10. Graziano F, Bisonni R, Catalano V, Silva R, Rovidati S,
Mencarini E, et al. Potential role of levocarnitine supplementa-tion for the treatment of chemotherapy-induced fatigue in
non-anaemic cancer patients. Br J Cancer. 2002;86(12):1854–7. https://doi.org/10.1038/sj.bjc.6600413.
11. Mingrone G, Greco AV, Capristo E, Benedetti G, Giancaterini A, De Gaetano A, et al. L-carnitine improves glucose disposal in type 2 diabetic patients. J Am Coll Nutr. 1999;18(1):77–82. https://doi.org/10.1080/07315724.1999.10718830.
12. Vidal-Casariego A, Burgos-Pelaez R, Martinez-Faedo C, Calvo-Gracia F, Valero-Zanuy MA, Luengo-Perez LM, et al. Meta-bolic effects of L-carnitine on type 2 diabetes mellitus: systematic review and meta-analysis. Exp Clin Endocrinol Diabetes. 2013;121(4):234–8. https://doi.org/10.1182/ blood.V91.10.3817.
13. Moretti S, Alesse E, Di Marzio L, Zazzeroni F, Ruggeri B, Marcellini S, et al. Effect of L-carnitine on human immunode-ficiency virus-1 infection-associated apoptosis: a pilot study. Blood. 1998;91(10):3817–24.
14. Scarpini E, Sacilotto G, Baron P, Cusini M, Scarlato G. Effect of acetyl-L-carnitine in the treatment of painful peripheral neu-ropathies in HIV+ patients. J Peripher Nerv Syst. 1997;2(3):250– 2.
15. Matalliotakis I, Koumantaki Y, Evageliou A, Matalliotakis G, Goumenou A, Koumantakis E. L-carnitine levels in the seminal plasma of fertile and infertile men: correlation with sperm quality. Int J Fertil Womens Med. 2000;45(3):236–40.
16. Costa M, Canale D, Filicori M, D’Lddio S, Lenzi A. L-carnitine in idiopathic asthenozoospermia: a multicenter study. Italian Study Group on Carnitine and Male Infertility. Andrologia. 1 9 9 4 ; 2 6 ( 3 ) : 1 5 5– 9 . h t t p s : / / d o i . o r g / 1 0 . 1 1 1 1 / j . 1 4 3 9 -0272.1994.tb00780.x.
17. Harper P, Elwin CE, Cederblad G. Pharmacokinetics of bolus intravenous and oral doses of L-carnitine in healthy subjects. Eur J Clin Pharmacol. 1988;35(5):555–62. https://doi.org/ 10.1007/BF00558253.
18. Evans AM, Fornasini G. Pharmacokinetics of L-carnitine. Clin Pharmacokinet. 2003;42(11):941–67. https://doi.org/10.2165/ 00003088-200342110-00002.
19. Koeth RA, Wang Z, Levison BS, Buffa JA, Org E, Sheehy BT, et al. Intestinal microbiota metabolism of L-carnitine, a nutrient in red meat, promotes atherosclerosis. Nat Med. 2013;19(5):576– 85.https://doi.org/10.1038/nm.3145.
20. Cao Y, Qu HJ, Li P, Wang CB, Wang LX, Han ZW. Single dose administration of L-carnitine improves antioxidant activities in healthy subjects. Tohoku J Exp Med. 2011;224(3):209–13. https://doi.org/10.1620/tjem.224.209.
21. Eroglu I, Ibrahim M. Liposome-ligand conjugates: a review on the current state of art. J Drug Target. 2020;28(3):225–44. https://doi.org/10.1080/1061186X.2019.1648479.
22. He H, Lu Y, Qi J, Zhu Q, Chen Z, Wu W. Adapting liposomes for oral drug delivery. Acta Pharm Sin B. 2019;9(1):36–48. https://doi.org/10.1016/j.apsb.2018.06.005.
23. Ling SSN, Yuen KH, Magosso E, Barker SA. Oral bioavailabil-ity enhancement of a hydrophilic drug delivered via folic acid-coupled liposomes in rats. J Pharm Pharmacol. 2009;61(4):445– 9.https://doi.org/10.1211/jpp.61.04.0005.
24. Pantze SF, Parmentier J, Hofhaus G, Fricker G. Matrix liposomes: a solid liposomal formulation for oral administration. Eur J Lipid Sci Technol. 2014;116(9):1145–54. https://doi.org/ 10.1002/ejlt.201300409.
25. Bardania H, Shojaosadati SA, Kobarfard F, Dorkoosh F, Zadeh ME, Naraki M, et al. Encapsulation of eptifibatide in RGD-modified nanoliposomes improves platelet aggregation inhibi-tory activity. J Thromb Thrombolysis. 2017;43(2):184–93.https:// doi.org/10.1007/s11239-016-1440-6.
26. Singh RP, Gangadharappa HV, Mruthunjaya K. Phospholipids: unique carriers for drug delivery systems. J Drug Deliv Sci Te c h n o l . 2 0 1 7 ; 3 9 : 1 6 6–79 . h t t p s : / / d o i . o r g / 1 0 . 1 0 1 6 / j.jddst.2017.03.027.
27. Frezard F. Liposomes: from biophysics to the design of peptide vaccines. Braz J Med Biol Res. 1999;32(2):181–9.https://doi.org/ 10.1590/S0100-879X1999000200006.
28. Li J, Wang XL, Zhang T, Wang CL, Huang ZJ, Luo X, et al. A review on phospholipids and their main applications in drug delivery systems. Asian J Pharm Sci. 2015;10(2):81–98.https:// doi.org/10.1016/j.ajps.2014.09.004.
29. Eroglu I, Aslan M, Yaman U, Gultekinoglu M, Calamak S, Kart D, et al. Liposome-based combination therapy for acne treatment. J Liposome Res. 2019;30:1–11. https://doi.org/ 10.1080/08982104.2019.1630646.
30. Sheikhsaran F, Sadeghpour H, Khalvati B, Entezar-Almahdi E, Dehshahri A. Tetraiodo thyroacetic acid-c onjugated polyethylenimine for integrin receptor mediated delivery of the plasmid encoding IL-12 gene. Colloids Surf B: Biointerfaces. 2017;150:426–36.https://doi.org/10.1016/j.colsurfb.2016.11.008. 31. Khalid M, El-Sawy HS. Polymeric nanoparticles: promising
platform for drug delivery. Int J Pharm. 2017;528(1–2):675–91. https://doi.org/10.1016/j.ijpharm.2017.06.052.
32. Masood F. Polymeric nanoparticles for targeted drug delivery system for cancer therapy. Mater Sci Eng C. 2016;60:569–78. https://doi.org/10.1016/j.msec.2015.11.067.
33. Sadeghpour H, Khalvati B, Entezar-Almahdi E, Savadi N, A l h a s h e m i S H , R a o ufi M, et al. Double domain polyethylenimine-based nanoparticles for integrin receptor mediated delivery of plasmid DNA. Sci Rep. 2018;8(1):1–12. https://doi.org/10.1038/s41598-018-25277-z.
34. Bolhassani A, Javanzad S, Saleh T, Hashemi M, Aghasadeghi MR, Sadat SM. Polymeric nanoparticles potent vectors for vaccine delivery targeting cancer and infectious diseases. Hum Vacc Immunother. 2014;10(2):321–32. https://doi.org/10.4161/ hv.26796.
35. Ozcan I, Bouchemal K, Segura-Sanchez F, Ozer O, Guneri T, Ponchel G. Synthesis and characterization of surface-modified PBLG nanoparticles for bone targeting: in vitro and in vivo evaluations. J Pharm Sci. 2011;100(11):4877–87.https://doi.org/ 10.1002/jps.22678.
36. Toya Y, Shimizu H. Flux analysis and metabolomics for systematic metabolic engineering of microorganisms. Biotechnol Adv. 2013;31(6):818–26. https://doi.org/10.1016/ j.biotechadv.2013.05.002.
37. Keibler MA, Fendt SM, Stephanopoulos G. Expanding the concepts and tools of metabolic engineering to elucidate cancer metabolism. Biotechnol Prog. 2012;28(6):1409–18. https:// doi.org/10.1002/btpr.1629.
38. Buescher JM, Antoniewicz MR, Boros LG, Burgess SC, Brunengraber H, Clish CB, et al. A roadmap for interpreting (13) C metabolite labeling patterns from cells. Curr Opin Biotechnol. 2015;34:189–201. https://doi.org/10.1016/ j.copbio.2015.02.003.
39. Patti GJ, Yanes O, Siuzdak G. Metabolomics: the apogee of the omics trilogy. Nat Rev Mol Cell Biol. 2012;13(4):263–9.https:// doi.org/10.1038/nrm3314.
40. Moyon T, Le Marecel F, Qannari M, Vigneau E, Le Plain A, Courant F, et al. Statistical strategies for relating metabolomics and proteomics data: a real case study in nutrition research area. Metabolomics. 2012;8(6):1090–101. https://doi.org/10.1007/ s11306-012-0415-7.
41. Jansen JJ, Szymanska E, Hoefsloot HC, Smilde AK. Individual differences in metabolomics: individualised responses and between-metabolite relationships. Metabolomics. 2012;8(Suppl 1):94–104.https://doi.org/10.1007/s11306-012-0414-8.
42. European Medicines Agency. ICH topic Q2 (R1), validation of analytical procedures: text and methodology. 1995. https:// www.ich.org/page/quality-guidelines. Accessed 1 June 1995. 43. Desai KGH, Park HJ. Recent developments in
microencapsu-lation of food ingredients. Dry Technol. 2005;23(7):1361–94. https://doi.org/10.1081/DRT-200063478.
44. Tanrıverdi ST, Özer Ö. Novel topical formulations of terbinafine-HCl for treatment of onychomycosis. Eur J Pharm S c i . 2 0 1 3 ; 4 8 ( 4–5):628–36. h t t p s : / / d o i . o r g / 1 0 . 1 0 1 6 / j.ejps.2012.12.014.
45. Kumar GP, Rajeshwarrao P. Nonionic surfactant vesicular systems for effective drug delivery-an overview. Acta Pharm S i n B . 2 0 1 1 ; 1 ( 4 ) : 2 0 8–19 . h t t p s : / / d o i . o r g / 1 0 . 1 0 1 6 / j.apsb.2011.09.002.
46. Choi M, Maibach H. Liposomes and niosomes as topical drug delivery systems. Skin Pharmacol Physiol. 2005;18(5):209–19. https://doi.org/10.1159/000086666.
47. 5th European Pharmacopoeia. European Directorate for the Quality of Medicines. Strasbourg2007.
48. International Conference on Harmonization (ICH) of Technical Requirements for the Registration of Pharmaceuticals for Human Use. Validation of analytical procedures: text and methodology ICH-Q2B. Geneva1996. https://www.fda.gov/me-dia/71725/download. Accessed Nov 1996.
49. Mura S, Hillaireau H, Nicolas J, Le Droumaguet B, Gueutin C, Zanna S, et al. Influence of surface charge on the potential toxicity of PLGA nanoparticles towards Calu-3 cells. Int J Nanomedicine. 2011;6:2591–605. https://doi.org/10.2147/ IJN.S24552.
50. Sengel Turk CT, Bayindir ZS, Badilli U. Preparation of polymeric nanoparticles using different stabilizing agents. J Fac Pharm Ankara. 2009;38(4):257–68.
51. Grit M, Crommelin DJ. Chemical stability of liposomes: implications for their physical stability. Chem Phys Lipids. 1993;64(1–3):3–18. https://doi.org/10.1016/0009-3084(93)90053-6.
52. Yael E. Formulation and biopharmaceutical evaluation of lipid nanocarriers with incorporated lidocaine hydrochloride: Lithu-anian University of Health Sciences; 2017.
53. Song CK, Balakrishnan P, Shim CK, Chung SJ, Chong S, Kim DD. A novel vesicular carrier, transethosome, for enhanced skin delivery of voriconazole: characterization and in vitro/in vivo evaluation. Colloids Surf B: Biointerfaces. 2012;92:299–304. https://doi.org/10.1016/j.colsurfb.2011.12.004.
54. Refai H, Hassan D, Abdelmonem R. Development and characterization of polymer-coated liposomes for vaginal deliv-ery of sildenafil citrate. Drug Deliv. 2017;24(1):278–88.https:// doi.org/10.1080/10717544.2016.1247925.
55. Wieber A, Selzer T, Kreuter J. Characterisation and stability studies of a hydrophilic decapeptide in different adjuvant drug delivery systems: a comparative study of PLGA nanoparticles versus chitosan-dextran sulphate microparticles versus DOTAP-liposomes. Int J Pharm. 2011;421(1):151–9. https://doi.org/ 10.1016/j.ijpharm.2011.09.011.
56. Darvishi B, Manoochehri S, Kamalinia G, Samadi N, Amini M, Mostafavi SH, et al. Preparation and antibacterial activity evaluation of 18-beta-glycyrrhetinic acid loaded PLGA nano-particles. Iran J Pharm Res. 2015;14(2):373–83.
57. Dias DJS, Joanitti GA, Azevedo RB, Silva LP, Lunardi CN, Gomes AJ. Chlorambucil encapsulation into PLGA nanoparti-cles and cytotoxic effects in breast cancer cell. J Biophys Chem. 2015;6(1):1–13.https://doi.org/10.4236/jbpc.2015.61001. 58. Lamster IB, Mandella RD, Zove SM, Harper DS. The
polyamines putrescine, spermidine and spermine in human gingival crevicular fluid. Arch Oral Biol. 1987;32(5):329–33. https://doi.org/10.1016/0003-9969(87)90087-2.
59. Duangjit S, Pamornpathomkul B, Opanasopit P, Rojanarata T, Obata Y, Takayama K, et al. Role of the charge, carbon chain length, and content of surfactant on the skin penetration of meloxicam-loaded liposomes. Int J Nanomedicine. 2014;9:2005– 17.https://doi.org/10.2147/IJN.S60674.
60. Chu BS, Ichikawa S, Kanafusa S, Nakajima M. Preparation and characterization of beta-carotene nanodispersions prepared by solvent displacement technique. J Agric Food Chem. 2007;55(16):6754–60.https://doi.org/10.1021/jf063609d.
61. Baysal I, Ucar G, Gultekinoglu M, Ulubayram K, Yabanoglu-Ciftci S. Donepezil loaded PLGA-b-PEG nanoparticles: their ability to induce destabilization of amyloidfibrils and to cross blood brain barrier in vitro. J Neural Transm (Vienna). 2017;124(1):33–45.https://doi.org/10.1007/s00702-016-1527-4. 62. Tuncay M, Calis S, Kas HS, Ercan MT, Peksoy I, Hincal AA.
Diclofenac sodium incorporated PLGA (50:50) microspheres: formulation considerations and in vitro/in vivo evaluation. Int J Pharm. 2000;195(1–2):179–88. https://doi.org/10.1016/S0378-5173(99)00394-4.
63. Nounou MM, El-Khordagui LK, Khalafallah NA, Khalil SA. In vitro release of hydrophilic and hydrophobic drugs from liposomal dispersions and gels. Acta Pharma. 2006;56(3):311–24. 64. Miao ZL, Deng YJ, Du HY, Suo XB, Wang XY, Wang X, et al. Preparation of a liposomal delivery system and its in vitro release of rapamycin. Exp Ther Med. 2015;9(3):941–6. 65. Joseph J, Vedha BNV, Ramya DD. Experimental optimization
P h a r m S c i . 2 0 1 8 ; 11 2 : 3 8–51. h t t p s : / / d o i . o rg / 1 0 . 1 0 1 6 / j.ejps.2017.10.032.
66. Chibas LC, Cintra PP, Moreira MR, Goulart MO, Ambrosio SR, Veneziani RCS, et al. Polyalthic acid in polymeric nanopar-ticles causes selective growth inhibition and genotoxicity in MCF-7 cells. Nat Prod Commun. 2019;14(4). https://doi.org/ 10.1177/1934578X19842702.
67. Hines DJ, Kaplan DL. Poly (lactic-co-glycolic) acid-controlled-release systems: experimental and modeling insights. Crit Rev Ther Drug. 2013;30(3):257–76.
68. Eroğlu H, Haidar MK, Nemutlu E, Öztürk Ş, Bayram C, Ulubayram K, et al. Dual release behavior of atorvastatin and alpha-lipoic acid from PLGA microspheres for the combination therapy in peripheral nerve injury. J Drug Deliv Sci Technol. 2017;39:455–66.https://doi.org/10.1016/j.jddst.2017.04.028. Publisher’s Note Springer Nature remains neutral with regard to jurisdictional claims in published maps and institutional affiliations.