Araştırma Makalesi
By Investing Renewable Energy Technologies, How Spain Could Meet Its Energy Needs In 2030 And Reduce Its Domestic Greenhouse Gas Emission
Mazlum Cengiz1*
1Sirnak University, Sirnak, Turkey, [email protected] *Corresponding author; [email protected]; Tel. +90 544 234 5195
Gönderme tarihi: 14/10/2019 Kabul tarihi: 30/12/2019 Abstract
In this study, energy supplies of Spain, solar and geothermal energy resource potential of Spain, energy needs of Spain in 2030, 110Mtoe, based on population change, and how this energy demand can be supplied by renewable energy sources in order to achieve its target of reducing domestic greenhouse gas emissions at least 40% by 2030 were examined. Building a photovoltaic power plant that has a capacity of 2000 MW per year and a flash geothermal plant which is suitable for low temperature developments has a capacity of 683 MW per year were proposed to meet energy need of the country in 2030. The estimated cost of the photovoltaic solar power plant, and the flash geothermal plant were calculated. Furthermore, the greenhouse emission from the photovoltaic solar plant and the geothermal plant was presented and the results are compared with the greenhouse emissions from a natural gas plant. The required land area for these two renewable energy plants are evaluated, as well. Moreover, the obstacles, which are water footprint of the solar photovoltaic power plant and flash geothermal plant, monitoring and track these new technologies, and required land area for these energy plants, of developing these new technologies are discussed and suggestions that could assist with overcome these obstacles are given.
Keywords: Renewable Energy; Spain; Greenhouse Gas Emission; Solar Energy; Geothermal Energy
Yenilenebilir Enerji Teknolojilerine Yatırım Yaparak, İspanya 2030 Yılındaki Enerji İhtiyacını Nasıl Karşılayabilir Ve Sera Gazı Emilsiyonunu Nasıl Azaltır.
Özet
Bu çalışmada, İspanya'nın enerji kaynakları, İspanya'nın güneş enerjisi ve jeotermal enerjisi potansiyeli, nüfus değişimine bağlı olarak, İspanya'nın 2030 daki enerji ihtiyaçı (11030 toe), İspanya’nın sera gas emiyonunu 2030 yılına kadar en az %40 azaltmak için hangi yenilenebilir enerji kaynaklarından yararlanarak bu enerji ihtiyacını karşılayabileceği incelenmiştir. Yılda 2000 MW enerji üretme kapasiteye sahip bir fotovoltaik santral ve düşük sıcaklıklara uygun olan ve yılda 683 MW enerji üretme kapasiteye sahip flaş jeotermal santralinin inşa edilmesinin 2030 yılında ülkenin enerji ihtiyacını karşılayabileceği öne sürüldü. Çalışmada, fotovoltaik güneş enerjisi santrali ve flaş jeotermal santralinin tahmin edilen kurulum maliyeti hesaplandı. Ayrıca, fotovoltaik güneş enerjisi ve jeotermal santrallerinin kurulumundan dolayı tahmini sera gas salınımı sonuçları hesaplandı ve bu sonuşlar benzer kapasiteye sahip doğal gaz santralinden salınan sera gazı emisyonlarıyla karşılaştırıldı. Bu iki
yenilenebilir enerji santralinin kaplayacağı arazi alanı da hesaplandı. Daha da önemlisi, güneş fotovoltaik santral ve flaş jeotermal santralinin su ihtiyacının karşılanması, bu yeni teknolojilerinin izlenmesi ve takibi ve bu enerji santralleri için gerekli arazi konularında yaşanabilecek sorunlar tartışıldı. Bu sorunların çözümüne yardımcı olabilecek öneriler verildi.
Anahtar kelimeler: Yenilenebilir Enerji; İspanya; Sera Gazı Emisyonu; Güneş Enerjisi; Jeotermal Enerji 1. INTRODUCTION
The total primary energy supply (TPES) of Spain was 114 Mteo (million tonnes of oil
equivalent) in 2014, yielding a -2 percent annual energy growth since 2004 (International
Energy Agency, Spain Overview, 2015). Spain supplies its energy needs from oil, natural gas, nuclear, wind, solar, geothermal, biofuel, waste, and hydro energy (International Energy Agency, Spain Overview, 2015). In 2014, Spain generated 41% of its total energy needs from oil; 21% from natural gas; 13% from nuclear energy; 10% from coal; 6% from renewable sources such as wind, solar, and geothermal; 5% from biofuels and other waste; and 4% from
hydro sources (International Energy Agency, Spain Overview, 2015). Spain decreased its
energy production from fossil fuels and increased its energy generation from renewable energy sources, waste, and nuclear energy from 2004 to 2009, and from 2009 to 2014,
demonstrated in Figure 1 (International Energy Agency, Spain Overview, 2015).
According to the Latvian Presidency of the Council of the European Union, all European Union (EU) Member States have agreed to reduce domestic greenhouse gas emissions (GHG) at least 40% by 2030 as outlined by the United National Framework
Convention on Climate Change (UNFCCC) (Climate Action; Committee on Climate Change).
As a member of the EU, Spain is fully dedicated to meeting this GHG target set by UNFCCC. The Latvian Presidency of the Council of the European Union asserts that the target of domestic decrease of GHG will be beyond 20%, which is further than their obligation
compared to 1990 (Climate Action; Committee on Climate Change). Therefore, in order to
reduce their greenhouse emissions, Spain has been improving energy generation from
Figure 1- The percentage of energy sources Spain used to generate its energy needs (International Energy Agency, Spain Overview, 2015).
Spain mainly utilizes the energy produced for transport, industry, residential, and commercial sectors. In 2013, 35% of the energy generated was consumed by the transport sector; 31% was consumed in industry; 18% was consumed by the residential sector; and the
remaining 16% was consumed by the commercial sector (International Energy Agency, Spain
Overview, 2015). Spain’s electricity production was 274 terawatt hours in 2014. Out of the 274 terawatt hours of electricity generated in 2014, 38.4 % was generated from renewable sources: 19.1% was generated from wind energy; 14.3% was generated from hydro sources;
and 5% was generated from solar sources (International Energy Agency, Spain Overview,
2015). The remaining 61.6% of the electricity was generated by other means: 20.9% was
generated by nuclear sources; 17.2% was generated by natural gas; 16.3% was generated by coal; 5.2% was generated by oil; and 2% was generated by biofuels and organic waste (International Energy Agency, Spain Overview, 2015). According to the Central Intelligence Agency (CIA), Spain imported 10.2 billion kilowatt hour (kWh) electricity and exported 16.94 billion kWh in 2013. CIA indicates that Spain has very low domestic oil and gas production so the country heavily depends on imports. The country’s current energy system is increasing the export of oil and natural gas in order to decrease the domestic demand. The
export of oil increased by 143% from 2004 to 2014 (International Energy Agency, Spain
Overview, 2015).
2. RESOURCE POTENTIAL OF SPAIN 2.1. Solar Energy Potential
As stated previously, 38.4 % of Spain’s 274 terawatt hour electricity production was provided from renewable sources in 2014, only 5% of which comes from solar sources (International Energy Agency, Spain Overview, 2015). Even though Spain has not produced large amount of electricity from solar power, it is considered one of the most attractive countries in Europe for investment in photovoltaics (PV) because of its high solar irradiation potential. Spain’s installed capacity of solar power is 4.33 gigawatt (GW) (World Energy Council, 2013). When regarding fixed solar systems, the average radiation of solar power in
Spain is 1,500 ± 300 kilowatt hour per meter square (kWh/m2) with an average energy
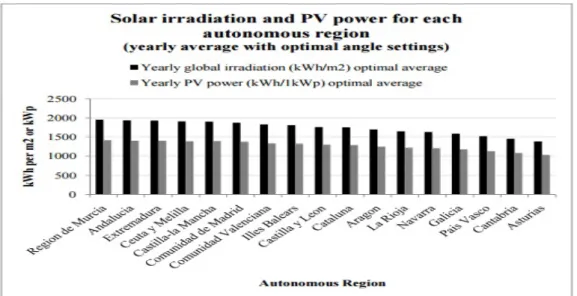
yield of between 1000 kilowatt hour per kilowatts peak (kWh/kWp) in the north and 1500 kWh/kWp in the south (Maaßen et al., 2011). According to World Energy Council (2013), some regions in Spain receive 2000 kWh of solar radiation per square meter annually. Southern regions of the country show the most promise for PV development (Maaßen et al., 2011). The southern areas of Murcia, Andalusia, Extremadura, Ceuta y Melilla, and Castilla
de la Mancha each boast a potential amount of energy of greater than 1,900 kWh/m2 and a
potential output of around 1,400 kWh/kWp (Maaßen et al., 2011). Solar irradiation and PV power for each autonomous region are shown in Figure 2. (Maaßen et al., 2011).
The areas of direct normal irradiation (DNI) in Spain is displayed in Map 1 (Maaßen et al., 2011). The DNI indicates the amount of solar radiation that is normal to a surface (Maaßen et al., 2011). Areas with a high DNI index can be considered ideal locations for solar
panels (Maaßen et al., 2011). Areas of high DNI include much of the southern part of Spain according to Map 1 (Maaßen et al., 2011).
The global horizontal irradiation (GHI) hotspots in Spain is shown in Map 2 (Solargis,
2016). GHI is the total amount of irradiation reaching a horizontal surface (Solargis, 2016).
Much like the DNI map, GHI tends to be the most prevalent in the southern part of the
country (Solargis, 2016). Southern areas such as Murcia, Andalusia, and Ceuta show great
potential for solar energy harvesting based on their DNI and GHI data (Solargis, 2016).
Figure 2: Solar irradiation and power for each autonomous region of Spain (Maaßen et al., 2011).
Map 1: The DNI map of Spain; the southern area around Murcia gives a high DNI value (Solargis, 2016).
Map 2: The GHI map of Spain; the southern area around Murcia is a prime location for solar energy harvesting (Solargis, 2016).
2.2. Geothermal Energy Potential
Spain has widely distributed low-enthalpy geothermal resources in the northern, southeast, northwest and the center of the country (World Energy Council, 2013). There is a high temperature resource on Tenerife, and Lanzarote and La Palma each have a high dynamic range resource (World Energy Council, 2013). 6 megawatts thermal (MWt) amount of capacity has been installed for individual space heating, greenhouse heating, bathing and swimming (World Energy Council, 2013). Limited rate of capacity is installed for direct purposes so geothermal power is not a major energy resource in Spain (World Energy Council, 2013). The areas having significant geothermal potential are located in the southeast (Granada, Almeria, and Murcia), northeast (Barcelona, Gerona, and Tarragona), northwest (Orense, Pontevedra, and Lugo) and center (Madrid) of the Iberian Peninsula. Additionally, Albacete, Lerida, Leon, Burgos and Mallorca all show lower geothermal potential: the
temperatures range from 50 to 90 ℃ and are therefore considered to be low temperature
geothermal resources (World Energy Council, 2013). The volcanic archipelago of the Canary Islands is the only area where high-enthalpy fluid may likely exist (World Energy Council, 2013).
Where low-temperature geothermal sources are located in Spain is shown in Map 3
(Arrizabalaga et al., 2015). While there are a sufficient number of geothermal regions throughout the country, the bulk of these low-temperature regions are concentrated in the
northern and eastern areas of Spain (Arrizabalaga et al., 2015).
Medium and high temperature geothermal resources found in Spain is demonstrated in Map 4. (Arrizabalaga et al., 2015). There are significantly fewer medium and high temperature geothermal resources compared to the low temperature geothermal resources, and
these areas tend to be primarily in the northern and center areas of the country (Arrizabalaga
Map 3: Low-temperature of geothermal resources, 30-100 degree Celsius(℃) , and zones with good potential for resource exploitation (Arrizabalaga et al., 2015).
Map 4: Medium and high temperature geothermal resources and possible enhanced geothermal systems (Arrizabalaga et al., 2015).
3. ENERGY NEEDS OF SPAIN IN 2030
Spain’s energy consumption decreased from 122 Mtoe in 2000 to 116 Mtoe in 2015 (Global Energy Statistical Yearbook, 2019). Although the energy consumption decreased, Spain’s population increased from 40,750,000 people in the year 2000 to 46,122,000 in the year 2015 (The United Nation, Population Division, 2019). Therefore, while Spain has a decreasing trend in energy consumption, the population of Spain has an increasing trend
throughout 15 years. However, according to Department of Economic and Social Affairs, Spain’s population is projected to drop to 45,920,000 in 2030 (The United Nation, Population Division, 2019). This is predicted to complement Spain’s goal of reducing its total energy needs in 2030 because population decrease will contribute to reduction of energy needs of Spain. Assuming exponential decrease in energy consumption, the annual decrease rate in energy consumption , i, is 0.34% which is calculated substituting 112 Mtoe and 116 Mtoe over a 15-year period into the equation below:
122=116∗(1−i)15 (0)
Therefore, Spain’s total energy need in 2030 can be predicted to be 110 Mtoe since there is 0.34 % decrease rate in energy consumption.
The calculation of Spain’s total energy need by 2030, N:
116=N∗(1−0.0034 )15; N=110 Mtoe (0)
Using the predicted total energy need, the predicted energy consumption per capita of Spain in 2030 can be calculated:
[
110∗103ktoe∗106kg oe ktoe
]
45,920∗103 =2395.5 kg oe(kilograms of oil equivalent)
(0)
Spain utilizes 38% of its annual production for transportation and the rest of it is for electricity (International Energy Agency, Spain Overview, 2015). Therefore, it can be predicted that Spain’s energy need for transportation and electricity could be 41.8 Mtoe and 68.2 Mtoe, respectively.
According to the prediction of U.S. Energy Information Administration (EIA) (2016), the world energy consumption will increase 48% percent between 2012 and 2040. Despite the EIA’s prediction, Spain seems to not follow this trend since Spain has improved the security of its energy supplies (The International Energy Agency, 2009). The International Energy Agency (IEA) (2009) recommends that Spain varies its energy resources, including increasing energy efficiency.
3.1. Target Fraction
In 2014, the total energy consumption of Spain was 113 Mtoe with electricity consumption making up 62% of the total energy consumption (Global Energy Statistical Yearbook, 2019). Of this electricity consumption, Spain produced 38% of its electricity from renewable energy sources (International Energy Agency, Spain Overview, 2015). With one tonne of oil being equivalent (toe) to 0.01163 gigawatt hours (GWh), the electricity production from renewable energy sources in 2014 was 70.60 Mtoe can be expressed as 309623.164 GWh.
The conversion of 113 Mtoe to GWh for electricity production from renewable energy sources is shown below:
113 Mtoe∗106 toe
Mtoe∗0.62∗0.38∗0.01163
GWh
toe =309623.164 GWh
(0) These values from 2014 can be used to predict the total energy generated in 2030. The targeted fraction of future energy demand that Spain hopes to provide from development of
solar and geothermal energy can be predicted as 42% of total energy need. This equates to 333129.75 GWh since the prediction of the total energy need in 2030 is 110 Mtoe:
110 Mtoe∗106 toe
Mtoe∗0.62∗0.42∗0.01163
GWh
toe =333129.72 GWh
(0) The difference between the energy generated in 2030 and the energy generated in 2014 shows how much energy generation will increase over the course of 16 years:
333129.72GWh−309623.164 GWh=23506.556 GWh (0)
Hence, 23506.556 GWh is predicted to be generated from investment of solar and geothermal energy.
3.1.1. Unit Cost Estimate and Comparison
In order to reach the objective of producing 42% electricity need from renewable sources, Spain would have to build a photovoltaic power plant that has a capacity of 2000 MW per year and a flash geothermal plant which is suitable for low temperature developments has a capacity of 683 MW per year.
3.1.2. The estimated cost of the PV solar power plant by the conversion calculation
2000 MW year∗8760 hour=17520000 MWh year=17520 GWh year= 1.752∗1010kWh year (0) The costs of producing solar energy is 4 cents per kWh ($0.04/kWh) (Energy Post, 2015). Therefore, 700.8 million US dollars would be invested for the PV solar power plant.
3.1.3. The estimated cost of the flash geothermal plant
By subtracting the total energy generated in 2030 by the energy generated by solar sources, the energy generated by geothermal power can be found:
23506.556−17520=5986.556 GWh/ year (0)
Therefore, 5986.556 GWh/ year (683 MW per year) electricity could be provided
from geothermal sources in southern part of Spain.
Recent electric generation cost for flash geothermal plant is $ 0.07/kWh (International Energy Agency Renewable Energy Essentials: Geothermal, 2010). The estimated cost is
5986.556
GWh∗106kW
GW ∗$ 0.07
kWh =$ 419.06 million
(0)
Thus, 419.06 million US dollars would be invested for a flash geothermal plant that have a capacity of 5986.556 GWh.
The total amount of investment for these new technologies would be
$(700.8+419.06)million=$ 1119.86million=$ 1.11986billion . (0)
Spain supplies its major electricity generation production from oil and natural gas (International Energy Agency, Spain Overview, 2015). The cost of natural gas per kWh is between 7 and 10 cents so the average cost of it is 8.5 cents per kWh (Feldman, 2009). If Spain produces its 23506.556 GWh/year electricity need from natural gas instead of the new
solar and geothermal technologies, this amount of electricity would cost 1998 million US dollars.
The calculation of electricity cost from natural gas: 23506.556
GWh∗106kW
GW ∗$ 0.085
Kwh =1.998 billionUS dollar
(0)
Additionally, the cost of petroleum per kWh is 21.56 cents (The Institute for Energy Research, 2012) so if Spain generates its 23506.556 GWh/year electricity from petroleum sources, this amount of electricity would cost:
23506.556
GWh∗106kW
GW ∗$ 0.2156
Kwh =$ 10.7 billionUS dollar
(0)
4. ESTIMATION OF GREENHOUSE EMISSIONS AND COMPARISON
Electricity production from solar energy technologies is defined as carbon-free because their operations do not emit greenhouse gases (Fthenakis and Kim, 2007). However, carbon dioxide and other gases are released throughout the extraction, processing, and disposal of associated materials related to solar energy harvesting (Fthenakis and Kim, 2007). Greenhouse gas emissions estimated to vary widely from 40 to 180 grams of carbon dioxide
equivalent per kilowatt-hour (gCO2-eq/kWh) for photovoltaics (Fthenakis and Kim, 2007).
According to European Commission, photovoltaic installations in Germany have emitted 180
gCO2-eq/kWh. Additionally, another research shows supporting evidence that greenhouse
gases from photovoltaic life cycle are 39-110 gCO2-eq/kWh (Fthenakis et al., 2008).
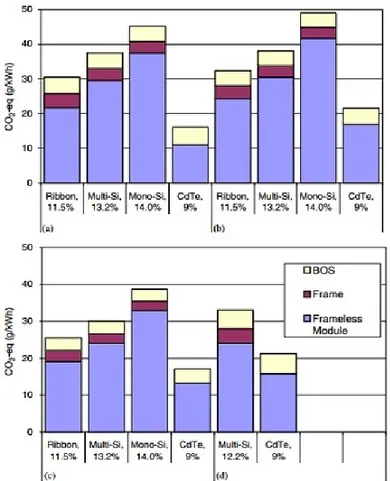
Therefore, the greenhouse gas emissions associated with solar energy and photovoltaic panels are estimated in terms of its life cycle, including material production (e.g. mining, smelting, refining, purification), solar cell and PV module production, balance of system (BOS) production (e.g. inverters, transformers, wiring, structural supports), system operation and maintenance, system decommissioning and disposal or recycling (Fthenakis and Kim, 2007).
CO2 emissions from the material production are assumed 15 gCO2-eq/kWh (Fthenakis and
Kim, 2007). The average radiation of solar power and resource potential in Spain is 1,500
± 300 kWh/m2/year. Silicon ribbons with 11.5% efficiency for converting photons to
electricity are assumed to be manufactured as a solar module. The manufacturing has around
31 gCO2-eq/kWh emissions based on BOS production since this value is suitable for average
solar radiation of 1700 kWh/m2/year, shown in Figure 3 (Fthenakis and Kim, 2007). The
system operations and maintenance are estimated to be 0 gCO2-eq/kWh.
Thus, the estimation of greenhouse emissions associated with photovoltaic power
plant having capacity of 2000 MW has 46 gCO2-eq/kWh.
The average greenhouse gas emissions from hydrothermal flash and dry steam plants
is 91 gCO2-eq/kWh. Methane (CH4) also contributes to greenhouse gas emissions and raises
the average emissions up to 127 gCO2-eq/kWh (106 g/kWh for CO2 only) (Sullivan and
Wang, 2013). Therefore, the estimation of the greenhouse gas emissions associated with new technology, a flash geothermal plant, having capacity of 5986.556 GWh (683 MW/year) is
127 gCO2-eq/kWh. Thus, the greenhouse gas emissions from these two new technologies are
Figure 3: GHG emissions of manufacturing frame and frameless solar modules for average solar radiation (1700 kWh/m2/year) (Fthenakis and Kim, 2007).
The estimated calculation of greenhouse gas emissions from the photovoltaic power plant:
(
2000 MW year∗10 3 kW MW∗8760 h∗(
46 g CO2− eq kWh)
)
=8.06∗10 11g CO 2/year (0)The estimated calculation of greenhouse gas emissions from the flash geothermal power plant:
(
863MWyear∗10 3 kW
MW∗8760 h∗
(
127 g CO2−kWheq)
)
=9.6∗1011g CO2/year (0)Thus, the estimated total greenhouse gas emissions are 17.66E+11 gCO2/year
(17.66E+8 kgCO2/year)
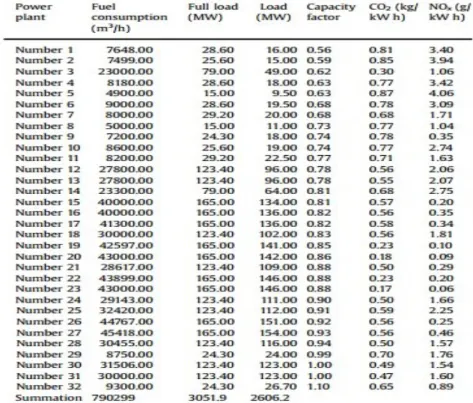
Greenhouse gas emissions of a natural gas power plant ranges from 170 gCO2/year
(0.17 kgCO2/year) to 870 gCO2/year (0.87 kgCO2/year) (Alavijeh et al., 2013) since natural
greenhouse gas emissions are estimated 520 gCO2/year based on Table 1 (Alavijeh et al.,
2013).
The estimated calculation of greenhouse gas emission form a natural gas plant:
(
2863 MW year∗10 3 kW MW∗8760 h∗(
520 gCO2− eq kWh)
)
=1.3∗10 13g CO 2/year (0) Table 1: Natural gas power plants characteristics and detail information for 32 different power plants(Alavijeh et al., 2013).
5. REQUIRED LAND AREA
A photovoltaic power plant having a capacity of 25 MW/year of 12% efficient PV modules requires a 1.3 MW PV installation on 2.7acres (Fthenakis and Kim, 2007). Therefore, it can be estimated that a photovoltaic power plant that has a capacity of 2000 MW/year requires 104 MW PV installation and 216 acres land area.
The estimated calculation of land required for the PV power plant:
[
2000 MWyear∗2.7 acres
]
1.3 MW =4154 acres
(0) The largest geothermal plant in the world, The Geysers, has a capacity of around 1517 MW and has an area of 13 acres (Union of Concerned Scientists, 2013). A flash geothermal plant having a capacity of 683 MW could approximately require 5.85 acres.
[
683 MW / year∗13 acres]
1517 MW / year =5.853 acres
Thus, the total area required for these two new technologies is 4159.83 acres. However, a thermal power plant that has a capacity of 5*660 MW requires 206.5 acres (Nath, 2007).
6. CONCLUSION AND DISCUSSION
With an energy production need predicted to be 110 Mtoe in 2030, Spain could theoretically reach the goal of 42% electricity production from renewable energy sources by 2030 if Spain invested in the PV solar and the flash geothermal plant having a capacity of 2000 MW and 683 MW, respectively. These new technologies would be a good choice because their greenhouse gas emissions were much less than a natural gas power plant. The
greenhouse gas emissions from both of these new technologies are 17.66E+11 gCO2/year, and
the emissions from the natural gas plant are 1.3∗1013gCO 2/ year . Additionally, Spain has
a target of at least 40% domestic reduction in greenhouse gas emissions by 2030 (Climate
Action; Committee on Climate Change) so these new technologies would help Spain reach this target as well as Nationally Determined Contributions’ (NDC) goals for Spain. Producing electricity energy from the PV solar power plant and flash geothermal plant would be less expensive than generating electricity from either natural gas or petroleum, which is another benefit of these new technologies. If the 2683 MW energy demand was produced with natural gas and petroleum, it would cost 1.998 billion US dollars and 10.7 billion US dollars, respectively. However, the new solar and geothermal technologies would cost 1.11986 billion US dollars to reach the 42% target by 2030.
The water consumption would be a problem for the PV solar power plant and the flash geothermal plant because both technologies require water for operations. It is predicted that water consumption would be decreased to unsustainable levels. A flash geothermal plant utilizing groundwater for cooling purposes might change the level of the water or the chemical, physical and biological components of water, thereby impacting the water quality (Hähnlein et al., 2013). The majority of habitants in Europe and approximately half of the world’s population depend on groundwater in terms of drinking water source (Hähnlein et al., 2013). Furthermore, flora and fauna form their habitats in aquifers that is also the main reservoir of fresh water for human consumption (Hähnlein et al., 2013). Thus, the water footprint in a flash geothermal plant would be one reason opposing the production of electricity from this technology. Water is also used for cooling purposes, mirror cleaning, and make-up for the steam cycle in a PV solar power plant (Damerau et al., 2011). There is a water scarcity in south eastern Spain, and the Segura Basin in Spain is considered one of the most water-stressed regions in Europe due to its high irradiation potential (Maaßen et al., 2011; Soto-García et al., 2013). Additionally, Spain has low, medium and high temperature
geothermal resources in south of Spain (Arrizabalaga et al., 2015).The water scarcity in south
of Spain might be a reason why Spain has not invested a lot into solar power plants and geothermal power plants. This barrier could be overcome with using dry cooling technologies at increased cost and energy penalties. For instance, direct dry cooling using air-cooled condensers, Heller systems, and hybrid technologies are alternative technologies for dry cooling. Even though using these technologies significantly reduce the amount of water in a solar power plant, they come with disadvantages: investment costs are around 2% higher, and
for a hybrid cooling system these investment costs can be as much as 3% higher, and the energy output of a dry-cooled plant is less than that of a wet-cooled plant (Damerau et al., 2011). However, it can be assumed that if Spain used the dry cooling technologies for the PV solar and the flash geothermal plant, the electricity production of these two technologies would be less expensive than generating energy from a natural gas plant or a thermal power plant utilizing petroleum.
Another obstacle of developing these new technologies would be monitoring and tracking them. Spain has developed renewable energy sources rapidly and on a large scale, so it might be more difficult for officials to monitor and track the development of renewable energy with the new technologies (The International Energy Agency, 2009). Thus, the monitoring and tracking the new technologies would be expensive and difficult for Spain.
Yet another barrier of investing the PV power plant and the flash geothermal plant would be allocating the required land area. The required land are for these new technologies would be 4159.83 acres, while a thermal power plant only requires 206.5 acres (Nath, 2007) and produces more electricity than the two new technologies would produce. However, when we consider greenhouse gas emissions from the thermal power plant and Spain’s NDC goals, the new technologies would appear to be the better investment.
References
Alavijeh, H. S., Kiyoumarsioskouei, A., Asheri, M. H., Naemi, S., Alavije, H. S., & Tabrizi, H. B. (2013). Greenhouse gas emission measurement and economic analysis of Iran
natural gas fired power plants. Energy policy, 60, 200-207.
Arrizabalaga, I., De Gregoria, M., Garcia de la Noceda, C., Hidalgo, R., & Urchueguia, J. F. (2015). Country update for the Spanish geothermal sector. In Proceedings, World
Geothermal Congress (pp. 19-24).
Central Intelligent Agency.
https://www.cia.gov/library/publications/resources/the-world-factbook/geos/sp.html Climate Action. EU Climate Action.
https://ec.europa.eu/clima/citizens/eu_en
Committee on Climate Change (n.d.). Legal duties on climate change.
https://www.theccc.org.uk/tackling-climate-change/the-legal-landscape/
Damerau, K., Williges, K., Patt, A. G., & Gauché, P. (2011). Costs of reducing water use of concentrating solar power to sustainable levels: Scenarios for North Africa. Energy
policy, 39(7), 4391-4398.
Energy Post (2015). Fraunhofer: Solar power will cost 2 cts/kWh in 2050.
http://energypost.eu/fraunhofer-solar-power-will-cost-2-ctskwh-2050/
Feldman S. (2009). 2.5 Cents Per Kilowatt Hour: America’s Cheapest, Cleanest ‘Holds Steady’ Insideclimate news’.
https://insideclimatenews.org/news/20090930/25-cents-kilowatt-hour-americas-cheapest- cleanest-fuel-holds-steady
Fthenakis, V. M., Kim, H. C., & Alsema, E. (2008). Emissions from photovoltaic life cycles. Environmental science & technology, 42(6), 2168-2174.
Fthenakis, V. M., & Kim, H. C. (2007). Greenhouse-gas emissions from solar electric-and nuclear power: A life-cycle study. Energy Policy, 35(4), 2549-2557.
Global Energy Statistical Yearbook (2019).
https://yearbook.enerdata.net/total-energy/world-consumption-statistics.html
Hähnlein, S., Bayer, P., Ferguson, G., & Blum, P. (2013). Sustainability and policy for the thermal use of shallow geothermal energy. Energy Policy, 59, 914-925.
International Energy Agency (2009). Energy Policies of IEA Countries, Spain 2009 Review.
https://www.iea.org/publications/freepublications/publication/spain2009.pdf
International Energy Agency Renewable Energy Essentials: Geothermal (2010).
https://www.iea.org/publications/freepublications/publication/Geothermal_Essentials.pdf
International Energy Agency (2015). Spain Overview.
https://www.iea.org/media/countries/slt/SpainOnepagerJuly2015.pdf
Maaßen, M., Rübsamen, M., & Perez, A. (2011). Photovoltaic solar energy in Spain. International Finance and Economics.
Nath, R. (2007). Report on the Land Requirement of Thermal Power Stations. Government of
India (Ministry of Power), Central Electricity Authority, New Delhi, India.
Sullivan, J. L., & Wang, M. Q. (2013). Life cycle greenhouse gas emissions from geothermal electricity production. Journal of Renewable and Sustainable Energy, 5(6), 063122.
Solargis (2016). Solar resource maps of Spain.
https://solargis.com/maps-and-gis-data/download/spain
Soto-García, M., Martínez-Alvarez, V., García-Bastida, P. A., Alcon, F., & Martin-Gorriz, B. (2013). Effect of water scarcity and modernisation on the performance of irrigation districts in south-eastern Spain. Agricultural water management, 124, 11-19.
The Institute for Energy Research (IER) (2012). Energy Generating Costs: A Primer.
http://instituteforenergyresearch.org/analysis/electric-generating-costs-a-primer/
The United Nation Population Division (2019).
https://population.un.org/wpp/dataQuery/
U.S. Energy Information Administration (2016). EIA projects 48% increase in world energy consumption by 2040.
https://www.eia.gov/todayinenergy/detail.php?id=26212#
Union of Concerned Scientists (2013). Environmental Impacts of Geothermal Energy.
energy/environmental-impacts-geothermal-energy.html#.WDkrvLIrLIU
World Energy Council (2013). World Energy Resources: Geothermal.
https://www.worldenergy.org/assets/images/imported/2013/10/WER_2013_9_Geothermal .pdf