Turkish Journal of Agriculture - Food Science and Technology
www.agrifoodscience.com, Turkish Science and TechnologyGenetic Variability of Macrophomina phaseolina Isolates from Dry
Beans in Turkey
Serkan Yesil*, Kubilay Kurtulus Bastas
Department of Plant Protection, Faculty of Agriculture, Selçuk University 42130 Campus/Konya, Turkey
A R T I C L E I N F O A B S T R A C T
Article history:
Received 03 November 2015 Accepted 16 February 2016 Available online, ISSN: 2148-127X
Charcoal rot is a soil and seed borne, economically important fungal disease on dry bean in Turkey. Twenty bean isolates of M. phaseolina collected from different locations in Turkey during 2008 and 2012 years were studied for genetic variability using random amplified polymorphic DNA (RAPD) assay, chlorate sensitivity on medium supplemented with 120mM of potassium, phenotype of colony, and pathogenicity. Isolates were identified as M. phaseolina based on morhological features and PCR assays using species-specific primers (MPKF1and MPKR1). Isolates of M. phaseolina were analysed for their aggressiveness on the susceptible bean cv. Akman 98, by soil inoculation method. Isolates exhibiting a dense chlorate phenotype were chlorate-resistant, while those possessing feathery and restricted chlorate phenotypes were chlorate-sensitive. More than half of the isolates (55%) were resistant to chlorate and produced dense phenotype, while 35% isolates showed feathery and two isolates (10%) showed restricted growth. DNA from 20 isolates was subjected to genetic diversity analysis by the RAPD method using 14 randomly chosen 10-base random primers, and low genetic diversity (33.3%) was observed among the tested isolates.
Keywords: Chlorate sensitivity Dry bean Macrophomina phaseolina RAPD Turkey Introduction
Charcoal rot of bean caused by the fungus
Macrophomina phaseolina (Tassi) Goid. causes considerable damage in bean, an important legume of arid and semiarid regions in the world. M. phaseolina is a monotypic soil and seed borne species with a wide host range involving more than 500 species in 75 families (Rayatpanah et al., 2009). It mainly produces either microsclerotia (primary source of inoculum) or pycnidia (Purkayastha et al., 2006).
Charcoal rot is well characterised by the presence of numerous black microsclerotia have a diameter of between 60-200 µm in culture (Holliday, 1980). Under the microscope they appear as round to ovate black dots which, when lighted from above, have relatively large, smooth, rounded bumps on their surface. Pycnidia may also sometimes be seen. These are black and globose varying from 100 µm to 250 µm in length with a truncate ostiole, the spores of which are pointed at one end. The hyphae are septate, usually containing numerous vesicles. Colonies in culture range in colour from white to brown or gray and darken with age. Hyphal branches generally form at right angles to parent hyphae, but branching is also common at acute angles. Aerial mycelium with completely or partially appressed growth may or may not be produce in culture. Some isolates may form concentric growth rings (Dhingra and Sinclair, 1978; Mihail, 1992).
The pathogen causes dark and irregular lesions on epicotyls and hypocotyls of common bean seedlings and the symptoms extend to the cotyledons causing death of
seedlings. In adult plants, charcoal rot symptoms are followed by wilting due closing of the xylem vessels, microsclerotia are formed and roots show discoloration or red to brown lesions. Subsequently, gray-black mycelia and microsclerotia are produced. The plant is defoliated and appears chlorotic, severe infections cause severe grain yield losses. Incidence and development of charcoal rot are favoured under high temperature and drought stresses (Abawi and Pastor-Corrales, 1990).
Despite having a wide host range, Macrophomina is a monotypic genus. Efforts to divide M. phaseolina into sub-species were unsuccessful largely due to the extreme intra-specific variations in morphology and pathogenicity (Purkayastha et al., 2006). Chlorate is an analog of nitrate. Reduction of chlorate to chlorite via nitrate reductase can result in chlorate toxicity in fungi and plants. Generally the chlorate sensitive strains can reduce nitrate to nitrite and chlorate-resistant strains cannot.
Pearson et al. (1986) suggested the use of chlorate phenotypes as a marker for identifying host-specific isolates of M. phaseolina. The researchers classified the
isolates from maize stalks as chlorate-resistant
(possessing dense chlorate phenotype) and soybean isolates as chlorate-sensitive (possessing either feathery or restricted chlorate phenotype). Relationship between chlorate phenotype and host could be employed as a useful marker for identifying host-specific isolates of M.
phaseolina.
*Corresponding Author:
306
A few reports are available on chlorate phenotypes of isolates of M. phaseolina from sorghum (Cloud and Rupe 1991, Su et al., 2001, Das et al., 2008). Cloud and Rupe (1991) reported the occurrence of dense phenotype, whereas Su et al. (2001) obtained all three types of phenotypes (dense, feathery and restricted) in isolates from sorghum roots and field soils in the USA. Information on Indian isolates of M. phaseolina with reference to their response to potassium chlorate is lacking. Moreover, as chlorate sensitivity gives some clues on host preferences as well (soybean/maize) it would be interesting to know whether it gives any indication about the virulence of M. phaseolina. In an earlier report, M. phaseolina isolates from cluster bean showed different response to medium amended with potassium chlorate (Purkayastha et al., 2006).
Earlier studies demonstrated a high degree of variation in the pathogenic properties of M. phaseolina in common bean (Reyes-Franco et al., 2006), soybean (Beas-Fernandez et al., 2006), cotton (Omar et al., 2007), sorghum (Das et al., 2008), sunflower and maize (Rayatpanah et al., 2012) and groundnut (Doley and Jite, 2014).
Specific primers for the identification and detection of
M. phaseolina, MpKF1 and MpKR1 designed from the
conserved sequences of the ITS region was highly specific and yielded a specific 350 bp products. Since, this 350 bp amplicon was absent from other soil-borne pathogens, it can be used for the species-specific identification for M. phaseolina (Babu et al., 2007).
Restriction analysis of the ITS region for M.
phaseolina did not show variability among isolates (Su et
al., 2001). RAPD assay has been used to study genetic diversity of M. phaseolina populations in Australia (Fuhlbohm, 1997), Brazil (Almeida et al., 2003) and India (Jana et al., 2003). RAPD markers were useful in measuring genetic relatedness, and for detecting variation within and among populations of M. phaseolina thus helping one to understand the ecology and biology of the fungus (Almeida et al., 2003). Jana et al. (2003) using RAPD markers reported five major groups of M.
phaseolina from different hosts and countries, including
India, The available reports on chlorate sensitivity studies in M. phaseolina hardly attempted any correlation with field virulence information (Das, et al., 2008).
The study was conducted on Turkish isolates of M.
phaseolina causing charcoal rot on dry bean from Central
Anatolia in order to investigate genetic relatedness among bean isolates of M. phaseolina from Turkey, assess their chlorate phenotypes and relationship with pathogenicity on bean.
Materials and Methods
Fungal Isolation
Dry beans showing typical charcoal rot symptoms on roots and stems were collected from 20 locations of different regions of Central Anatolia in Turkey during the years 2008 and 2012.
The fungus M. phaseolina was isolated from each
sample by placing fragments of infected root and stem tissue on potato dextrose agar (PDA) plate followed by incubation at 28°C for 4 days. Obtained isolates were preliminary identified based on morphology using light microscop. Cultures of totaly 20 isolates were obtained as single microsclerotial isolates and they were suspended in 15% glycerol and stored at -80°C.
Chlorate Assay
M. phaseolina isolates were examined for chlorate
phenotype on PDA medium amended with 120 mM potassium chlorate (Pearson et al., 1986). Cultures were inoculated in triplicate with a 3-mm mycelial disc cut from the periphery of 5-day-old cultures grown on PDA and incubated in darkness at 30°C for 6 days. Colony phenotypes were recorded after comparison with cultures of similar age that grew on the same medium without chlorate. Each isolate on each medium was replicated twice. The growth of each isolate was recorded for phenotype of colony and production of microsclerotia.
Morphological Analysis
The morphological characteristics of the isolates were investigated, including, height of aerial mycelium, average length and width of 50 microsclerotia, and time of microsclerotia formation. One mycelial block (10 mm diameter) out from e seven days-old pure culture was transferred to center of 9 cm Petri dish that was sealed and incubated in the dark at 30°C for 96 h. Each treatment was replicated three times. At the sixth day, certain characteristics of colony were registered (mycelium colour, shape of colony, growth type of colony, and height of aerial mycelium). Finally, mycelia and microsclerotia of each isolate were recovered and placed on synthetic resin; length and width of 50 microsclerotia were registered using a micrometer adapted to optical microscope (Leica Microsystems, Wetzlar, Germany) at 40X (Beas-Fernandez et al., 2006; Mahdizadeh et al., 2011).
Pathogenicity Test
Pathogenicity of all the isolates was tested by artificial inoculation for fulfilling Koch’s postulates. The experimental design was a randomized complete block with five replicates at growth chambers. The substrate for growth of isolates was prepared in 500 ml glass bottles, each bottle containing 50 g of sorghum grains and 40 ml of tap water. Each bottle was autoclaved, then, infested with a mycelium plug taken from 7 days old potato dextrose agar (PDA) culture, and allowed to colonize sorghum for three weeks at 25°C (Omar et al., 2007). Pathogenicity tests were carried out by using autoclaved clay loam soil. Batches of soil were infested separately with inoculum of each isolate at the rate of 50 g/kg of soil. The soil infested with M. phaseolina was dispensed in 15-cm diameter pots and 5 seeds were planted per pot (cv. Akman 98). In the control treatment, same amount of soil were seeded with 5 seeds per pot. In each replication, symptoms were observed and individual plants were rated for charcoal rot damage on a 1-9 scale (Iqbal et al., 2010).
307
Percentage of pre-emergence damping-off was recorded 15 days after sowing. Post-emergence damping-off, survival were recorded 30 days after sowing. The temperature regime in the greenhouse ranged from 22 ± 4°C to 41 ± 5°C. Each treatment was replicated three times.
Infected stems were cut at the point where rot symptom just started becoming visible. The fungus was reisolated on PDA medium and incubated at 28°C for 5 days.
Pathogenicity of each isolate was calculated by using McKinney’s infection index formula (Yesil and Boyraz, 2010).
Statistical Analysis
Data from pathogenicity tests were subjected to ANOVA and means were compared using LSD range test as described by Yesil and Boyraz, (2010). Analysis of variance (ANOVA) of the data was performed with the MSTAT-C Statistical Package(Michigan State University, East Lansing, MI, USA).
DNA Extraction
For DNA extraction a 5 mm disc from a 2 days old culture of M. phaseolina isolates, were grown in a 250 ml Erlenmeyer flasks containing 100 ml of potato dextrose broth (PDB) at 26°C for 15 days in dark. Mycelia from PDB were harvested by centrifuging at 10,000 rpm for 10 min (Eppendorf, Germany). The pellet was washed in sterile water and ground with liquid nitrogen. The
mycelial powder was then treated with
hexadecyltrimethyl-ammonium bromide (CTAB)
extraction buffer (50mM Tris-HCl, pH 8.0, 700mM NaCl, 10mM EDTA, 10% CTAB). Extracted genomic DNA was purified by the phenol-chloroform method and precipitated with ethanol. DNA was extracted from 50 mg of fresh mat (Guo et al. 2005). The quality of the genomic DNA was checked on 0.8% agarose gel and quantified at 260 nm in a UV spectrophotometer and stored at -20°C for further use.
PCR Amplification of M. phaseolina
The specific primers MpKFI
(5'-CCGCCAGAGGACTATCAAAC-3') and MpKRI
(5'-CGTCCGAAGCGAGGTGTATT-3') designed by Babu et al. (2007), were used for DNA amplification. PCR
amplifications were performed in a totalvolume of 20 µL
by mixing 2 µL of 10x PCR buffer, 0.2 mM dNTPs, 5
pmol of each primer, 0.4 U Taq DNA polymeraseand 35
ng of template DNA. The PCR mix without template DNA was used as negative control. The PCR reaction was carried out for initial denaturation step at 95 C for 3 min. and for 25 cycles of denaturation at 95°C for 30 s,
followed byannealing at 56°C for 1 min, extension at
72°C for 2 min andthe final extension step of 72°C for 10
min. PCR products were stained with ethidium bromide (0.75 mg/ml) and visuelized using a UV trans-illuminator (UVI Tech, England).
RAPD Assay
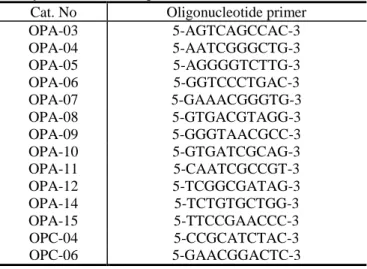
DNA from 20 isolates was subjected to genetic diversity analysis by the RAPD method (Das et al., 2008) using 14 randomly chosen 10-base random primers of OPA Kit (03, 04, 05, 06, 07, 08, 09, A-10, A-11, A-12, A-14, A-15, C-04 and C-06) (Operon Kit A; Operon Technologies, Alameda, CA) (Table 1). PCR reactions were carried out in 0.2 ml thin-walled PCR tubes with a total reaction volume of 25 ml containing
10mM Tris-HCl (pH 8.3), 50mM KCl, 2mM MgCl2, 1.5
unit Taq DNA polymerase, 0.2mM dNTPs (Bangalore Genei), 0.4 mM of primers and 50 Zg genomic DNA. Amplification was programmed for 45 cycles in a
thermocycler (Eppendorf Personel thermocycler,
Germany). Each cycle consisted of a denaturation step at 94°C for 1 min, a primer annealing at 36°C for 1 min, a primer extension step at 72°C for 2 min. A negative control with all reaction reagents except the DNA template was included with each set of PCR amplification reactions. The amplified DNA fragments were separated by electrophoresis in 1% agarose gel (Sigma-Aldrich, USA) in 1% Tris borate EDTA buffer (89mM Tris-HCl, 89mM boric acid and 2mM EDTA pH 8.0) and were stained with ethidium bromide (0.75 mg/ml) and visualized using a UV trans-illuminator (UVI Tech, England).
Molecular Data Analysis
RAPD banding patterns were scored for the presence (scored 1) or absence (scored 0) of specific amplicon. Data were analyzed using NTSYSpc statistical software (version 2.02j) (Applied Biostatistics Inc.). Similarity coefficients for all possible pairs of isolates based on their fingerprinting groups were estimated using the Dice coefficient. A dendrogram was constructed from the similarity coefficient data by the unweighted pair-group method using the arithmetic averages (UPGMA) clustering algorithm in NTSYSpc (Das et al., 2008).
Table 1 List of oligonucleotide primers used for RAPD assay and their base sequences
Cat. No Oligonucleotide primer
OPA-03 5-AGTCAGCCAC-3 OPA-04 5-AATCGGGCTG-3 OPA-05 5-AGGGGTCTTG-3 OPA-06 5-GGTCCCTGAC-3 OPA-07 5-GAAACGGGTG-3 OPA-08 5-GTGACGTAGG-3 OPA-09 5-GGGTAACGCC-3 OPA-10 5-GTGATCGCAG-3 OPA-11 5-CAATCGCCGT-3 OPA-12 5-TCGGCGATAG-3 OPA-14 5-TCTGTGCTGG-3 OPA-15 5-TTCCGAACCC-3 OPC-04 5-CCGCATCTAC-3 OPC-06 5-GAACGGACTC-3
308
Results and Discussion
Idendification of Isolates
All isolates which were used in the study were identified as M. phaseolina by using macroscopic, microscopic and molecular methods. On PDA, the isolates showed typical morphologic characteristics as growth of colony, colour of colony, and formation of septate hyphae and microsclerotia (Fig.2b,c). Colony morphologies of the isolates were obtained as black/gray, aerial/smooth, and irregular/radial. Most of the isolates had black (95%) colour, radial (60%), and smooth (95%) colony. Aboshosha et al. (2007) reported similar results about morphological characteristics of M. phaseolina isolates from different host plants. According to their results, most of the isolates had black colour. Growth rates were changed between 0,995 (Mp.Kon.1) and 1,537 mm/h (Mp.Nev.1) (Table 2). Formation of septate hyphae and microsclerotia were observed on all of the isolates.The species-specific primers designed by Babu et al. (2007) amplified one 350 bp band in all isolates of
Macrophomina, confirming that the isolates obtained
belonged to the species M. phaseolina (Fig.2g).
Chlorate Assay
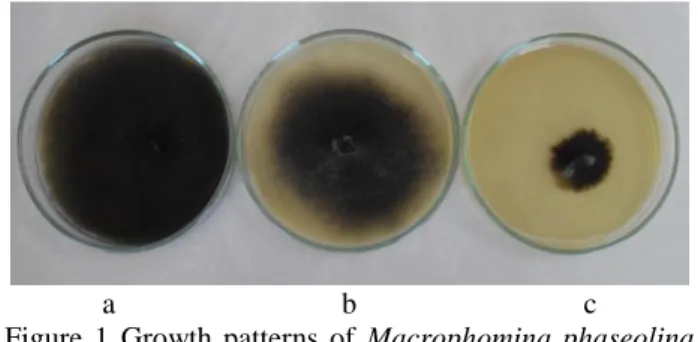
Isolates showed mixed response to potassium chlorate. Isolates exhibiting a dense chlorate phenotype were chlorate-resistant, while those possessing feathery and restricted chlorate phenotypes were chlorate-sensitive (Fig. 1). Out of the 20 tested isolates, two (Mp.Kon.1 and Mp.Kon.3) were sensitive to chlorate and produced restricted phenotype (inhibited growth) on minimal medium containing 120mM potassium chlorate. More than half of the isolates (55%) were resistant to chlorate and produced dense phenotype. Seven isolates (35%) showed feathery and two isolates (10%) restricted growth (Table 2). Su et al. (2001) reported similar results when they studied the response to potassium chlorate of 15 isolates of M. phaseolina from cotton. According to their results, dense, feathery, and restricted isolates represented 33.3, 40.0, and 26.4 %, respectively.
a b c
Figure 1 Growth patterns of Macrophomina phaseolina isolated from bean stem and root when grown on a medium containing 120 mM potassium chlorate in Petri dishes. Dense growth pattern (a), feathery growth pattern (b), and resrtricted growth pattern (c)
Morphological Analysis
Isolates were characterized according to the height of aerial mycelium when grown on PDA medium. Low aerial mycelium measured 0 mm, medium aerial mycelium measured 1-2 mm, and high aerial mycelium measured greater than 2 mm. Among the isolates collected in Turkey, 40% had low aerial mycelium, 55% were moderate, and 5% had high aerial mycelium (Table 2). Mahdizadeh et al. (2011) reported similar results about morphological characteristics of M. phaseolina isolates from different host plants. According to their results, among the isolates collected in Iran, 30.8% had low aerial mycelium, 48.1% were moderate, and 21.2% had high aerial mycelium. Isolates Mp.Kon.2 and Mp.Aks.1 had the largest microsclerotia (156,62 x 128,37 µm and 149,17 x 122,35 µm), and isolates Mp.Kon.4 and Mp.Kay.3 had the smallest microsclerotia (73,57x58,21 µm and 78,12x68,32 µm). Microsclerotia formation times of the isolates incubated at 37°C showed variability.
Mp.Kon.1, Mp.Kon.3 and Mp.Kar.1 formed
microsclerotia before 48 h of incubation at 37 C. However, Mp.Kon.4, Mp.Kon.1, Mp.Kar.2, Mp.Kay.2, Mp.Kay.3, Mp.Siv., Mp.Kır., and Mp.Yoz. formed microsclerotia after 60 h of incubation at 37°C (Table 2).
Pathogenicity Test
All isolates of M. phaseolina were analysed for their aggressiveness on the susceptible bean cv. Akman 98 by soil inoculation method (Table 3). Pathogenicity test results showed that all of the isolates were pathogenic to the susceptible dry bean genotype Akman 98. There was considerable variation in aggressiveness among all isolates on dry bean. While, Mp.Nev.1 was determined the most aggressive isolate, Mp.Kır. was the least aggressive one. However, none of the tested isolates was pathogenic at the pre-emergence stage (P<0.01), most of them showed pathogenicity at the post-emergence stage. Percentage of post-emergence damping-off was the highest with 81.81% for Mp.Nev.1. Also, chlorate-resistant-isolates (Dense phenotypes) were highly aggressive, while chlorate-sensitive phenotypes were less aggressive on dry bean (Tables 2, 3). The pathogenic variability of this fungus has already been described in different host plants such as soybean and sunflower (Dhingra and Sinclair, 1973), and is assumed to be due to mutation, hyphal fusion and mitotic recombination. Typical symptoms of charcoal rot similar to those produced in natural field conditions were observed on inoculated dry bean plants. Premature yellowing of the top leaves followed by premature leaf drop occurred. The tap and secondary roots, as well as lower stems, had a silver or light grey discoloration. Sclerotia were easily visible beneath scraped epidermis and when stems were split open. These microsclerotia imparted a pepper-like appearance to the tissues, a diagnostic symptom of charcoal rot. The plants growth on uninfested soil did not show any visible reaction and remained healthy.
309
a b c
d e f
g h i
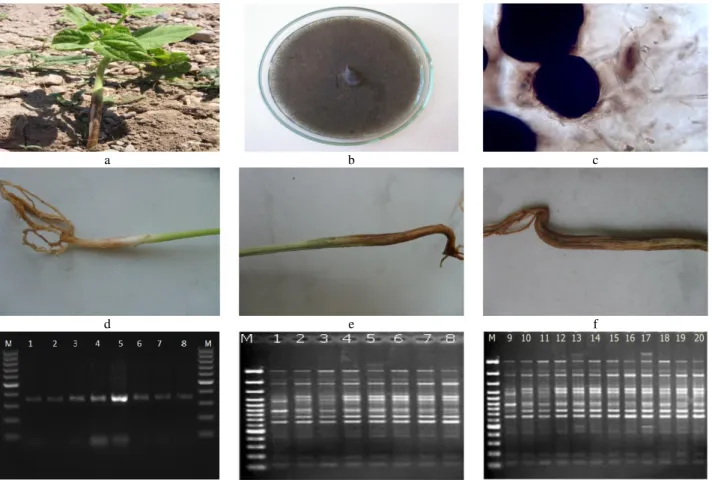
Figure 2. a.Typical disease symptoms of M. phaseolina on bean seedling; b. Growth of the fungus on PDA medium; c. Microsclerotia of the fungus (magnificated by 10x40); d. Symptom scored 3 on scale; e. Symptom scored 7 on scale; f. Symptom scored 9 on scale according to Iqbal et al., (2010); g. 350 bp amplicons obtained by PCR using MPKF1 and MPKR1; h, i. RAPD profiles obtained with random primer OPA-3 (M: molecular weight marker, 1: MpKır, 2: MpSiv, 3: MpYoz, 4: MpEsk2, 5: MpEsk1, 6: MpKay3, 7: MpKay2, 8: MpKay1, 9: MpNev2, 10: MpNev1, 11: MpNig2, 12: MpNig1, 13: MpAks2, 14: MpAks1, 15: MpKar2, 16: MpKar1, 17: MpKon4, 18: MpKon3, 19: MpKon2, 20, MpKon1)
Table 2 Isolate number and colony characteristics on non-chlorated PDA medium of 20 isolates of M. phaseolina
Isolates code Origin Mc1 Shape Growth GR2 HAM3 A B
Mp.Kon.1
Konya
Black Irregular Smooth 0,995 L +
Mp.Kon.2 Black Irregular Smooth 1,292 M
Mp.Kon.3 Black Irregular Smooth 1,230 L +
Mp.Kon.4 Black Radial Smooth 1,019 M +
Mp.Kar.1
Karaman Black Irregular Smooth 1,118 M + +
Mp.Kar.2 Black Irregular Smooth 1,301 M +
Mp.Aks.1
Aksaray Black Radial Smooth 1,084 M
Mp.Aks.2 Black Radial Smooth 1,238 M
Mp.Nig.1 Niğde Gray Radial Am4 1,240 H
Mp.Nig.2 Black Radial Smooth 1,105 L
Mp.Nev.1 Nevşehir Black Radial Smooth 1,537 L
Mp.Nev.2 Black Radial Smooth 1,221 L
Mp.Kay.1
Kayseri
Black Radial Smooth 1,138 M
Mp.Kay.2 Black Radial Smooth 1,211 M +
Mp.Kay.3 Black Radial Smooth 1,010 M +
Mp.Esk.1 Eskişehir Black Irregular Smooth 1,182 L
Mp.Esk.2 Black Irregular Smooth 1,312 L
Mp.Siv. Sivas Black Radial Smooth 1,156 M +
Mp.Kır. Kırşehir Black Irregular Smooth 1,184 L +
Mp.Yoz. Yozgat Black Radial Smooth 1,385 M +
1
Mc: Mycelium colour; 2GR: Growth rate at 30°C (mm/h); 3HAM: Height of aerial mycelium, L=low (0 mm), M=moderate (1-2 mm), H=high (> 2 mm). 4Am: Aerial mycelium ; A: Isolates with microsclerotia formed before 48 h of incubation at 37°C , B: Isolates with microsclerotia formed after
310
RAPD AssayRAPD analysis has been a useful tool for detecting intra-specific genetic variation in M. phaseolina population in different countries (Fuhlbohm, 1997; Su et al., 2001; Almeida et al., 2003). DNA from 20 isolates was subjected to genetic diversity analysis by the RAPD method using 14 randomly chosen 10-base random primers of OPA Kit and showed little amount of genetic diversity among the tested isolates, which might be due to genetic diversity in the native population that has infected various crops through the years.
All RAPD primers tested yielded amplification products in most of the isolates (Fig. 2G and H). RAPD analysis of 20 isolates of M. phaseolina generated 135 levels of distinct scorable markers with an average of 9.7 amplicons per marker. Of the 135 bands, 45 (33.3%) were found to be polymorphic. Primer OPA-8 produced two monomorphic bands that were shared by all 20 isolates. The primers OPA-8 and OPA-14 amplified the highest number of loci (61 and 49 loci, respectively).
The highest number of amplicons was obtained from the isolate Mp.Kon.4 and the lowest from Mp.Kır. UPGMA clustering of RAPD data produced a dendrogram that could separate 20 isolates into seven groups at an arbitrary level of 87% similarity (Fig. 3). Genetic similarity coefficient ranged from 0.56 to 0.96. Groups 2 and 4 consisted of a single isolate; groups 1, 3 and 6 consisted of two isolates each, whereas groups 5 and 7 consisted of four and eight isolates, respectively. Group 7 with eight isolates was the largest with average similarity 77% (calculated from similarity matrix). Two isolates, Mp.Esk.2 and Mp.Esk.1, were the most distinct from the rest and were closest neighbours with 96% similarity between them. Isolates from the same locations showed a tendency to group together compared to geographically farther ones. These findings were in agreement with reports concerning M. phaseolina population in several parts of the world (Pearson et al., 1986; Mihail and Taylor, 1995; Selvan and Seetharaman, 2000; Almeida et al., 2003; Beas-Fernandez et al., 2006; Reyes-Franco et al., 2006; Purkayastha et al., 2006; Das et al., 2008). The chlorate-sensitive isolates were placed in two neighbouring groups, whereas resistant isolates were scattered in different groups in the dendrogram (Fig. 3).
The amount of variation identified in the present study was in harmony with such deuteromycetous fungus and was suggested (Manici et al., 1995; Mihail and Taylor, 1995) to be due to its heterokaryotic nature. Probably, study with higher number of isolates and the establishment of techniques such the restriction fragment length polymorphism (RFLP) of the nuclear, ribosomal and the mitochondrial DNA for M. phaseolina isolates could certainly help to reveal more variations for better understanding of the population structure of M.
phaseolina isolates. Such characterization and understanding of the population genetic structure of a pathogen is a vital consideration in elucidating disease epidemiology and could be a strategy for devising a stable disease management in a specific region (Purkayastha et al., 2006).
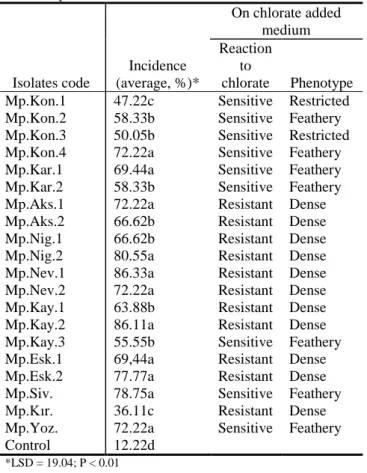
Table 3 Pathogenicity test results and colony
characteristics on 120 mM potassium chlorate added PDA of 20 M. phaseolina isolates Isolates code Incidence (average, %)* On chlorate added medium Reaction to chlorate Phenotype
Mp.Kon.1 47.22c Sensitive Restricted
Mp.Kon.2 58.33b Sensitive Feathery
Mp.Kon.3 50.05b Sensitive Restricted
Mp.Kon.4 72.22a Sensitive Feathery
Mp.Kar.1 69.44a Sensitive Feathery
Mp.Kar.2 58.33b Sensitive Feathery
Mp.Aks.1 72.22a Resistant Dense
Mp.Aks.2 66.62b Resistant Dense
Mp.Nig.1 66.62b Resistant Dense
Mp.Nig.2 80.55a Resistant Dense
Mp.Nev.1 86.33a Resistant Dense
Mp.Nev.2 72.22a Resistant Dense
Mp.Kay.1 63.88b Resistant Dense
Mp.Kay.2 86.11a Resistant Dense
Mp.Kay.3 55.55b Sensitive Feathery
Mp.Esk.1 69,44a Resistant Dense
Mp.Esk.2 77.77a Resistant Dense
Mp.Siv. 78.75a Sensitive Feathery
Mp.Kır. 36.11c Resistant Dense
Mp.Yoz. 72.22a Sensitive Feathery
Control 12.22d
*LSD = 19.04; P < 0.01
Figure 3 Dendrogram constructed with the UPGMA clustering method for 20 isolates of M. phaseolina
This is the first study about genetic variability among bean isolates of M. phaseolina in Turkey. Chlorate-sensitive isolates seemed to be genetically closer among them than the resistant one. They were placed in two neighbouring groups, whereas resistant isolates were scattered in different groups in the dendrogram based on RAPD polymorphism. This finding was in agreement with that observed by Su et al. (2001), who noted that chlorate-sensitive isolates from sorghum roots formed a distinctly separate cluster from the resistant one. Further studies on genetic basis for chlorate sensitivity can generate more information on this.
311
Chlorate-sensitive isolates, in general, showed a tendency to score more disease than the resistant ones. One of the probable reasons may be the ability of sensitive isolates to utilize nitrate, in addition to other available nitrogen sources in plant sap, which might have helped them grow better or faster than the resistant isolates and result in more disease development. All the chlorate-resistant isolates failed to reduce potassium nitrate as the sole source of nitrogen in the nitrate reduction test, implying the absence or inactivity of the nitrate reductase pathway in these isolates.
Reasons for the phenotype shifts are not clear. They may be associated with the heterogeneous, possibly polygenic nature of microsclerotia. But the fact that no sectors were observed on media amended with chlorate argues against this explanation (Cloud and Rupe, 1991). More works needs to be done to determine the mechanisms of chlorate assimilation in M. phaseolina.
Conclusion
This is the first study on genetic and phenotypic diversity among isolates of M. phaseolina in Turkey. In the present study, 20 isolates of M. phaseolina were recovered from diseased dry bean plants throughout 10 Turkish provinces surveyed. All isolates were identified to species level based on species-specific primers.
According to growth on PDA medium amended with 120 mM potassium chlorate, the isolates were categorized into three physiologically distinct phenotypic groups: 55% of the isolates showed dense growth (resistant); 35% of the isolates showed feathery spreading growth (resistant); and 10% of the isolates showed restricted growth (sensitive).
Isolates were characterized according to the height of aerial mycelium when grown on PDA culture. Among the isolates, 40% had low aerial mycelium, 55% were moderate, and 5% had high aerial mycelium.
There was considerable variation in aggressiveness among all isolates on dry bean. While, Mp.Nev.1 was determined the most aggressive isolate, Mp.Kır. was the least aggressive one. Also, chlorate-resistant-isolates
(dense phenotypes) were highlyaggressive, while
chlorate-sensitive phenotypes were less aggressive on dry bean.
The little amount of genetic diversity observed among the tested isolates might be due to genetic diversity in the native population that has infected various crops through the years. In the present study, a cluster analysis with UPGMA, the dendrogram is constructed. The isolates were divided into seven major clusters. Isolates from the same locations showed a tendency to group together compared to geographically farther ones.
References
Abawi GS, Pastor Corrales MA. 1990. Root rots of beans in Latin America and Africa; diagnosis, research methodologies and management strategies. CIAT, Colombia. 114 p.
Aboshosha SS, Atta Alla SI, El-Korany AE, El-Argawy E. 2007. Characterization of Macrophomina phaseolina Isolates Affecting Sunflower Growth in El-Behera Governorate, Egypt. Int. J. Agri. Biol., 9 (6): 807-815.
Almeida AMR., Abdelnoor RV, Arias CAA, Carvalho VP, Filho DSJ, Marin SRR, Benato LC, Pinto MC, Carvalho CGP. 2003. Genotypic diversity among Brazilian isolates of Macrophomina
phaseolina revealed by RAPD. Fitopatol. Bras., 28: 279-285.
Babu BK, Saxena AK, Srivastava A K, Arora DK. 2007. Identification and detection of Macrophomina phaseolina by using species-specific oligonucleotide primers and probe. Mycologia, 99:797-803.
Beas-Fernandez R, De Santiago-De Santiago A, Hernandez-Delgado S, Mayek-Perez N. 2006. Characterization of Mexican and non-Mexican isolates of Macrophomina phaseolina based on morphological characteristics, pathogenicity on bean seeds and endoglucanase genes. J. Plant Pathol., 88 (1): 53-60. Cloud GL, Rupe JC. 1991. Morphological instability on a chlorate
medium of isolates of Macrophomina phaseolina from soybean and sorghum. Phytopathology, 81: 892-895.
Das IK, Fakrudin B, Arora DK. 2008. RAPD cluster analysis and chlorate sensitivity of some Indian isolates of Macrophomina
phaseolina from sorghum and their relationships with
pathogenicity. Microbiol. Res., 163: 215-224.
Dhingra OD, Sinclair JB. 1973. Variation among isolates of
Macrophomina phaseoli (Rhizoctonia bataticola) from different
regions. J. Phytopathol., 76: 200-204.
Dhingra OD, Sinclair JB. 1978. Biology and Pathology of
Macrophomina phaseolina. O.D. Dhingra and J.B. Sinclair eds.
Universidade Federal De Vicosa, Minas Gerais.166p.
Doley K, Jite PK. 2014. Interaction effects of Glomus fasciculatum and Trichoderma viride inoculations on groundnut plants inoculated with pathogen Macrophomina phaseolina. IJAS, 4 (9): 281-288.
Fuhlbohm M. 1997. Genotypic diversity among Austrialian isolates of Macrophomina phaseolina. XX Biennial Australian Plant Pathology Society Conference. Lincoln University, New Zeland, P.52.
Guo JR, Schnieder F, Abd-Elsalam KA, Verreet JA. 2005. Rapid and efficient extraction of genomic DNA from different phytopathogenic fungi using DNAzol reagent. Biotechnol. Lett., 27: 3-6.Holliday P. 1980. Fungus Diseases of Tropical Crops. Pp. 254-255. Dover Publications, Minneola.
Iqbal U, Mukhtar T, Muhammad S, Ul-Haque II, Malik SR. 2010. Host plant resistance in blackgram against charcoal rot (Macrophomina phaseolina (Tassi) Goid). Pak. J. Phytopath, 22 (2): 126-129.
Jana TK, Sharma TR, Prasad RD, Arora DK. 2003. Molecular characterization of Macrophomina phaseolina and Fusarium species by a single primer RAPD technique. Microbiol. Res, 158: 249-257.
Mahdizadeh V, Safaie N, Goltapeh EM. 2011. Diversity of
Macrophomina phaseolina Based on Morphological and
Genotypic Characteristics in Iran. Plant Pathol. J., 27(2): 128-137. Manici LM, Caputo F, Castro C. 1995. Temperature responses of
isolates of Macrophomina phaseolina from different climatic regions of sunflower production in Italy. Plant Dis., 79: 838-839.
Mihail JD. 1992. Macrophomina. In: Methods for Research on Soilborne Phytopathogenic Fungi. Ed. Larry L. Singleton, Jeanne D. Mihail, Charles M. Rush. Pp.134-136. APS Press. The American Phytopathological Society. Second edition, 1993. St., Paul, Minnesota.
Mihail JD, Taylor ST. 1995. Interpreting variability among isolates of Macrophomina phaseolina in pathogenicity, pycnidium production and chlorate utilization. Can. J. Bot., 73: 1596-1603. Omar MR, Abd-Elsalam KA, Aly AA, El-Samawaty AMA, Verreet JA. 2007. Diversity of Macrophomina phaseolina from cotton in Egypt: Analysis of pathogenicity, chlorate phenotypes, and molecular characterization. J. Plant Dis. Protect., 114 (5): 196-204.
312
Pearson CAS, Leslie JF, Schwenk FW. 1986. Variable chlorateresistance in Macrophomina phaseolina from corn, soybean and soil. Phytopathology, 76: 646-649.
Purkayastha S, Kaur B, Dilbaghi N, Chaudthury A. 2006. Characterization of Macrophomina phaseolina, the charcoal rot pathogen of cluster bean, using conventional techniques and PCR-based molecular markers. Plant Pathol., 55: 106-116. Rayatpanah S, Nanagulyan SG, Alav SV, Yasari E. 2009.
Phenotypic variations of isolates of Macrophomina phaseolina from different hosts in northern Iran. Aust. J. Basic and Appl. Sci., 3(3): 2908-2913.
Rayatpanah S, Nanagulyan SG, Alav SV, Razavi M, Ghanbari-Malidarreh A. 2012. Pathogenic and genetic diversity among Iranian isolates of Macrophomina phaseolina. Chil. J. Agr. Res., 72 (1): 40-44.
Reyes-Franco MC, Hernandez-Delgado S, Beas-Fernandez R, Medina-Fernandez M, Simpson J, Mayek-Perez N. 2006. Pathogenic and genetic variability within Macrophomina
phaseolina from Mexico and other countries. J. Phytopathol.,
154: 447-453.
Selvan SM, Seetharaman K. 2000. Relationship among pigment synthesis, culture media growth and virulence of the geographical isolates of Macrophomina phaseolina causing charcoal rot of sunflower. Can. J. Plant Pathol., 13: 370-374. Su G, Suh SO, Schneider RW, Russin JS. 2001. Host specialization
in the charcoal rot fungus, Macrophomina phaseolina. Phytopathology, 91: 120-126.
Yesil S, Boyraz N. 2010. Determination of Fungal and Bacterial Diseases on Bean Plants in Bean Production Areas in Konya Province, Turkey. Proceedings of the 2nd International Symposium on Sustainable Development. Sarajevo, Bosnia-Herzegovina, June 8-9, 2010, p.219-230.