CBÜ Fen Bil. Dergi., Cilt 12, Sayı 1, 27-37 s CBU J. of Sci., Volume 12, Issue 1, p 27-37
27
Effect of Impactor Mass on Dynamic Response and Retention
Properties of Composite Plates under Successive Impacts
Ömer Sinan Şahin1, Aydın Güneş2*, Hakan Burak Karadağ3
1Selçuk University, Department of Mechanical Engineering, 42075 Kampüs Konya, +90 332 223 1827 [email protected]
2Selçuk University, Department of Mechanical Engineering, 42075 Kampüs Konya, +90 332 223 1827 [email protected]
3Necmettin Erbakan University, Department of Metallurgical and Materials Engineering 42040 Konya [email protected] *Corresponding author Received: 8th January 2016 Accepted: 15th April 2016 DOI: http://dx.doi.org/10.18466/cbujos.00144 Abstract
This study mainly focuses on the effect of mass of impactor upon dynamic response of laminated composites. For this purpose two different impactors with different masses were used. The impact velocities were selected so that impactors with different masses had the same kinetic energy. The experiments were performed on simply supported woven E-glass reinforced epoxy laminates which are made of 8 layers stacked symmetrically. The variation of impact force, impactor velocity and laminate displacement versus interaction time were obtained. The impulse and energy absorption characteristics and damage zones were also investigated. After low velocity impact, the test specimens were subjected to three-point bending testing in order to get retention mechanical properties.
Keywords: Polymer matrix, laminates, impact and ballistic
1 Introduction
Composite materials may be subjected to unexpected shocks and impacts which can form internal damage such as delamination and back-face splitting or bulg-ing. It is reported that internal damage within com-posite materials can reduce the residual strength as much as 60% depending on the damage area and deformation mechanisms [1–4].
Low velocity impact response of laminated compo-sites was theoretically investigated by some authors [5-7]. The retention mechanical properties of these materials were investigated by using compression after impact test [8-11]. Impact can produce delami-nations and matrix cracks [12–14, 10] and change the internal strain distribution. The general failure modes that can arise within fiber reinforced
compo-sites are matrix damage, delamination, fiber damage and penetration [15, 16]. These types of damage are generally barely visible by naked eye. Visible dam-age occurs if impact has energy above impact energy threshold of the material which is laminate stiffness dependent. Transverse impact first initiates intraply matrix cracks within a lamina. The cracks within a lamina may appear as shear cracks or as bending cracks at the surface of the laminate. Shear cracks are generated by interlaminar shear stresses while bend-ing cracks are generated by tensile stress [17, 18]. The formation and accumulation of these flaws can lead to failure of the apparently undamaged structure. The damage formation and progression can also result in oscillatory interactions of elastic waves cre-ated by impact, such as wave reflection at newly
CBÜ Fen Bil. Dergi., Cilt 12, Sayı 1, 27-37 s CBU J. of Sci., Volume 12, Issue 1, p 27-37
28 created interfaces inside the material and wave inter-actions [19].
Belingardi et al. [20, 21] tested thick composite lami-nates under repeated impacts. The damage progres-sion and energy dissipation of woven glass rein-forced composite was investigated [22, 23] under repeated impacts until complete perforation. The resistance to repeated low energy impacts of differ-ent fabrics reinforced composites was investigated by Morais et al. [24]. Hosur et al. [25] investigated the repeated impact behaviors of woven carbon/epoxy and woven glass/epoxy composites. Mouritz et al. [26] studied the effect of increasing impact energy and increasing number of repeated impact upon flexural strength and interlaminar shear strength of stitched and non-stitched glass-reinforced plastic (GRP) laminates.
The literature review showed that studies on low velocity impact responses of laminated composites mainly focus on impact response under single im-pact or repeated imim-pact. However, in practice an impact shows itself as successive impacts in which dropping mass continuously impacts and rebounds until initial impact energy fully consumed. During an impact event 12-15 successive impacts with de-creasing intensity can be observed. The contact force is maximum at the first impact and the great majority of the damage occurs during that time. However, successive impacts expand the damage zones and involve the response of damaged material.
The aim of this study is to investigate the effect of impactor mass on the dynamic behaviors of compo-site laminates. The experiments were performed on a drop weight testing machine by using two different impactors with different masses. The experiments were performed on simply supported woven E-glass/epoxy laminates. The reason why this material has been selected is that its simple nature and well characterized properties. So, it is believed that the obtained results can easily be generalized and ap-plied to different kinds of composite materials which are in complex nature.
The impact forces and laminate deflections versus interaction time have been obtained. Impulse force and kinetic energy absorption of the laminate sub-jected to different strike velocities have also been investigated. After the impact test, the damage for-mation on the laminates was assessed and effects of
impact loading upon mechanical properties were obtained by using three point bending test.
2 Experimental Studies
2.1 Materials
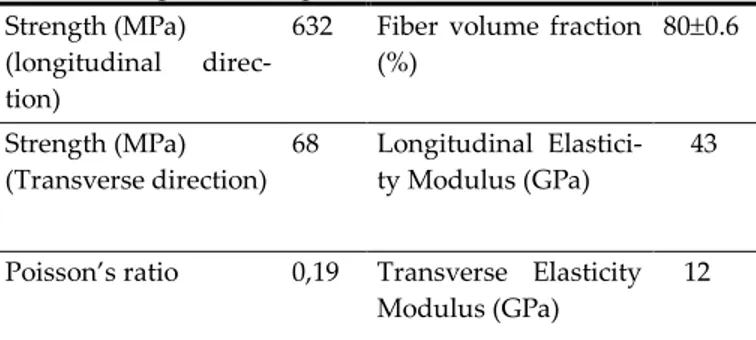
The test specimens are 8 plied woven E-glass/epoxy. The dimensions of the test specimens are 90x25x3mm. Table 1 presents the mechanical proper-ties of the matrix and reinforcement materials. Com-ponents were cured at 80 oC for 2 hours and were cut down to the specified dimensions of the test spec-imens by using high revolution speed circular saw under water coolant. Then, the materials inspected by naked eye in order to determine possible perfora-tions such as interlaminar damage and edge delami-nations which could form during cutting. However no noteworthy perforations were observed. The composite materials were then subjected to mechani-cal testing and burn off test. Table 2 shows the me-chanical properties of composite plates.
Table 1 Mechanical property of the fiber and the
matrix E (GPa)
TS (MPa)
(g/cm3) εmax (%) E-glass 73 2400 2.6 4-5 Epoxy 3.4 50-60 1.2 1.5-2Table 2 Properties of specimens
Strength (MPa) (longitudinal direc-tion)
632 Fiber volume fraction (%) 800.6 Strength (MPa) (Transverse direction) 68 Longitudinal Elastici-ty Modulus (GPa) 43
Poisson’s ratio 0,19 Transverse Elasticity Modulus (GPa)
12
2.2 Testing Set-up
An instrumented drop weight impact testing ma-chine was used to perform tests. It consisted of a drop tower equipped with an impactor and a varia-ble crosshead weight arrangement, a 22.24 kN force sensor and a data acquisition system to acquire the contact force-time history. The impactor has a semi-cylinderical tip with 12 mm diameter. The testing
CBÜ Fen Bil. Dergi., Cilt 12, Sayı 1, 27-37 s CBU J. of Sci., Volume 12, Issue 1, p 27-37
29 machine and impactor assumed to be perfectly rigid. Fig.1 schematically shows the testing set up.
The force signals produced by the sensor are in mili-volts and first amplified by a signal processor and then transmitted to the data acquisition card within a PC. The variations of interaction force between the impactor and the sample versus time were obtained by using NI Signal Express software.
Figure 1 Impact test stand
2.3 Testing Procedure
The height and mass of the impactor was varied in order to obtain various impact energies. The tests were done by using two different masses as 13 kg and 6.5 kg in order to obtain the effect of dropping mass. The impact velocities were selected in such a way that different dropping masses result in same impact energies. So the effect of dropping mass and impact velocity become clear. The tests were con-ducted for three different velocities and separately repeated three times. The used test parameters are presented in Table 3.
Table 3 Test parameters
Dropping mass (kg)
Initial strike velocity (m/sec)
13 1 1.25 1.5
6.35 1.44 1.8 2.16
Impact Energy (J) 6.5 10.2 14.6
The data acquisition system can transmit 10.000 data pairs per second. Newton’s second law of motion can be used to express the acceleration as in Eq.(1). Here
a, F and m represents acceleration, force and mass
respectively while i represents each successive data points.
m
F
a
ii
(1)It is reported that the acceleration can be expressed as linear functions of time as follows [27].
c
t
k
t
a
(
)
.
(2) Where 1 1
i i i it
t
a
a
k
(3) 1 1 1
i i i i i it
t
a
t
a
t
c
(4)in which the coefficients k and c should be deter-mined for successive data points. The velocities and the displacements were obtained by the integration of the following equations over a time step which has been defined by successive data points.
i i i i t t v vdt
t
a
dv
dt
t
a
dv
1 1)
(
)
(
(5)
i i i i t t s sdt
t
v
ds
dt
t
v
ds
1 1)
(
)
(
(6)The impulse force and absorbed energy can be de-fined as follows. Here, J, W and tf represents impulse force, absorbed energy and interaction time.
f t dt F J 0 .(7)
)
(
2
1
2 2 final initialv
v
m
W
(8)
When the impactor first hits the material, the kinetic energy of the impactor is partly transferred to the material. The remaining kinetic energy is used for rebound which makes the impactor rise. This process continues until the kinetic energy of the impactor is fully consumed. During this process the material is subjected to 12-15 impacts. However it is concluded that first 5 impacts transfer great majority of the ki-netic energy of the impactor to the material and damage forms at this period.
The specimens were tested under simply supported boundary condition in which two opposite sides are supported while the other two sides were free. So the
CBÜ Fen Bil. Dergi., Cilt 12, Sayı 1, 27-37 s CBU J. of Sci., Volume 12, Issue 1, p 27-37
30 specimens can show free angular deformation and vertical deflection.
3 Results and Discussions
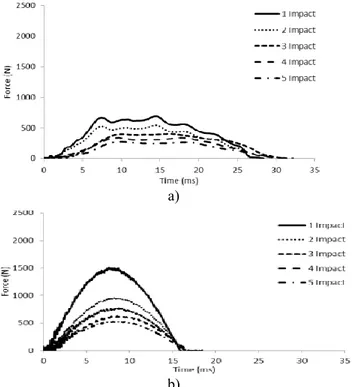
Figs. 2-4 show the variation of impact force versus interaction time. As seen in these figures as the im-pact velocity increased imim-pact forces increase. When the first impact occurs some of the initial impact energy is transferred to the material and impactor rebounds. This process creates successive impacts and continues until initial energy of impactor is fully consumed. It is seen in Figs. 2-4 that forces at each successive impact decreases.
It is seen in Figs. 2-4 that the impact force increases with increasing impact energy. However, though the same impact energy applied the higher impact veloc-ities resulted in higher impact forces. It is also seen in Figs. 2-4 that for the same impact energy, the interac-tion time for small dropping mass is smaller than that of bigger dropping mass. Besides it is concluded that the bigger mass creates some oscillations at force-time variation.
a)
b)
Figure 2 Variation of impact force with interaction time for impact energy of 6.5 J a) dropping mass=13kg, initial impact velocity= 1m/s, b) drop-ping mass=6.35kg, initial impact velocity=1.44 m/s
a)
b)
Figure 3 Variation of impact force with interaction time for impact energy of 10.2 J a) dropping mass=13kg, initial impact velocity= 1.25m/s, b) drop-ping mass=6.35kg, initial impact velocity=1.8 m/s
a)
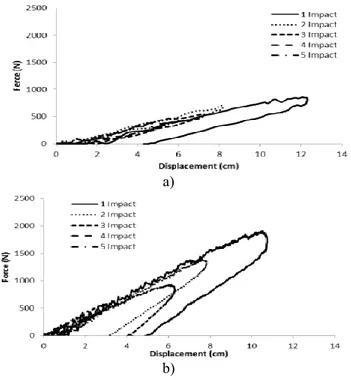
b) Figure 4 Variation of impact force with interaction time for impact energy of 14.6 J a) dropping mass=13kg, initial impact velocity= 1.5m/s, b) drop-ping mass=6.35kg, initial impact velocity=2.16 m/s Figs. 5-7 show the variation of vertical displacement versus impact load for different levels of impact
en-CBÜ Fen Bil. Dergi., Cilt 12, Sayı 1, 27-37 s CBU J. of Sci., Volume 12, Issue 1, p 27-37
31 ergy. As seen in these figures considerable energy consumption occurs at each successive impact. How-ever latter impacts consume less energy than former impacts do. It is also seen that as the level of impact energy increased the vertical displacement of materi-al increased. It is materi-also worth noting that the same energy levels obtained by different parameters creat-ed similar vertical displacements.
a)
b)
Figure 5 Variation of impact force with deflection for impact energy of 6.5 J a) dropping mass=13kg, initial impact velocity= 1m/s, b) dropping mass=6.35kg, initial impact velocity=1.44 m/s
a)
b)
Figure 6 Variation of impact force with deflection for impact energy of 10.2 J a) dropping mass=13kg, ini-tial impact velocity= 1.25m/s, b) dropping mass=6.35kg, initial impact velocity=1.8 m/s
a)
b)
Figure 7 Variation of impact force with deflection for impact energy of 14.6 J a) dropping mass=13kg, ini-tial impact velocity= 1.5m/s, b) dropping mass=6.35kg, initial impact velocity=2.16 m/s
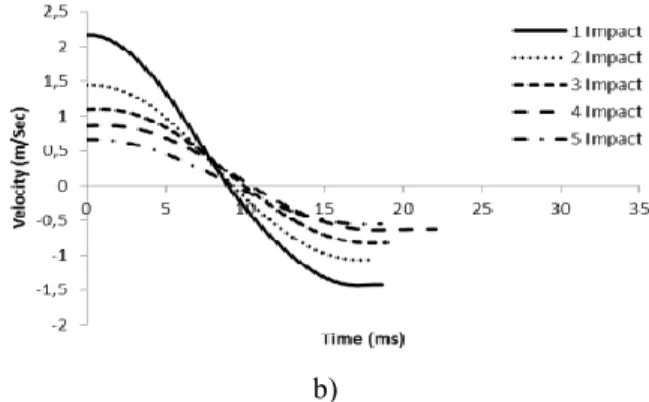
Figs. 8-10 show the variation of impactor’s velocity during interaction for different levels of impact ener-gy. As seen in this figure each impact starts from a specific velocity and decreases to zero. After that point the impactor reverses and has a negative veloc-ity and creates rebound. The initial velocveloc-ity of next impact is the final velocity of previous impact. This situation continues until initial kinetic energy of the impactor fully consumed.
CBÜ Fen Bil. Dergi., Cilt 12, Sayı 1, 27-37 s CBU J. of Sci., Volume 12, Issue 1, p 27-37
32 b)
Figure 8 Variation of velocity with time for impact energy of 6.5 J a) dropping mass=13kg, initial impact velocity= 1m/s, b) dropping mass=6.35kg, initial im-pact velocity=1.44 m/s
a)
b)
Figure 9 Variation of velocity with time for impact energy of 10.2 J a) dropping mass=13kg, initial im-pact velocity=1.25m/s, b) dropping mass=6.35kg, initial impact velocity=1.8 m/s
a)
b)
Figure 10 Variation of velocity with time for impact energy of 14.6 J a) dropping mass=13kg, initial im-pact velocity=1.5m/s, b) dropping mass=6.35kg, ini-tial impact velocity=2.16 m/s
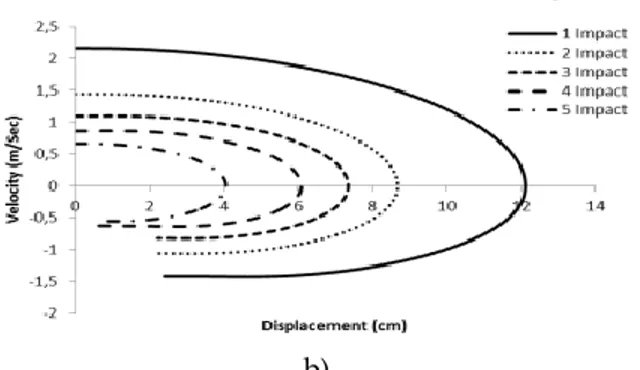
Figs. 11-13 show the variation of impactor velocity versus vertical displacement of material for different levels of impact energy. As seen in these figures as the impactor moves down the velocity decreases and then the displacement reaches its maximum when the velocity reaches to zero. After that point the ve-locity started to increase in negative direction while the displacement decreases and rebound starts. This situation is similar for all impacts. At the first impact some of initial kinetic energy is transferred to the material. So the impactor never reaches its initial height at the latter impacts. So velocities of each suc-cessive impact are lower than former impacts as seen in Figs. 11-13. It is also seen in these figures that as the initial impact energy increased the vertical dis-placements increases.
CBÜ Fen Bil. Dergi., Cilt 12, Sayı 1, 27-37 s CBU J. of Sci., Volume 12, Issue 1, p 27-37
33 b)
Figure 11 Variation of velocity with deflection for impact energy of 6.5 J a) dropping mass=13kg, initial impact velocity=1m/s, b) dropping mass=6.35kg, initial impact velocity=1.44 m/s
a)
b)
Figure 12 Variation of velocity with deflection for impact energy of 10.2 J a) dropping mass=13kg, initial impact velocity=1.25m/s, b) dropping mass=6.35kg, initial impact velocity=1.8 m/s
a)
b)
Figure 13 Variation of velocity with deflection for impact energy of 14.6 J a) dropping mass=13kg, ini-tial impact velocity=1.5m/s, b) dropping mass=6.35kg, initial impact velocity=2.16 m/s
Figure 14 shows the variation of impulse force for first 5 impacts under different dropping masses. It is seen in this figure that as the impact energy level increased the impulse force increases. Besides it is seen that as the energy level increased the effect of impact velocity upon impulse force become effective at the first three impacts.
a)
b)
c)
Figure 14 Variation of impulse force at the successive
0 5 10 15 20 25 1. Impact 2.Impact 3. Impact 4. Impact 5. Impact Impuls (N.S) 1.44 m/s 1 m/s 0 5 10 15 20 25 1. Impact 2.Impact 3. Impact 4. Impact 5. Impact Impuls (N.S) 1.8 m/s 1.25 m/s 0 5 10 15 20 25 1. Impact 2.Impact 3. Impact 4. Impact 5. Impact Impuls (N.S) 2.16 m/s 1.5 m/s
CBÜ Fen Bil. Dergi., Cilt 12, Sayı 1, 27-37 s CBU J. of Sci., Volume 12, Issue 1, p 27-37
34 impacts a) Impact energy level: 6.5 J, b) Impact energy level: 10.2J c) Impact energy level: 14.6 J
Figure 15 shows the variation of energy absorption rate at each successive impact for different impact energy levels. As seen in this figure, the kinetic ener-gy of small mass is absorbed more than that of big mass. It is seen that approximately 55-70% of initial kinetic energy of small dropping mass is absorbed at the first impact while 20% of initial kinetic energy of big dropping mass is absorbed. The energy absorp-tion rate decreases dramatically at the successive impacts.
a)
b)
c)
Figure 15 Variation of energy absorption rate at the suc-cessive impacts a) Initial impact energy level: 6.5 J, b) Initial impact energy level: 10.2J c) Initial impact energy level: 14.6 J
Table 4 summarizes the peak forces, maximum verti-cal displacements and interaction times for impacts test performed under different dropping masses and impact velocities. As seen in this table small
drop-ping mass results in small interaction times. So the peak impact forces of small mass are bigger than that of big mass. On the other hand big mass results in larger displacements. It is also seen that as the im-pact velocity increased peak vertical displacements increase.
Table 4 The peak force, peak displacement and inter-action time for different strike velocities
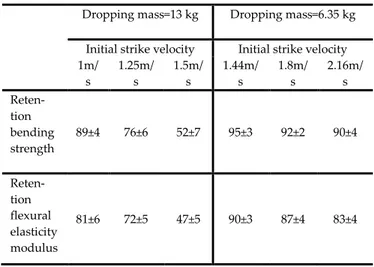
The retention mechanical properties of impacted composite materials were obtained by three point bending test with feed rate of 5 mm/min. Table 5 shows the retention properties. As seen in this table, both retention bending strength and retention bend-ing elasticity modulus decreased with increasbend-ing strike velocity. The retention bending strength and
flexural modulus show the same behavior in case of dropping mass of 6.35 kg. However this decrease is small in comparison with decrease observed in spec-imens tested by 13 kg.
Table 5 Retention mechanical properties after low velocity impact Dropping Mass (kg) Initial strike velocity (m/s) Peak force (N) Interaction time (sec) Peak dis-placement (m) 13 1 712±5 0.0284±7 0.015835±4 1.25 734±6 0.0284±5 0.022092±3 1.50 915±8 0.0290±3 0.027441±5 6.35 1.44 1509±5 0.0175±6 0.009853±5 1.8 1910±5 0.0192±5 0.014116±4 2.16 2317±6 0.0190±6 0.014676±6
4 Damage Assessments
0 20 40 60 80 1. Impact 2.Impact 3. Impact 4. Impact 5. ImpactEnergy absorption rate (%)
1.44 m/s 1 m/s 0 20 40 60 80 1. Impact 2.Impact 3. Impact 4. Impact 5. Impact
Energy absorption rate (%)
1.8 m/s 1.25 m/s 0 20 40 60 80 1. Impact 2.Impact 3. Impact 4. Impact 5. Impact
Energy absorption rate (%)
2.16 m/s 1.5 m/s
Dropping mass=13 kg Dropping mass=6.35 kg Initial strike velocity Initial strike velocity 1m/ s 1.25m/ s 1.5m/ s 1.44m/ s 1.8m/ s 2.16m/ s Reten-tion bending strength 89±4 76±6 52±7 95±3 92±2 90±4 Reten-tion flexural elasticity modulus 81±6 72±5 47±5 90±3 87±4 83±4
CBÜ Fen Bil. Dergi., Cilt 12, Sayı 1, 27-37 s CBU J. of Sci., Volume 12, Issue 1, p 27-37
35 The kinetic energy of the impactor is used for for-mation of damage types such as fiber/matrix break-age, fiber pull-out, fiber breakage and delamination. Depending on kinetic energy of the
impactor one or more types of damages can form within composite material.
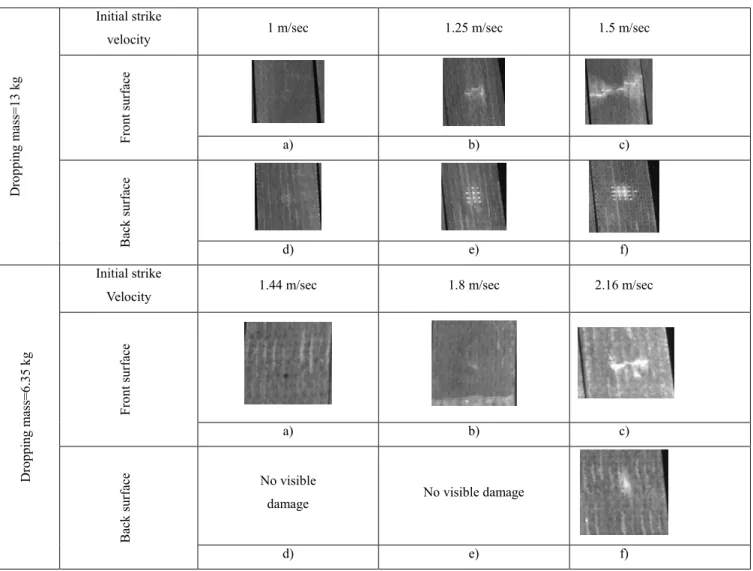
Table 6 contains images captured by laser scanner and shows the damage formed at the front and back surfaces of the material. As seen in this figure, for the dropping mass of 13 kg, as the strike velocity in-creases the damage on both front and back surfaces increases and the debonded regions increases in size. It is also seen that strike velocity of 1 m/s creates only matrix cracking. However, as the strike velocity in-creased the damage forms not only as matrix crack-ing but also as delamination and fiber debondcrack-ing. The material still keeps its structural integrity and keeps some load carrying capacity, since the fibers have not broken. It is concluded that the damage formed on the front surfaces are mainly as a result of
impact force induced indentation and bending effect while the damage formed on the back surface is as a result of indentation.
Table 6 Front and back surfaces of the material after
impact under different strike velocities (1.6X)
The impactors with different masses produce the same impact energy. However, the dropping mass of 6.35 kg created much less damage. The impact with strike velocities of 1.44 m/s and 1.8 m/s created only matrix cracking on the front surface and a small in-dentation while almost no damage has formed on the back surface. The impact with strike velocity of 2.16 m/s created a small delaminated zone in addition with matrix cracking on the front surface. However, debonding of a fiber bundle is seen on the back sur-face of the specimen.
5 Conclusions
The low velocity impact behavior and retention me-chanical properties of E-glass reinforced epoxy
lami-Dro pp in g m ass = 13 k g Initial strike
velocity 1 m/sec 1.25 m/sec 1.5 m/sec
F ro nt su rfa ce a) b) c) Ba ck su rfa ce d) e) f) Dro pp in g m ass = 6. 35 k g Initial strike
Velocity 1.44 m/sec 1.8 m/sec 2.16 m/sec
F ro nt su rfa ce a) b) c) Ba ck su rfa ce No visible
damage No visible damage
CBÜ Fen Bil. Dergi., Cilt 12, Sayı 1, 27-37 s CBU J. of Sci., Volume 12, Issue 1, p 27-37
36 nates under successive impacts have been investigat-ed. Two different dropping masses were usinvestigat-ed. The retention mechanical properties were determined by three point bending test performed after low velocity impact.
The kinetic energy of the impactor is consumed by successive impacts. It is observed that the latter im-pacts absorb lower energy than the former imim-pacts do.
It is concluded that for the dropping mass of 6.35 kg, great majority of impact energy is consumed at the first impact. However, for the dropping mass of 13 kg this situation is not true.
The damage increases with increased strike velocity. It is concluded that damage preliminarily occurs as a combination of matrix cracking and fiber debonding and while the strike velocity increased matrix crack-ing and debondcrack-ing is followed by delamination.
Considerable mechanical degradation was observed after impact testing. The mechanical tests showed that increased strike velocity resulted in more de-crease in mechanical properties which is mainly due to the formation of fiber debonding and delamina-tion. However, small dropping mass created much less damage on both surfaces of the specimens which causes much less mechanical degradation.
It is concluded that, when the test specimens were impacted by a heavy mass damage within specimens mainly consists of heavy forms of damage such as fiber breakage and delamination. As a result of these damage formations a great loss in load bearing ca-pasity and bending stiffness can be encountered. However, as a result of impact by a small mass, the contact forces are generally not high enough to breake the fibers and/or create delamination and the whole kinetic energy consumed mainly by matrix cracking which does not result in greate decrease in mechanical properties since these properties con-trolled by fibers.
6 Funding
This research received no specific grant from any funding agency in the public, commercial, or not-for-profit sectors.
7 Referanslar
[1] Abrate, S. Impact on laminated composite materi-als. Appl Mech Rev., 1991; 4, 155–90.
[2] Caprino, G. Residual strength prediction of
im-pacted CFRP laminates. Compos Mater.; 1984: 18, 508–18.
[3] Davies, G.A.O., Hitchings, D., Zhou, G. Impact damage and residual strengths of woven fabric glass/polyester laminates. Compos Part A: Appl Sci Manuf., 1996: 27A, 1147–56.
[4] Cantwell, W.J., Morton, J. Comparison of the low and high velocity impact response of CFRP. Compo-sites, 1989: 20, 545–51.
[5] Ramkumar, R.L., Chen, P.C. Low velocity impact response of laminated plates. AIAA Journal, 1982; 21, 1448-1452.
[6] Abatan, A., Hu, H., Olowokere, D. Impact re-sistance modeling of hybrid laminated composites. J Thermoplastic Comp Mater., 1998; 11, 249-260. [7] Goo, N.S., Kim, S.J. Dynamic contact analysis of laminated composite plates under low velocity im-pact. AIAA Journal., 1997; 35, 1518-1521.
[8] Liu, D., Raju, B.B., Dang, X. Size effects on impact response of composite laminates. Int J Impact Eng., 1998; 21, 837–854.
[9] Zhou, G. Damage resistance and tolerance in thick laminated composite plates subjected to low-velocity impact. Key Eng Mater., 1998: 305, 141-143. [10] Cantwell, W., Curtis, P., Morton, J. Post-impact fatigue performance of carbon fibre laminates with non-woven and mixed-woven layers. Composites, 1983; 14, 301–305.
[11] Mahfuz, H., Saha, M., Biggs, R., Jeelani, S. Dam-age tolerance of resin infiltrated composites under low velocity impact—experimental and numerical studies. Key Eng Mater. 1998; 141, 209–234.
[12] Foreign object impact damage to composites. ASTM STP 568.Philadelphia: ASTM; 1975, p. 159. [13] Williams, J.G., Rhodes, M.D. Composite materi-als; testing and design. Proceedings of Sixth confer-ence. ASTM STP 787, Philadelphia: ASTM; 1982, p. 450–480.
[14] Takeda, N., Sierakowski, R.L., Ross, C.A., Mal-vern, L.E. Delamination crack propagation studies of ballistically impacted glass/epoxy composite lami-nates. Exp Mech., 1982; 22, 19–25.
[15] Christoforou, A.P., Yigit, A.S. Effect of flexibility on low impact in composite plates. J Sound Vib, 1998; 217, 563–578.
[16] Cantwell, W.J., Morton, J. The impact resistance of composite materials––a review. Composites, 1991; 22, 347–62.
[17] Liu, S., Chang, F.K. Matrix cracking effect on delamination growth in composite laminates
in-CBÜ Fen Bil. Dergi., Cilt 12, Sayı 1, 27-37 s CBU J. of Sci., Volume 12, Issue 1, p 27-37
37 duced by a spherical indenter. J Comp Mater, 1994; 28, 940–971.
[18] Salpekar, S.A. Analysis of delamination in cross-ply laminates initiating from impact-induced matrix cracking. J Compos Technol Res, 1993; 15, 88–94. [19] Meyers, M.A. Dynamic behavior of materials. New York: John Wiley and Sons; 1994. Chapter 2, P. 23–65.
[20] Belingardi, G., Cavatorta, M.P., Paolino, D.S. Repeated impact response of hand layup and vacu-um infusion thick glass reinforced laminates. Int J Impact Eng., 2008; 15, 609–619.
[21] Belingardi, G., Cavatorta, M.P., Paolino, D.S. On the rate of growth and extent of the steady damage accumulation phase in repeated impact tests. Com-pos Sci Tech.,, 2009; 69, 1693–1698.
[22] Baucom, J.N., Zikry, M.A. Low-velocity impact damage progression in woven E-glass composite systems. Composites Part A, 2005; 36, 658–664. [23] Baucom, J.N., Zikry, M.A., Rajendran, A.M. Low-velocity impact damage accumulation in woven S2-glass composite systems. Compos Sci Techn., 2006; 66, 1229–1238.
[24] Morais, W.A., Monteiro, S.N. D’Almeida, J.R.M. Effect of the laminate thickness on the composite strength to repeated low energy impacts. Compos Struct., 2005; 70, 223–228.
[25] Hosur, M.V., Karim, M.R. Jeelani, S. Experi-mental investigations on the response of stitched/unstitched woven S2-glass/SC15 epoxy composites under single and repeated low velocity impact loading. Compos Struct., 2003; 61, 89–102. [26] Mouritz, A.P., Gallaghef, J., Goodwin, A.A. Flexural Strength and Interlaminar Shear Strength of Stitched GRP Laminates Following Repeated Im-pacts. Comp Sci Techn., 1997; 57, 509-522.
[27] Uyaner, M., Kara, M. Dynamic response of lami-nated composites subjected to low-velocity impact. J Comp. Mat., 2007; 41, 2877-2896.