69 Cilt 1, Sayı 2 | Kış 2017
Volume 1, No. 2 | Winter 2017, 69-76 OPTIMIZATION OF ELECTRICAL CHARGING STATION CAPACITY
Abdulgader ALSHARIF1, Wamidh MAZHER2, Osman Nuri UÇAN3, Oğuz BAYAT4 1-2-3-4 Faculty of Engineering and Natural Sciences, Altınbaş Üniversitesi-Turkey,
[email protected] , [email protected] , [email protected] , [email protected]
Abstract
Electrical vehicle charging Station (EVCS) is a new system that used as a petrol station to get the optimization method for the Electric Vehicle Charge Station by finding the capacity of using mathematical models. It is de-signed to organize some of tools that are used to count the costs such as PVs, Battery Banks, Transmission lines and Electric vehicles (EVs). The system analysis charging via main grid and Photovoltaic to charge different types of cars depending on some of international standard critical points.
Keywords: Mathematical Model, PVs model, EVs, Battery Bank, Electricity grid, solar irradiance, Optimization.
ELEKTRİK ŞARF İSTASYON KAPASİTELERİNİN OPTİMİZASYONU Özet
Elektrikli araç şarj istasyonu (EVCS), benzin istasyonu olarak kullanılan, elektrikli Araç Ücret İstasyonu için optimi-zasyon metodunu elde etmek için matematiksel modellerle kullanma kapasitesini bulan yeni bir sistemdir. PV’ler, Akü Bankaları, İletim hatları ve Elektrikli araçlar (EV’ler) gibi ürünlerin maliyetleri bulmak için tasarlanmıştır. Ana şebekeden ve Fotovoltaik’den farklı araç tiplerini şarj etmek için yapılan sistem analizi, bazı uluslararası standart kritik noktalara bağlıdır.
Anahtar Kelimeler: PV model, EVs, Güneş ışıması, Matematik modelleme,optimizasyon
1. INTRODUCTION
One of the problem that facing costumers and car drivers to customize the cost of the electricity bills by using alternative approaches such as alternative energy (solar system) [1], this paper proposes a mat-hematical model [2] to find the total cost of the electric vehicles charge stations (EVCS) that using vari-ous number of cars such as listed in [3] and different types of batteries [4] by implementing the optimi-zation result for the designed system that presented in fig.1. and get the result which will be presented later in results and discussion section according to the solar irradiance [5], the location that determine the price of electricity
70
This system consists of some of the main kits such as solar panels, Batteries, Electric grid and the main pub-lic park that has the Electric Vehicles Charge Station (EVCS) that located the tracking of cars, respectively. Each section in this paper is concentrated in specific point, in section I presented the introduction which presented the main purpose of the paper and some of the literature review for the related studies in the same area for EVCS, section II presented the proposal work which illustrated fig.1, section III translated the presented graph in mathematical forms, section III presented the Mathematical modelling for the math equations, IV replaced the sun irradiance data with some details, V section illustrated the final re-sult using Matlab R2017a version.
Last section for the conclusion of the obtained result for the different graphs for the cells, batteries, grid, solar irradiance, respectively.
1.1 The proposal works
The below diagram presented the main work which has proposed in this paper, each section has its own details to be presented for each one, will see the tables and texts.
introduction which presented the main purpose of the paper and some of the literature review
for the related studies in the same area for EVCS, section II presented the proposal work
which illustrated fig.1, section III translated the presented graph in mathematical forms,
section III presented the Mathematical modelling for the math equations, IV replaced the sun
irradiance data with some details, V section illustrated the final result using Matlab R2017a
version.
Last section for the conclusion of the obtained result for the different graphs for the cells,
batteries, grid, solar irradiance, respectively.
I. The proposal works
The below diagram presented the main work which has proposed in this paper, each section
has its own details to be presented for each one, will see the tables and texts.
Fig.1 Diagram of EVCS System Design.
First part is solar panels, there are many types of the solar panels as 3 types:
1. Monocrystalline silicon.
2. Polycrystalline (or multi-crystalline).
3. Amorphous/thin film.
In addition, for more details to the mathematical calculation for each type to obtain the
number of watts that produced, we can refer to it in [7] in section XII that named under peak
sun hours.
The second part is the battery that defined as the electrochemical device which convert
chemical energy into electrical energy or vice versa, there are many types of battery those
could use for electric vehicles as presented in the table below.
Table that listed the battery types with its costs and the life cycle of each type, this work has
taken the type of Nickel–cadmium battery (NiCad).
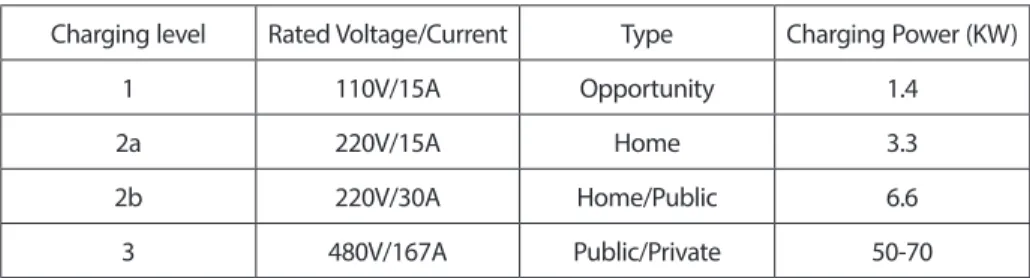
Table 1 as its name has mentioned is charging power levels for the Electric Vehicles (EVs)
that can be charged in many places or areas such (home, public, privet) most of the Electric
Vehicles are charged under the third type which is 2b that rated under voltage 220 V and
current 30 A that using power of charging 6.6 kw.
Figure 1. Diagram of EVCS System Design.
First part is solar panels, there are many types of the solar panels as 3 types: 1. Monocrystalline silicon.
2. Polycrystalline (or multi-crystalline). 3. Amorphous/thin film.
In addition, for more details to the mathematical calculation for each type to obtain the number of watts that produced, we can refer to it in [7] in section XII that named under peak sun hours.
The second part is the battery that defined as the electrochemical device which convert chemical energy into electrical energy or vice versa, there are many types of battery those could use for electric vehicles as presented in the table below.
Table that listed the battery types with its costs and the life cycle of each type, this work has taken the type of Nickel–cadmium battery (NiCad).
71 Table 1 as its name has mentioned is charging power levels for the Electric Vehicles (EVs) that can be
charged in many places or areas such (home, public, privet) most of the Electric Vehicles are charged un-der the third type which is 2b that rated unun-der voltage 220 V and current 30 A that using power of char-ging 6.6 kw.
Table 1. Charging Power Levels
Charging level Rated Voltage/Current Type Charging Power (KW)
1 110V/15A Opportunity 1.4
2a 220V/15A Home 3.3
2b 220V/30A Home/Public 6.6
3 480V/167A Public/Private 50-70
1.2 The Mathematical Equation
The main process of using mathematical expressions to describe a real quantitative situation which cal-led modeling. Modeling consists of writing in mathematical terms what is first expressed in words [6], the main equation which we have used in this work as illustrated below in equation (1)
,
( cartotal) m m cari j
i j
EVCS P =
∑∑
P(1)
car S S B B G G
P
=
u P u P u P
+
+
(2)When EVCS P( cartotal) refers to the total cost of number of electric vehicle ( ) in the park with different types of cars as they have listed in the track as those illustrated in the matrix, The double sum nation ( ,i j
m m
car i j
P
∑∑
) with number of rows and columns ( ) that refers to the loss cost of charge sta-tion and (m) refers to the number of cars in charging stasta-tions or in another term is the tracking. The above equation (2) is translated to equation (1) that take us deeply and give more specific explana-tion for the main one1.3 Solar irradiance
Which we can define the solar irradiance as the sun delivers energy to the earth by means of electro-magnetic radiation. For our purposes we can assume that the radiation flows evenly distributed from a surface which is close to spherical as presented for the full worldwide map. The sunlight covers a broad range of wavelengths from roughly 250 nm (UV) over the visible range (400-700 nm) [8].
72
1.4 Result and Discussion
To find the optimum number of cells, we set the number of cars (C) at each 3 tracks, each one as presen-ted 10:2:22 which means 20 cars per track and the power level charging for each track 1, 2 and 3 are (3 6 18) as a common power levels for different types of EVs that illustrated in the figure 13 below, where its measuring unit in kw. Therefore, the total power (P_c_T) that required from the EVCS has been sum (c*(P_level)) that have taken from [9] when the power cell(P_S) = 0.1 kw, therefore the number of cells have been counted to find the optimum number of cell by the equation (3), the meaning of MATLAB comment ceil is to Round toward positive infinity that showed as open bracket [10], the following data in table is needed.
_ _
_
_
P C T
No Cell
P S
=
(3) 0.1 0.2 0.3 0.4 0.5 0.6 0.7 0.8 0.9 1 irradiance 0 1 2 3 4 5 6Total cells in EVCS
104 Cells & Irradiance
270 Kw 324 Kw 378 Kw 432 Kw 486 Kw 540 Kw 594 Kw
Figure 3. The Number of Cells Required for Different Power Utilities with Respect to Sun Irradiance Range.
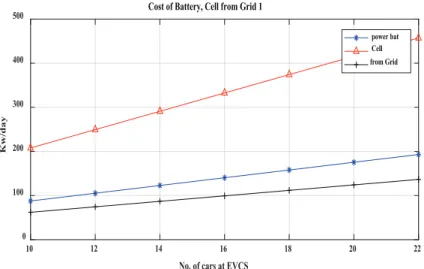
The next graph has present the linearity between the number of solar panels and number of vehicles in the park in 3 tracking as assumed in this work with the electricity price also can be vary, which has con-sidered when solar panel cell equal to 110 W, irradiance (0.1 0.3 0.5 0.7 0.9), electricity price is 10 $kw/h, which has increased and the mathematical equation obtained this result is (4).
73
10 12 14 16 18 20 22
No. of cars at EVCS
0 100 200 300 400 500 Kw/day
Cost of Battery, Cell from Grid 1
power bat Cell from Grid
Figure 4. Cost of Battery & Cell from Grid 1 (case 1)
Based on the price of electricity grid in 10$ kw/h for the specific location that located in U.S, we obtained figure 5 from the equation (5) which has illustrated the 2 lines those seemed to be liner, according to the cost of the electricity cost we can justify our result which means can be vary from the table that presen-ted in table 6, in this work we obtained the three results such as the power of battery, solar panels and the line that presented the electricity that came from the electricity grid, respectively.
_
_
_
_
_
_
_
_
_ _
&
_ _
Total Cost Cell Bat day
Total Cost Cell Bat Kwh
set P Cell
set P B
=
∑
(5)No. of cars at ECV
10 12 14 16 18 20 22 $ Kw/day 0 200 400 600 800 1000 1200
1400 based on 10 $Kwh for the Grid
Cell + battery Grad
74
Therefore, the chart bar 6 below is obtained by considering on the distribution of the peak load of the electric vehicle charge station (EVCS) for only one day for 24 hours which shows that the peak load time at 2 PM for that vehicles need to charge which is changeable, that means when will change the values depends on the price of solar panels and the run hours that need vehicles to be charged, the 5 loads for 24 hours started from 12 AM to 12 AM multiplied to the maximum peak load for the day to obtain the right peak load that needed vehicles to be charged.
Distribuation for EVCS for 1 Day
0 5 10 15 20 24 Hours 0 0.1 0.2 0.3 0.4 0.5 0.6 0.7 0.8 0.9 1
Peak Load for EVCS
Figure 6. Char Bar for The Distribution of EVCS Load for 1 Day.
The measured cost in kwh for Battery has been cost as presented in the following equation (6) with the table 2 that presented the input parameters.
(
)
os _ _
* _ *365
one piece C t of Battery
dutcycale Power Bat
=
(6)
Table 2. Data for Nickel–Cadmium Battery (NiCad)
Input Parameters for Battery Details
Cost of Battery $250 one peace
Power of Battery 0.5 kw based life cycle
Discharging time 1 hour
Charging time 2 hours
75 2. CONCLUSION
To summaries that, Solar irradiance is not constant, figure2 figured out the world solar irradiance map, which depends on the location and season, in our system we have concentrating on the them as an ave-rage for all which was between 0.1-1, the result that presented in figure 3 is presented the value of solar panel output which is 110 w and the range that assumed to be for irradiance as they presented in series 270 324 378 432 486 540 594 in kw with power level of charging in kw for different number of vehicles which can be vary nit constant. The obtained result as in figure 7 is presented the average of the battery sizes, consequently we reach to this result in EV that types under Tesla ROAD STEER is the biggest size of the vehicles types which has got from the chart. In chart that presented in [11] & table 6 has listed the prices of the countries, respectively. According to the price in U.S which defined as 10 $kwh obtained the result. Figures 4&5 the two case1,2 respectively are the cost of battery with solar panels cell which illustra-ted two linear [12]. Figure 6 the chart bar presenillustra-ted the distribution peak load for EVCS for one day only, which seems to be presented the peak load that electric vehicles needs to be charged that consider a bat-tery cost in 250 $ for the one piece of Nickel–cadmium batbat-tery type which can be vary with other types and the main time of charging is almost 2 hours and the main time of discharging is 1 hour by default. 3. REFERENCES
[1] What are the different types of solar photovoltaic cells?: Types of Solar Photovoltaic Cell, The Re-newable Energy Hub , Retrieved from https://www.reRe-newableenergyhub.co.uk/solar-panels/what- https://www.renewableenergyhub.co.uk/solar-panels/what-are-the-different-types-of-solar-photovoltaic-cells.html
[2] Shaoyun, G., Liang, F. E. N. G., Hong, L., & Long, W. A. N. G. (2012, November). The planning of electric vehicle charging stations in the urban area. In Electric & Mechanical Engineering and Infor-mation Technology (EMEIT) Conference (pp. 1598-1604). Rahimi-Eichi, H., Ojha, U., Baronti, F., & Chow, M. Y. (2013). Battery management system: An overview of its application in the smart grid and elect-ric vehicles. IEEE Industrial Electronics Magazine, 7(2), 4-16.
[3] Ustun, T. S., Zayegh, A., & Ozansoy, C. (2013). Electric vehicle potential in Australia: Its impact on smartgrids. IEEE Industrial Electronics Magazine, 7(4), 15-25.
[4] R. Bailey (2012), Electric Vehicles- Performance of Vehicle Battery Systems, The University of Tennes-see at Chattanooga, Retrieved from https://www.utc.edu/404.php?uri=/college-engineering-com-puter-science/research-centers/cete/electric.php+
[5] Rahimi-Eichi, H., Ojha, U., Baronti, F., & Chow, M. Y. (2013). Battery management system: An over-view of its application in the smart grid and electric vehicles. IEEE Industrial Electronics Magazine, 7(2), 4-16.
[6] MATHEMATICAL MODELLING, mathematic help center, Retrieved from http://www.hec.ca/en/cam/ help/topics/Mathematical_modelling.pdf
76
[7] Alsharif, A., Othman, A., Alsgear, M., Kura, F. Ben, & Mahariq, I. (2017). Utilization of Solar Power in Distributing Substation. International Journal of Electronics and Electrical Engineering, 5(2), 189– 194 https://doi.org/10.18178/ijeee.5.2.189-194.
[8] Rahimi-Eichi, H., Ojha, U., Baronti, F., & Chow, M. (2013). Battery Management System: An Over-view of Its Application in the Smart Grid and Electric Vehicles. Industrial Electronics Magazine, IEEE, 7(June), 4–16. https://doi.org/10.1109/MIE.2013.2250351
[9] Hydro-Québec. (2015). Electric Vehicle Charging Stations, (August). Retrieved from http://www.hydro-quebec.com/data/electrification-transport/pdf/technical-guide.pdf
[10] Ceil. (2017). Retrieved from https://www.mathworks.com/help/matlab/ref/ceil.html?s_tid=srchtitle [11] Dillinger, J. (2017). Cost of Electricity by Country, Retrieved from
http://www.worldatlas.com/artic-les/electricity-rates-around-the-world.html
[12] Qian, K., Zhou, C., Allan, M., & Yuan, Y. (2011). Modeling of load demand due to EV battery char-ging in distribution systems. IEEE Transactions on Power Systems, 26(2), 802-810.