INTRODUCTION
The aerodynamic drag created on the vehicle body is a phenomenon that adversely affects the performance and fuel consumption. As speed in-creases, the rolling resistance remains relatively constant, while the aerodynamic drag increases with the square of the speed. Above a certain speed limit, the aerodynamic drag significantly exceeds the rolling resistance [3, 2, 17]. The aero-dynamic drag Px depends on the air density ρ, the air velocity v, the area of the face S and the drag coefficient Cx and is given by (1):
Px = 0.5 ∙ ρ ∙ ν ∙ S ∙ Cx (1) Minimizing the drag force magnitude is nec-essary to improve the vehicle’s economy and environmental performance during operation
and its dynamic characteristics, i.e. maximum speed and acceleration. The geometric modifica-tions can improve the flow around the car and reduce the turbulence that adversely affects the aerodynamic drag. This is not the only option to improve the aerodynamics of a car. There are also ways of controlling the flow around the ve-hicle by means of continuous or oscillating air blowing [6, 4, 14]. In this work, numerical cal-culations were performed to examine the aero-dynamic drag force created on individual body parts of the high energy efficiency vehicle, spe-cially designed for the Shell Eco-marathon com-petition. The main design assumption was to create a small city vehicle that ensures the low-est possible fuel consumption while maintaining the assumed speed.
Volume 13, Issue 4, December 2019, pages 1–7 https://doi.org/10.12913/22998624/112835
Numerical Analysis of the Influence of Particular Parts of the
High Efficient Electric Vehicle on the Aerodynamic Forces
Zbigniew Czyż
1*, Paweł Karpiński
2, Salih Koçak
31 Polish Air Force University, Aeronautics Faculty, ul. Dywizjonu 303 35, 08-521 Dęblin, Poland
2 Department of Thermodynamics, Fluid Mechanics and Aviation Propulsion Systems, Faculty of Mechanical
Engineering, Lublin University of Technology, Nadbystrzycka 36, 20-618 Lublin, Poland
3 Department of Mechanical Engineering, Faculty of Engineering, Selcuk University, Ardıclı Mahallesi, Ismet
Pasa Cad., 42250 Selcuklu, Konya, Turkey
* Corresponding author’s e-mail: [email protected]
ABSTRACT
The work presents a three-dimensional modeling of air flow around the research object. The purpose of this work was to perform numerical calculations to identify the magnitude of the aerodynamic drag force generated on individual elements of a high energy efficiency vehicle body. This vehicle, specially designed for the Shell Eco-marathon competition, needs to show the lowest possible fuel consumption while maintaining the prescribed speed. Minimizing the drag force at an early designing stage plays an important role here. The calculations were performed using the ANSYS Fluent calculation solver. The result of the conducted research is a description of the velocity and pressure distributions around the tested vehicle as well as an identification of the drag force on the external surfaces of the components and a description of the relationship between them. The work also discusses the dependence of the drag force as a function of speed in the range from 0 to 12 m/s. The influence of the ground on the drag force in the case when the object was immobilized in relation to the walls at the flowing medium, as in a wind tunnel, was investigated. On the basis of the calculations performed, no impact of the ground on the gener-ated drag force magnitude was found.
Keywords: aerodynamics, computational fluid dynamics, drag force, electric vehicle, fluid mechanics.
Research Journal
Accepted: 2019.11.05and aircrafts. This method consists in solving par-tial differenpar-tial equations describing a flow field in a defined computational domain. The solution is temperature, pressure and velocity distributions in a studied area. The advantage of this method is the ability to test any size of vehicles under the defined ambient conditions. Publication [7] is an example of a work in which this method was applied; it discusses the analysis of drag forces generated on the gyroplane’s fuselage for differ-ent angles of attack. This research has shown that the greatest drag force was created on the fuselage and horizontal stabilizers. On the other hand, the CFD engine cooling calculation results presented in [18] show that the geometry of the fuselage has a significant influence on the engine cooling con-ditions. In today’s aerodynamic research, many measurement techniques are used. Currently, a significant trend is a synergy of experimental wind tunnel studies and numerical calculations. An ex-ample of combining an experimental research with numerical techniques is the work [9] showing the results of the gyroplane flow test by means of an alternative method of generating the air flow and a numerical method. Owing to these calculations, the authors explained the relationship between the obtained results of the registered drag force. Numerical studies using Computational Fluid Dy-namics (CFD), unlike experimental tunnel tests, enable to validate the design assumptions already at the design stage and avoid a costly preparation of models or prototypes for experimental tests as the authors of the paper [5] and [8] emphasized. One of the applications of highly developed tools to perform CFD calculations of the flow is to determine the aerodynamic characteristics or to visualize the fields of velocity, pressure and tem-perature around the tested object [12]. From the very beginning of aerodynamic tests, the visual-ization tests were used to understand the occurring phenomena. Particle image velocimetry (PIV) is an alternative to the CFD method and at the same time one of the most common methods, includ-ing the visualization of the flow. This is an optical method used for a qualitative visualization and a
velocity and pressure distributions at the body surface were obtained.
Aerodynamic numerical tests can be verified by comparing the results of calculations with the re-sults of experimental tests performed on the model in the wind tunnel. An example of aerodynamics wind tunnel tests on a vehicle is the research per-formed in the work [16] which uses a simplified model of a vehicle body (Ahmed model).
The reduction of aerodynamic drag in passen-ger and sports cars is achieved by using additional flaps, spoilers and trailing edge on the body. One of such solutions was studied in the paper [15] where the effect of the rear spoiler geometry on the aerodynamic drag of the vehicle body was an-alyzed. Another example is the work [13] which investigated the impact of the shape of the lower part of the chassis on the vehicle’s aerodynamics.
RESEARCH OBJECT
Figure 1 shows a solid model of the research object made in SolidWorks and CATIA V5 [18, 19]. The elements of the model are marked with colors: green – arm, red – wheel cover, gray – wheel, blue – body. The detailed information about the vehicle are given in [1].
Figure 2 shows side and front views of the created solid vehicle model with the geometri-cal dimensions and directions of the global co-ordinate system. The length, height and width of the vehicle is 2,300 mm, 731.5 mm, and 860 mm, respectively.
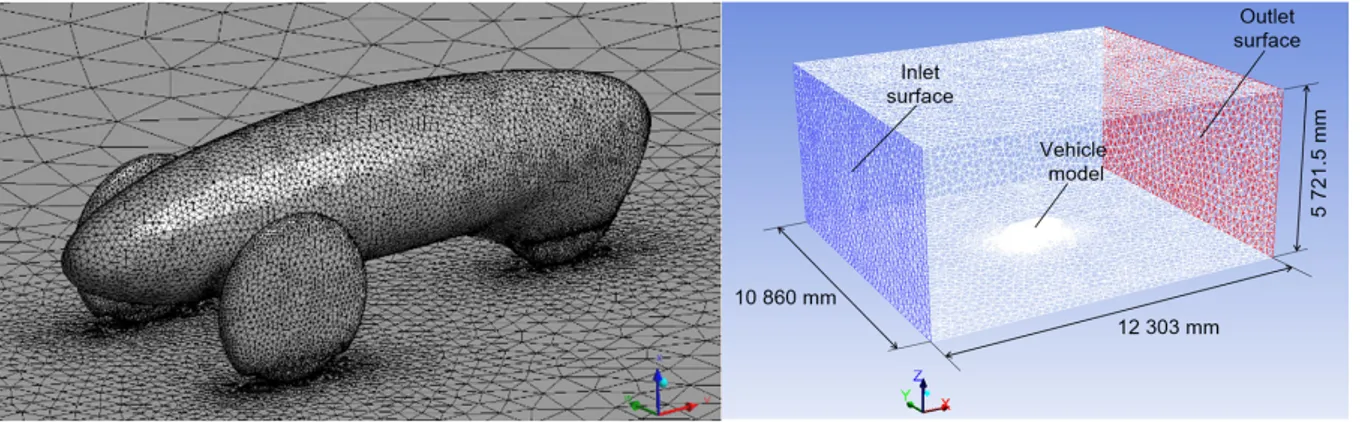
On the basis of the created solid model in the Ansys Fluent program, a mesh of 1,651,517 cells by means of Tetrahedrons (Patch Conforming) was generated (Fig. 3). By the Inflation function, a boundary layer defined for the entire body of the vehicle (38 faces) was created. In addition, the accuracy of the mesh has been improved by means of the functions of face sizing defined on the surface of the vehicle body (2 faces) and edge sizing (6 edges) defined on the edges connecting the body with the wheels.
Figure 3 shows the created computational domain of 12,303×5,721.5×10,860 mm (length ×height×width). The inlet temperature is defined as 288 K.
The type of calculation adopted is pressure-based with the absolute velocity formulation. The calculations were made for the steady-state conditions with an energy equation included.
The k-ω SST model was adopted as a turbu-lence model. It is based on two equations: the first one defines the kinetic energy of turbulence k and the second one a specific dissipation of the kinetic energy of turbulence ω. In addi-tion, the model has a limitation of the princi-pal stress (SST, shear stress transport) [11]. The turbulence scale was defined by two param-eters: turbulent intensity equal to 1% and tur-bulent viscosity ratio equal to 5. The working medium was air treated as ideal gas of defined properties: specific heat cp = 1006.43 J/(kg ∙ K), thermal conductivity k = 0.0242 W/(m ∙ K), dy-namic viscosity η = 1.7894 ∙ 10-5 Pa ∙ s. In the spatial discretization settings, the first order up-wind equations were assumed. A boundary layer consisting of 8 layers and a growth rate equal to 1.15 was created. The size of the cell form-ing the vehicle’s body was set as 25 mm with the face sizing option. In order to investigate the influence of the relative ground speed on the vehicle’s body under boundary conditions, this speed was defined as to equal to air speed. The tests were performed for the air flow velocities equal to: 2, 4, 6, 8, 10 and 12 m/s.
Fig. 2. Side view (left) and front view (right) of the solid vehicle model
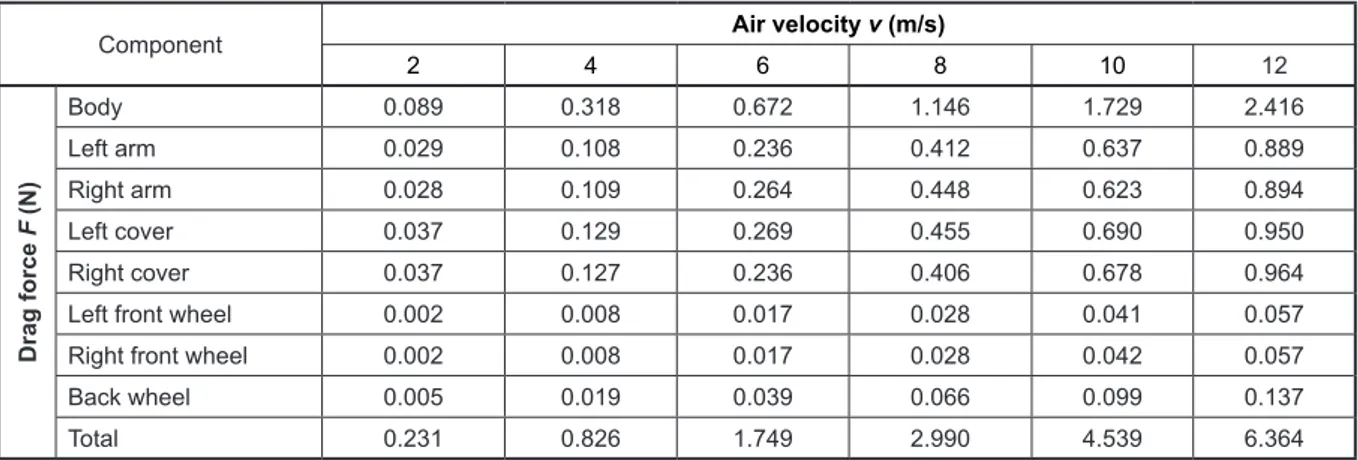
Table 1. The calculated drag force on individual vehicle components for the defined measurement points with the
ground velocity
Component Air velocity v (m/s)
2 4 6 8 10 12 Drag force F (N) Body 0.089 0.318 0.672 1.146 1.729 2.416 Left arm 0.029 0.108 0.236 0.412 0.637 0.889 Right arm 0.028 0.109 0.264 0.448 0.623 0.894 Left cover 0.037 0.129 0.269 0.455 0.690 0.950 Right cover 0.037 0.127 0.236 0.406 0.678 0.964
Left front wheel 0.002 0.008 0.017 0.028 0.041 0.057
Right front wheel 0.002 0.008 0.017 0.028 0.042 0.057
Back wheel 0.005 0.019 0.039 0.066 0.099 0.137
Total 0.231 0.826 1.749 2.990 4.539 6.364
Table 2. The calculated drag force on individual vehicle components for the defined measurement points without
the ground velocity
Component Air velocity v (m/s)
2 4 6 8 10 12 Drag force F (N) Body 0.091 0.324 0.683 1.500 1.752 2.450 Left arm 0.029 0.108 0.236 0.411 0.636 0.899 Right arm 0.029 0.109 0.263 0.382 0.622 0.887 Left cover 0.037 0.128 0.268 0.380 0.688 0.954 Right cover 0.037 0.126 0.236 0.408 0.673 0.943
Left front wheel 0.002 0.007 0.016 0.011 0.038 0.054
Right front wheel 0.002 0.007 0.015 0.011 0.039 0.053
Back wheel 0.004 0.017 0.035 0.040 0.091 0.126
Total 0.230 0.827 1.752 3.142 4.539 6.365
Fig. 4. Pressure contour on the surface of the vehicle model and in the symmetrical plane with (left)
Fig. 5. Velocity contour on the surface of the vehicle model and in the symmetrical plane with (left)
and without (right) the ground velocity for the air velocity v equal to 6 m/s
Fig. 6. Pressure contour on the surface of the vehicle model and in the symmetrical plane with (left)
and without (right) the ground velocity for the air velocity v equal to 12 m/s
Fig. 7. Velocity contour on the surface of the vehicle model and in the symmetrical plane with (left)
and without (right) the ground velocity for the air velocity v equal to 12 m/s
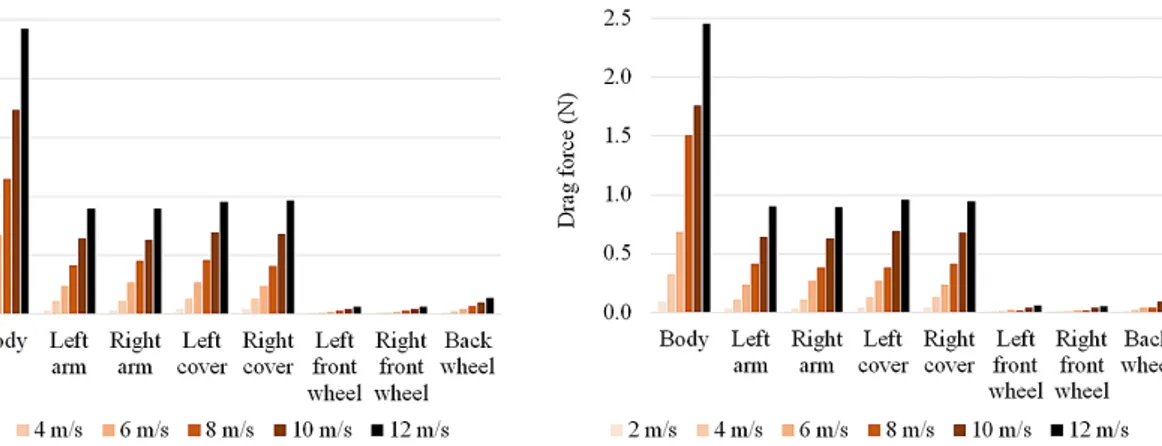
Fig. 8. Drag force generated on the individual vehicle components for the defined air velocity v with (left)
layer has the greatest impact on the drag generated by the vehicle’s wheels. The air flow around the covers and the body is not disturbed by the bound-ary layer due to their considerable distance in rela-tion to the thickness of the formed boundary layer.
Figure 8 shows the magnitude of the drag force acting on the individual vehicle components for the predefined air velocity v with and without the ground velocity. The largest magnitude of the drag force acts on the body for the entire speed range and ranges between 38% and 48% of the total drag force. This is directly related to the area of the face of this element. However, the total drag force from the wheel covers and arms ranges from 50% to 58% of the total drag force, which exceeds the force coming from the body. The aerodynamic drag generated by the wheels is only 2–5% of the total drag force. The differences between the in-dividual drags for the considered cases (with and without the ground velocity) are negligible.
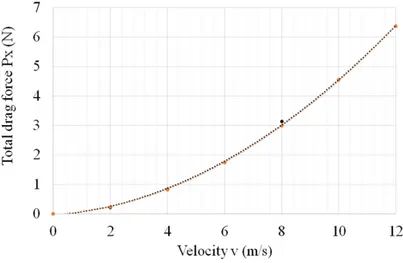
Figure 9 shows the total drag force generated on the vehicle as a function of the air velocity v with and without the ground velocity. The aerody-namic drag increases with the square of the speed. The trend lines were determined for the two data series shown in Figure 9. The equations
CONCLUSIONS
The paper presents an analysis of the aerody-namic drag force acting on a highly efficient elec-tric vehicle as well as examines the influence of the ground on the fields of velocity and pressure around the tested object and the generated air drag force. The drag force magnitudes on the individual ele-ments of the external surface were identified. The differences between the drag forces for the versions with and without the ground velocity are negligible, which confirms that the wind tunnel experiments with a stationary research object are recommended. The relatively high share of drag generated on the vehicle external elements, i.e. left and right arms, left and right covers encourages us to continue the research to optimize the shapes of these elements. In Integrating these elements with the body is con-sidered in the future, which should contribute to reducing the total drag force. The positive pressure behind the body (Fig. 4 and Fig. 6) shows that the air stream that flows along the entire body is not separated. There are no turbulences, which posi-tively affects the aerodynamic performance.
Fig. 9. Total drag force generated on the vehicle as a function of the air velocity v with
REFERENCES
1. Abo-Serie E., Oran E. and Utcu O. Aerodynamics Assessment Using CFD for a Low Drag Shell Eco-Marathon Car. Journal of Thermal Engineering, 3(6), 1527-1536.
2. Barnard R. H. Road Vehicle Aerodynamic Design - An Introduction. Mechaero Publishing, 2001. 3. Bhave A. and Taherian H. Aerodynamics of
Inter-city Bus and Its Impact on CO2 Reductions. Pro-ceedings of the Fourteenth Annual Early Career Technical Conference, 13, 2014, 165-172.
4. Bideaux E. , Bobillier P. , Fournier E. , Gillieron P. , El Hajem M. , Champagne J .Y. , Gilotte P. and Kourta A. Drag reduction by pulsed jets on strong-ly unstructured wake: towards the square back con-trol. Int J Aerodynamics, 1(3/4), 2011, 282-298. 5. Bogdański K., Rodzewicz M. and Ruchała P.
Char-acteristics of locked and free-wheeling ducted fan based on wind tunnel tests and CFD analyses. CEAS Air & Space Conference, 171, 2015, 1-9. 6. Brunn A., Wassen E., Sperber D., Nitsche W. and
Thiele F. Active Drag Control for a Generic Car Mod-el. Active Flow Control. 247-259, Springer, 2007. 7. Czyż Z., Karpiński P., Łusiak T. and Szczepanik
T. Numerical analysis of the influence of particu-lar autogyro parts on the aerodynamic forces. ITM Web of Conferences, 15, 2017, DOI: 10.1051/itm-conf/20171507008.
8. Czyż Z., Łusiak T. and Magryta P. Badania numeryc-zne CFD wpływu usterzenia na charakterystyki aero-dynamiczne. Transactions of the Institute of Aviation – Prace Instytutu Lotnictwa. 232, 2013, 3-14. 9. Czyż Z., Magryta P. and Szlachetka M.,
Experi-mental Investigation of the Impact of Flight Speed on Drag Force in the Autogyro Model. Advances in Science and Technology, Research Journal, 9(26), 2015, 89–95, DOI: 10.12913/22998624/2370. 10. Czyż Z. and Stryczniewicz W. Investigation of
Aerodynamic Interference in a Multirotor by PIV Method. Advances in Science and Technology, Research Journal, 12(1), 2018, 106-114, DOI: 10.12913/22998624/86475.
11. Fluent Inc. FLUENT 13, User’s Guide.
12. Grabowski Ł., Czyż Z. and Kruszczynski K. Nu-merical Analysis of Cooling Effects of a Cylinders in Aircraft SI Engine. SAE Technical Paper, 2014-01-2883, 2014, doi:10.4271/2014-01-2883. 13. Hassan S. R., Islam T., Ali M. and Islam M. Q.
Nu-merical study on aerodynamic drag reduction of rac-ing cars. Procedia Engineerrac-ing,2014, 90, 308–313. 14. Heinemann T., Springer M., Lienhart H.,
Knies-burges S. and Becker S. Active Flow Control on a 1:4 Car Model. Proceedings of the 16th Int. Symp. on Applications of Laser Techniques to Fluid Me-chanics, 2012, 1-11.
15. Hu X. X. and Wong T. T. A Numerical Study On Rear-spoiler Of Passenger VehicleI. World Acade-my of Science, Engineering and Technology. Inter-national Journal of Mechanical and Mechatronics Engineering. 5(9), 2011, 1800-1805.
16. Lienhart H., Stoots C. and Becker S. Flow and Tur-bulence Structures in the Wake of a Simplified Car Model (Ahmed Modell). New Results in Numeri-cal and Experimental Fluid Mechanics III. Notes on Numerical Fluid Mechanics (NNFM), 77, 323-330, Springer, 2002.
17. Lu W. F. , Lim H. W. and Goh K. H. Engineering Design and Education: A Case Study on Design-ing A Competition Fuel Efficient Vehicle Through Experiential Learning. ASME 2011 International Design Engineering Technical Conferences and Computers and Information in Engineering Con-ference, 2011, 741-750.
18. Pietrykowski K. and Tulwin T. Aircraft Radial En-gine CFD Cooling Model. SAE Int J EnEn-gines, 8(1), 2014, 82-88, doi:10.4271/2014-01-2884 .
19. Skarka W. and Mazurek A. CATIA, Podstawy modelowania i zapisu konstrukcji. Helion, 2005. 20. Wąsik M., Targosz M. and Panfil W. Methodology
of aerodynamic analysis in the hyperworks soft-ware of the cars participating in the Shell Eco-mar-athon race. Proceedings of the Institute of Vehicles, 3(99), 2014, 161-168.
21. Wełyczko A. CATIA V5, Sztuka modelowania powierzchniowego. Helion, 2010.
![Figure 1 shows a solid model of the research object made in SolidWorks and CATIA V5 [18, 19]](https://thumb-eu.123doks.com/thumbv2/9libnet/4985969.101218/2.892.460.784.867.1116/figure-shows-solid-model-research-object-solidworks-catia.webp)