Real-Time Elastography for Differentiation of Breast
Lesions
Ebru Yılmaz
1ABCDEF, Ayhan Yılmaz
2AB, Ahmet Aslan
3CDEF, Ibrahim Inan
4CDEF,
Mujgan Calıskan Evren
5BD, Kemal Tekesin
6BF
1
Department of Radiology, Gaziosmanpaşa Taksim Training and Research Hospital, Istanbul, Turkey
2Department of Radiology, Bezmialem Vakif University Hospital, Istanbul, Turkey
3
Department of Radiology, Medical School of Istanbul, Medeniyet University, Istanbul, Turkey
4Department of Radiology, Adıyaman University Hospital, Adıyaman, Turkey
5
Department of General Surgery, Medipol University Hospital, Istanbul, Turkey
6Department of General Surgery, Uskudar State Hospital, Istanbul, Turkey
Author’s address: Ebru Yılmaz, Department of Radiology, Gaziosmanpaşa Taksim Training and Research Hospital, Postal
code: 34380. Şişli, Istanbul, Turkey, e-mail: [email protected]
Summary
Backroung:
To investigate the diagnostic performance of the elastography-based strain index ratio in the differential diagnosis of malignant and benign breast lesions.Material/Methods:
Seventy-nine breast masses that were classified as BI-RADS category 3, 4, and 5 on B-mode ultrasonography (US) were further prospectively evaluated by real-time sonoelastography (RTE). To obtain an optimal cut-off value of the strain ratio for differentiating between malignant and benign breast lesions, RTE findings were compared with histopathology of core needle biopsy samples or with ultrasound follow-up data of the analyzed masses.Results:
Seventy-nine breast lesions [BI-RADS category 3 (n=15), BI-RADS category 4 (n=34), and BI-RADS category 5 (n=30)] were classified as malignant (n=36) or benign (n=43). The mean strain index value was 6.59±3.44 (range 0.6–14) for malignant lesions and 2.79±2.16 (range 0.6–8.7) for benign lesions, respectively (p<0.05). As regards the detection of malignant lesions, US was characterized by sensitivity and specificity of 100% (CI 95%; 88–100) and 90% (CI 95%; 76–97), respectively. When an optimal value of the strain ratio (4.25) was obtained by ROC curve analysis, the sensitivity and specificity for diagnosing malignant lesions were 86% (CI 95%; 70–95) and 76% (CI 95%; 60–87), respectively.Conclusions:
RTE can play an important role in the differentiation between malignant and benign breast masses, but it should be used in conjunction with ultrasonography.MeSH
Keywords: Breast Diseases • Breast Neoplasms • Elasticity Imaging Techniques • Ultrasonography, Mammary
PDF fi le: http://www.polradiol.com/abstract/index/idArt/902596
Received: 2016.11.26 Accepted: 2017.02.20 Published: 2017.11.17
Backround
Breast biopsy is the best diagnostic test for diagnosing sus-picious breast lesions. However, it has been reported that 75% of biopsied breast lesions are benign on histopathol-ogy [1,2]. Therefore, it is crucial to look for methods that will help avoid unnecessary biopsies that can lead to com-plications, patient anxiety, and unnecessary costs.
Ultrasound (US) imaging is a valuable method for diag-nosing breast cancer, and it is complementary to mam-mography. It effectively demonstrates lesions that are not identified on mammography due to dense parenchyma, and it characterizes lesions that are not well-demarcated on mammography. However, a high proportion of benign lesions that are diagnosed on histopathology underscores the need for more sensitive and specific tools that could decrease the number of biopsied lesions. In recent years, elastography has shown some promise in that respect. Authors’ Contribution: A Study Design B Data Collection C Statistical Analysis D Data Interpretation E Manuscript Preparation F Literature Search G Funds Collection
DOI: 10.12659/PJR.902596
O R I G I N A L A R T I C L EThere are two main sonoelastography methods described in the current literature, i.e., (1) strain and (2) shear-wave sonoelastography. In shear-wave sonoelastography, shear waves are sent from an ultrasound probe to the analyzed tissue, and the speed of wave propagation is calculated. This method outputs quantitative data, and it is not influ-enced by the pressure applied to the probe. In strain sonoe-lastography, pressure is conveyed from the transducer to the tissue at short time intervals, and the resulting tissue deformation is encoded and represented as a color map (pattern of elastography). In strain sonoelastography, a strain ratio can be calculated as a quantitative measure. In prior studies, elastography has been used to character-ize suspicious breast lesions, with greater sensitivity and specificity (41.0–98.5%) than B-mode US (7.1–98.8%) [3,4]. However, these studies have used only real-time elastog-raphy (RTE) to characterize breast lesions, and there is scarce evidence on the utility of the strain ratio. The cur-rent study was performed to investigate the diagnostic per-formance of the strain index ratio in characterizing breast lesions as malignant or benign.
Material and Methods
Study design
The local ethics committee approved the prospective design of the study, and written informed consent was collected from all patients who were included in the study.
Patient group
The study was performed between February 2011 and May 2013 in consecutive patients who met all inclusion criteria and no exclusion criteria. The inclusion criteria were as fol-lows: (1) presence of a mass in category 3, 4, 5 of the Breast Imaging Reporting and Data Systems (BI-RADS) as assessed by mammography and B-mode US; (2) availably of histo-pathologic diagnosis (tru-cut needle biopsy or surgery) or stable follow-up every six months for two years. Exclusion criteria were as follows: (1) lack of consent to enter the study, (2) presence of lesions smaller than 4 mm or greater than 5 cm. Data such as age, number of masses, BI-RADS category, and the longest dimension (cm) were noted. BI-RADS classification
Lesions were categorized on B-mode US (scanner LOGIQ E9; GE Healthcare, Milwaukee, WI, USA) according to the BI-RADS classification (2013 edition) [5]. Shape, margin, orientation relative to the plane of skin, echo patterns, posterior acoustic shadowing, and other features of the masses were evaluated. Ovoid, well-circumscribed, hypo-echoic, non-palpable masses that had a parallel orientation to the skin were categorized as BI-RADS category 3, if the patient had no risk factors and was younger than 40 years. Follow-up at six-month intervals was planned for those patients for at least two years. The patients who had at least one suspicious finding for malignancy, such as irregu-lar contour, microlobulation, angulation, vertical orienta-tion to the skin, posterior acoustic shadowing, echogenic halo, or abnormal findings in the surrounding tissue were
categorized as BI-RADS category 4 (moderately suspicious for malignancy) and 5 (strongly suspicious for malignancy), and histopathologic assessment was performed. The mass-es that demonstrated at least three suspicious findings for malignancy were classified as BI-RADS category 5. Lesions that could not be categorized as BI-RADS category 3 or 5 were included in BI-RADS category 4 [6]. BI-RADS catego-ry 4 lesions were further grouped into BI-RADS categocatego-ry 4a, 4b, and 4c [5]. BI-RADS category 3 and 4a lesions were considered as benign, and BI-RADS category 4b, 4c, and 5 lesions were considered as malignant. These data were compared with histopathological and follow-up findings to calculate sensitivity, specificity, positive and negative pre-dictive values, and accuracy.
Real-time elastography
After B-mode US examinations, a digital sonography scan-ner (LOGIQ E9; GE Healthcare, Milwaukee, WI, USA) equipped with RTE software and a linear 12–15 MHz mul-tifrequency transducer was used, and the same probe was applied with the freehand manual compression technique. A different radiologist acquired RTE findings after assess-ment of the data of B-mode ultrasonography. The B-mode and elastography images were seen on the same screen. During the elastography examination, the images were displayed over the B-mode images on a color scale [7,8]. Attention was paid to include the lesion with the sur-rounding fatty tissue in the elastographic box. The probe was maintained parallel to the chest wall during freehand manual compression and decompression. The compres-sion quality factor was used (bar scale from 1 to 7), and the images were obtained when optimal compression was between the bar values of 5 and 7. Static and moving images were also recorded digitally on the local sonogra-phy device for later review. The strain ratio was measured by comparing the breast lesion to the adjacent fatty tissue. The first region of interest (ROI) of 0.1 cm2 was placed in
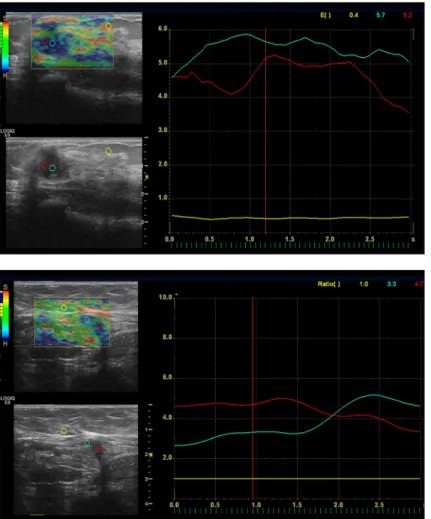
the adjacent fatty tissue that was more superficial than the lesion. The second ROI was placed within the mass. The strain ratio was then automatically computed by the US machine [9]. For the lesions that had dimensions greater than 5 mm, measurement was performed with more than one ROI, and then the mean value was calculated. The measurement was performed with one ROI for lesions smaller than 5 mm (Figures 1, 2).
Diagnostic criteria
All breast lesions included in the study were classified as benign or malignant according to histopathologic or ultra-sound follow-up findings. A US-guided core-needle biopsy was performed with a 14-gauge automatic Tru-Cut biop-sy needle (Bard Biopbiop-sy Systems, Tempe, AZ) in patients with BI-RADS category 4 and 5 lesions within a week of the radiologic assessment by an interventional radiolo-gist blinded to the US and RTE findings. In patients with lesions classified as BI-RADS category 3, at least a two-year follow-up at six-month intervals was carried out. However, core biopsies were performed in 4 patients with BI-RADS category 3 lesions due to the clinician’s or patients’ request. Moreover, one biopsy was not carried out for a category 4 of BI-RADS lesion because of patient’s refusal. The patient
was informed of possible risks associated with the lesion, and follow-up was recommended.
Statistical analysis
Breast lesions were classified as malignant or benign, and RTE findings were compared. The one-sample Kolmogorov-Smirnov test was used for assessing normality. The vari-ables were expressed as means with standard deviations, minimum and maximum values. A receiver operating char-acteristic curve was performed to obtain an optimal cut-off value of the strain ratio. Diagnostic test values (sensitivity, specificity, positive predictive value, negative predictive value, accuracy) with respective 95% confidential intervals were calculated. A p value <0.05 was considered signifi-cant, and analysis was bidirectional. NCSS 10 software was used for statistical analysis.
Results
Seventy-nine breast lesions that were found in 75 patients were included in the study. Twenty-eight of these patients were younger than 40 years, and ultrasound was per-formed in them as first-line imaging method. US examina-tions were performed in 47 patients older than 40 years after mammography due to dense breast tissue or detec-tion of pathologic findings prompting sonographic exami-nation. Based on US findings, the lesions were classi-fied as BI-RADS category 3 (n=15), BI-RADS category 4
(n=34; twenty-two of them were 4a, seven of them were 4b, and five of them were 4c), and BI-RADS category 5 (n=30). US-guided core needle biopsy was performed in 67 lesions with BI-RADS category 3, 4, and 5. One patient with BI-RADS category 4 lesion did not agree to biopsy, and in this case follow-up was recommended. Moreover, four patients who had BI-RADS category 3 lesions demand-ed biopsy instead of follow-up and therefore core biopsy was performed. After at least 24 months of US-based fol-low-up, no morphologic changes occurred in BI-RADS category 3 lesions (n=11) and BI-RADS category 4 lesion (n=1) (Table 1).
Forty-three lesions were classified as benign, and 36 lesions were classified as malignant, according to the
Figure 1. A 15×11 mm mass with irregular
margins and a strain index ratio of 11.
The histopathological diagnosis was
invasive ductal cancer.
Figure 2. A hypoechoic, 10×5 mm, mass
perpendicular to the skin. The strain
index ratio was 4.7. The histopathological
findings confirmed the diagnosis of
invasive ductal cancer.
B-mode US evaluation
Histopathological evaluation
BI-RADS category
n: 43; 54%
Benign
n: 36; 46%
Malign
5
–
30 (38%)
4
28 (35%) 6 (8%)
3
15 (19%)
–
Table 1. Distribution of benign and malignant lesions, according
to histopathological results and follow-up. (BI-RADS
classification).
histopathological assessment and follow-up findings. The mean age was 50±12.3 years for patients with malignant lesions and 35.51±13.60 years for patients with benign lesions (range of 16–78 years). Histopathological exami-nations revealed 36 malignant lesions that included inva-sive ductal carcinoma (n=29), invainva-sive lobular carcinoma (n=3), mucinous carcinoma (n=1), ductal carcinoma in situ (n=1), malignant phyllodes tumor (n=1), and a metastatic lesion from lung carcinoma (n=1). Thirty-one lesions were benign and included fibroadenomas (n=12), tubular adeno-ma (n=1), pseudoangioadeno-matous stroadeno-mal hyperplasia (n=1), benign phyllodes tumor (n=2), papillary lesion (n=2), aden-osis (n=4), fat necraden-osis (n=2), fibrocystic disease (n=2), and granulomatous mastitis (n=5). The remaining 12 lesions remained stable (accepted as benign) after a 2-year follow-up that was performed every six months.
All lesions in the BI-RADS category 4c and 5 were diag-nosed as malignant after histopathological assessment. Additionally, one BI-RADS category 4b lesion (14.2%) was malignant.
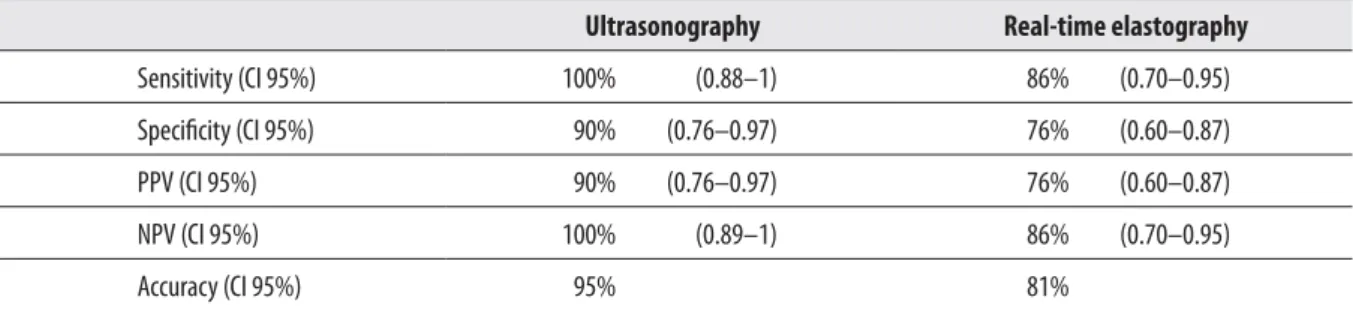
The mean value of the strain ratio of the malignant lesions was 6.59±3.44 (range 0.6–14), and the mean strain ratio value of the benign lesions was 2.79±2.16 (range 0.6–8.7) (p < 0.05). When 4.25 was used as a threshold value to dif-ferentiate between malignant and benign lesions, the sen-sitivity of elastography was 86% (CI 95%; 70–95), and its specificity was 76% (CI 95%; 60–87). The sensitivity of US was 100% (CI 95%;88–100), and its specificity was 90% (CI 95%; 76–97) (Table 2).
Discussion
It has been known for centuries that palpation of the breast is a very effective method for detecting abnormal masses, with hardness being an indicator of malignancy. Based on this basic principle, elastography has been developed. Elastography is a sonographic imaging technique that pro-vides qualitative and quantitative data by comparing hard-ness of the target tissue and that of the adjacent tissues. In our study, 79 breast lesions were evaluated by RTE, and strain ratios were calculated for each lesion to assess diag-nostic accuracy of RTE. We found that RTE is useful, but it should be used in conjunction with US.
Two, two different elastographic methods have been used. The first one is strain elastography in which tissue dis-placement is estimated with the freehand compression
technique (short-term compression applied to the tissue with the transducer) and represented by a (strain) color map and digital data [10]. Hard tissues are subject to small deformations, in contrast to soft tissues that often undergo substantial deformation. In malignant lesions, elasticity is lower due to the increased hardness and resultant small-er deformation. In the shear-wave elastography, which is another method of evaluating elasticity, shear waves are sent from the transducer, and their propagation speed is calculated. This approach is independent of the pressure that has been applied to the probe and provides quantita-tive data [11]. Recent studies show that there is no signifi-cant difference between these two methods for the diagno-sis of competence [12].
In the evaluation of the strain elastography data, a scoring technique according to a specific color is used (Ueno scor-ing) [13]. This scoring is a qualitative evaluation. The color coding can vary depending on the device. A color map is created according to tissue elasticity values. On color maps, blue represents hard tissues, while red represents soft tis-sues. During elastographic examinations, color-coded imag-es are displayed over B-mode imagimag-es [7,8]. Similarly to all ultrasound techniques, operator dependency is also a lim-itation of elastographic evaluations [14,15]. In our study, we evaluated quantitative data (strain index ratio) which is easy to obtain and represents a more objective measure of tissue elasticity than color-coding.
In the study performed by Yerli et al., the mean strain index value of benign lesions was 2.69±0.59, and the mean strain index value of malignant lesions was 3.75±0.68 [16]. The specificity of RTE was 93% at a threshold value of 3.52, while the specificity of US was 73%. [16]. In the study by Ueno et al., the cut-off value of the strain ratio was 4.8 [17]. Similarly, Chio et al. reported that the strain ratios were 2.63±4.57 for benign lesions and 6.57±6.62 for malignant lesions, and this difference was significant [17]. In the same study, the optimal threshold value of the strain ratio with the highest sensitivity and specificity (95% and 75%, respectively) was 2.24. The threshold value was higher in Ueno’s study, perhaps because of a differ-ent placemdiffer-ent of ROIs within the adipose tissue and dif-ferences in lesion characteristics. Additionally, because the degree of compression can change depending on the depth, the strain ratio value can also vary with different points of reference [17–20]. In our study, the threshold value was 4.25, which is similar to that reported by Ueno et al. In our study, ROIs were not at the same depth as the lesion (ROIs
Ultrasonography
Real-time elastography
Sensitivity (CI 95%)
100% (0.88–1)
86% (0.70–0.95)
Specificity (CI 95%)
90% (0.76–0.97)
76% (0.60–0.87)
PPV (CI 95%)
90% (0.76–0.97)
76% (0.60–0.87)
NPV (CI 95%)
100% (0.89–1)
86% (0.70–0.95)
Accuracy (CI 95%)
95%
81%
Table 2. Comparison of US and RTE.
were placed superficially in fatty tissues). Nevertheless, the difference between the strain index ratio of benign and malignant lesions was statistically significant in our study. In our study, we found that the average strain ratio of malignant lesions was 6.59±3.44 (range 0.6–14), and the average strain ratio of benign lesions was 2.79±2.16 (range 0.6–8.7) (p<0.05). When 4.25 was used as the threshold value, the sensitivity of RTE was 86%, and the specific-ity of RTE was 76%. The sensitivspecific-ity of US was 100%, and its specificity was 90%. In our department, ultrasonogra-phy is routinely performed in all patients younger than 40 years or in patients who have dense breast tissue on mammography. The high sensitivity and specificity val-ues of ultrasonography may be due to our high experience. However, lower sensitivity and specificity of RTE in com-parison to US can be caused by inherent limitations of RTE. Nevertheless, we found that sonoelastography provides additional information for BI-RADS category 4a lesions, and follow-up may be a better option instead of biopsy for the lesions that have a lower strain index value than the applied threshold.
False negative and false positive cases in our study reduced the sensitivity (86%) and specificity (76%) of RTE. Twelve lesions (two benign phyllodes tumors, two intraductal pap-illomas, one tubular adenoma, one adenosis, six fibroade-nomas) with a strain index ratio higher than 4.25 were con-sidered false positive. Additionally, five BI-RADS category 5 lesions (four invasive ductal carcinomas, one invasive lobular carcinoma) had a strain index ratio lower than the threshold value. Furthermore, in three cases with BI-RADS category 4b (one adenosis, one fat necrosis, one fibrosis), strain index ratios were markedly lower than the thresh-old value (they were 1.0, 1.1, and 2.1, respectively). There was only one case that was considered malignant with
both US and RTE (categorized as BI-RADS category 4b on US and with strain index ratio of 7.0), but histopathologi-cal assessment revealed a benign fibroadenoma. Sixteen of 22 lesions which were categorized as BI-RADS catego-ry 4a on US and therefore considered as benign had strain index ratios lower than the threshold value. In the remain-ing six patients (one adenosis, two benign phyllodes, two fibroadenomas, one tubular adenoma), strain index ratios were higher than the threshold value. Therefore, strain index ratios, in addition to US data, may have provided additional information for 16 lesions in BI-RADS catego-ry 4a, so that these lesions could have been downgraded to BI-RADS category 3 lesions that do not require biopsy [4,15,21]. However, based on our data, biopsy is necessary for all BI-RADS category 4b, 4c, and 5 lesions regardless of the strain index ratio.
There are some limitations of our study. First, sonoelas-tography is dependent on the experience of the radiologist. Moreover, differences in density in breast tissues adjacent to the breast lesions affect elasticity values [22]. Another limitation is that intra-observer or inter-observer variabil-ity was not taken into account.
Conclusions
In conclusion, elastography is an important modality that can provide additional information in the diagnosis of breast lesions. However, the information provided by RTE alone is limited, and for breast lesions it should be inter-preted in combination with US findings.
Conflict of interest
The authors declared no conflicts of interest
1. Hooley RJ, Greenberg KL, Stackhouse RM et al: Screening US in patients with mammographically dense breasts: Initial experience with Connecticut Public Act 09-41. Radiology, 2012; 265: 59–69 2. Poplack SP, Carney PA, Weiss JE et al: Screening mammography:
Costs and use of screening-related services. Radiology, 2005; 234: 79–85
3. Raza S, Odulate A, Ong EM et al: Using real-time tissue elastography for breast lesion evaluation: our initial experience. J Ultrasound Med, 2010; 29: 551–56
4. Cho N, Moon WK, Park JS et al: Nonpalpable breast masses: Evaluation by US elastography. Korean J Radiol, 2008; 9: 111–18 5. D’Orsi CJ, Sickles EA, Mendelson EB et al: ACR BI-RADS® Atlas, Breast Imaging Reporting and Data System, Reston VA, American College of Radiology, 2013
6. Costantini M, Belli P, Lombardi R et al: Characterization of solid breast masses use of the sonographic BI-RADS lexicon. J Ultrasound Med, 2006; 25: 649–59
7. Cho N, Jang M, Lyou CY et al: Distinguishing benign from malignant masses at breast US: Combined US elastography and color Doppler US influence on radiologist accuracy. Radiology, 2012; 262: 80–90 8. Itoh A, Ueno E, Tohno E et al: Breast disease: Clinical application of
US elastography for diagnosis. Radiology, 2006; 239: 341–50 9. Waki K, Murayama N, Matsumura T, Mitake T: Investigation
of strain ratio using ultrasound elastography technique. Paper presented at: First International Symposium on Information and Computer Elements; 2007 September 12–14; Kitakyushu, Japan
References:
10. Ophir J, Cespedes I, Ponnekanti H et al: Elastography: A quantitative method for imaging the elasticity of biological tissues. Ultrason Imaging, 1991; 13: 111–34
11. Cosgrove DO, Berg WA, Doré CJ et al: Shear wave
elastography for breast masses is highly reproducible. Eur Radiol, 2011; 22: 1023–32
12. Chang JM, Won JK, Lee KB et al: Comparison of shear-wave and strain ultrasound elastography in the differentiation of benign and malignant breast lesions. Am J Roentgenol, 2013; 201(2): W347–56 13. Scaperrotta G, Ferranti C, Costa C et al: Role of sonoelastography in
nonpalpable breast lesions. Eur Radiol, 2008; 18: 238–39 14. Zhao QL, Ruan LT, Zhang H et al: Diagnosis of solid breast lesions
by elastography 5-point score and strain ratio method. Eur J Radiol, 2012; 81: 3245–49
15. Ricci P, Maggini E, Mancuso E et al: Clinical application of breast elastography: State of the art. Eur J Radiol, 2014; 83: 429–37 16. Yerli H, Yilmaz T, Kaskatı T, Gulay H: Qualitative and
semiquantitative evaluations of solid breast lesions by sonoelastography. J Ultrasound Med, 2011; 30: 179–86 17. Ueno E, Umemoto T, Bando H et al: Newquantitative method in
breast elastography: fat lesion ratio (FLR). Paperpresented at: Radiological Society of North America 93rd Scientific Assembly and Annual Meeting; 2007 November 25–30, Chicago, IL
18. Cho N, Moon WK, Kim HY et al: Sonoelastographic strain index for differentiation of benign and malignant nonpalpable breast masses. J Ultrasound Med, 2010; 29: 1–7
19. Barr RG. Sonographic breast elastography. J Ultrasound Med, 2012; 31: 778–83
20. Zhi H, Xiao XY, Yang HY et al: Semi-quantitating stiffness of breast solid lesions in ultrasonic elastography. Acad Radiol, 2008; 15: 1347–53
21. Thomas A, Degenhardt F, Farrokh A et al: Significant differentiation of focal breast lesions: calculation of strain ratio in breast sonoelastography. Acad Radiol, 2010; 17: 558–63
22. Regini E, Bagnera S, Tota D et al: Role of sonoelastography in characterising breast nodules. Preliminary experience with 120 lesions. Radiol Med, 2010; 115: 551–62