1 2
Soil respiration within riparian buffers and adjacent crop fields
3 4
A. Tufekcioglu*, J.W. Raich, T.M. Isenhart, and R.C. Schultz
5 6
A.Tufekcioglu; Dep. of Forestry, 253 Bessey Hall, Iowa State Univ., Ames, IA 50011,
7
Phone: (515) 294 3289, *Corresponding author ([email protected])
8
J.W. Raich; Dep. of Botany, 353 Bessey Hall, Iowa State Univ., Ames, IA 50011
9
T.M. Isenhart; Dep. of Forestry, 253 Bessey Hall, Iowa State Univ., Ames, IA 50011
10
R.C. Schultz; Dep. of Forestry, 253 Bessey Hall, Iowa State Univ., Ames, IA 50011
11 12
This manuscript has 24 pages of text, 2 figures and 2 tables
13 14 15 16 17 18 19 20 21 22 23
1
Key words: agroecology, soil-CO2 emissions, soil moisture, soil temperature
2 3 4 5 6 7 8 9 10 11 12 13 14 15 16 17 18 19 20 21 22 23
Soil respiration within riparian buffers and adjacent crop fields
1
Abstract
2
We quantified rates of soil respiration among sites within an agricultural
3
landscape in central Iowa, USA. The study was conducted in riparian cool-season grass
4
buffers, in re-established multispecies (switchgrass + poplar) riparian buffers and in
5
adjacent crop (maize and soybean) fields. The objectives were to determine the
6
variability in soil respiration among buffer types and crop fields within a riparian
7
landscape, and to identify those factors correlating with the observed differences. Soil
8
respiration was measured approximately monthly over a two-year period using the soda-
9
lime technique. Mean daily soil respiration across all treatments ranged from 0.14-8.3 g
10
C m-2 d-1. There were no significant differences between cool-season grass buffers and
11
re-established forest buffers, but respiration rates beneath switchgrass were significantly
12
lower than those beneath cool-season grass. Soil respiration was significantlygreater in
13
both buffer systems than in the cropped fields. Seasonal changes in soil respiration were
14
strongly related to temperature changes. Over all sites, soil temperature and soil moisture
15
together accounted for 69 % of the seasonal variability in soil respiration. Annual soil
16
respiration rates correlated strongly with soil organic carbon (R =0.75, P<0.001) and fine
17
root (<2 mm) biomass (R=0.85, P<0.001). Annual soil respiration rates averaged 1140 C
18
m-2 for poplar, 1185 g C m-2 for cool-season grass, 1020 g C m-2 for switchgrass, 750 g
19
C m-2 for soybean and 740 g C m-2 for corn. Overall, vegetated buffers had significantly
20
higher soil respiration rates than did adjacent crop fields, indicating greater soil biological
21
activity within the buffers.
22 23
Introduction
1
Natural and re-established riparian buffers reduce nonpoint source pollutants
2
derived from upland agricultural lands, and enhance terrestrial and aquatic habitat (Hill,
3
1996; Isenhart et al., 1997; Jordan et al., 1993; Peterjohn and Correll, 1983; Schultz et al.,
4
1995). The quality of soils in riparian buffers plays an important role in facilitating these
5
functions. To a large extent, the rates at which organic matter is provided to and cycles
6
through riparian soils mediate their effectiveness as living filters between agricultural
7
fields and surface waters. Soil respiration is an excellent indicator of total soil biological
8
activity, and therefore of overall soil quality (Karlen et al., 1997; Parkin et al., 1996).
9
Riparian areas differ from uplands in soil and hydrologic characteristics, but few
10
studies of soil respiration have been conducted in riparian zones (Griffiths et al., 1997;
11
Tufekcioglu et al., 1998). Their location between crop fields and streams places riparian
12
buffers in a unique position to serve as sinks for sediments, nutrients, and pesticides; to
13
protect stream banks from erosion; and to reduce excessive runoff into stream channels
14
(National Research Council, 1993). To fulfill these functions, riparian buffer soils should
15
have high biological activity and conditions that foster water infiltration and gas
16
diffusion.
17
The rate of soil respiration is controlled primarily by the rate of CO2 production
18
by biota within the soil, but is modified by factors influencing the CO2 movement out of
19
the soil (Raich and Schlesinger, 1992; Schlesinger, 1977). Environmental factors such as
20
soil moisture and temperature influence soil biological activity and CO2 diffusion, and
21
therefore have pronounced influences on the seasonal dynamics of soil respiration
22
(Davidson et al., 1998; Kowalenko et al., 1978; Singh and Gupta, 1977). Factors such as
23
the availability of soil organic matter and density of plant roots, which provide the
1
substrates for soil biological activity, may control the overall magnitudes of soil
2
respiration (Bowden et al., 1993; Franzluebbers et al. 1995; Kelting et al., 1998).
3
The objective of this study was to compare rates of soil respiration among two
4
riparian buffer systems and their adjacent crop fields, and to identify the underlying
5
environmental variables most likely causing differences in soil respiration among sites,
6
and among seasons within sites. We hypothesized that riparian buffers have higher rates
7
of soil biological activity, and therefore have higher rates of soil respiration than do
8
adjacent croplands
9 10
Materials and methods
11
This study was conducted on a private farm along Bear Creek, in Story County,
12
Iowa, USA (42° 11' N, 93° 30' W). The study was done on two types of riparian buffers
13
(multi-species riparian buffer and cool-season grass buffer), and in adjacent crop fields.
14
Multi-species riparian buffers were established along Bear Creek in 1990 on soil that had
15
been cultivated or grazed for more than 75 years. The basic design of the multi-species
16
buffer consists of five rows, at 1.2 x 1.8 m spacing, of hybrid poplar (Populus X
17
euroamericana’ Eugenei) planted closest to and parallel to the creek. Upslope from the
18
trees are a row of red osier dogwood (Cornus sericea L.) and a row of ninebark
19
(Physocarpus opulifolius L.). A 7.3 m-wide strip of switchgrass (Panicum virgatum L.),
20
a native warm-season grass, is planted upslope from the shrubs at the interface with the
21
cropped fields (Schultz et al., 1995). Cool-season grass buffers were directly adjacent to
22
the multi-species riparian buffers and were formerly grazed riparian meadows, dominated
23
by cool-season grasses, that form the traditional streamside management system in this
1
intensively cropped region.
2
Six transects, three each bisecting cool-season and multispecies buffers, were
3
established in either side of a 0.8 km stretch of Bear Creek, perpendicular to the stream.
4
In multispecies buffers soil respiration was measured in poplar (streamside), switchgrass
5
(cropside) and in the cropfield plots. In cool-season buffers soil respiration was
6
measured in streamside plots, cropside plots and in the adjacent cropfield plots. The
7
cool-season grass sites were divided into a streamside and cropside plots to control for
8
the potential effect of distance from stream on soil respiration. Plot sizes varied from 7 X
9
10 m to 10 X 15 m. The crop fields were under an annual maize-soybean rotation.
10
Maize (Zea mays L.) usually was planted in the early May and harvested at the end of
11
October. Soybean (Glycine max (L.) Merr.) usually was planted in mid-May and
12
harvested in mid-September. The cool-season grass sites were part of a grazed riparian
13
pasture prior to 1989 when grazing was stopped. Dominant grass species in the cool-
14
season grass sites were smooth brome (Bromus inermis Leysser.), timothy (Phleum
15
pratense L.), and Kentucky bluegrass (Poa pratensis L.). These same species werealso
16
found in the poplar understory.
17
The study sites were on Coland soil (fine-loamy, mixed, mesic Cumulic
18
Haplaquoll) which is well drained to poorly drained and formed from till or local
19
alluvium and colluvium derived from till (DeWitt, 1984). The soils graded into Clarion
20
soils (fine-loamy, mixed, mesic Typic Hapludolls) in the croplands distant from the
21
stream (DeWitt, 1984). Our sampling was conducted mainly in Coland soils, but two
22
of the study area was 2 %. Organic carbon contents of the soils (0-35 cm depth) were
1
obtained from Marquez et al. (1999) who examined organic matter fractions of the same
2
plots (Table 1). The biomass of fine (0-2 mm) roots was assessed by sequentially
3
collecting five 35-cm deep, 5.4-cm diameter cores per plot each month from April
4
through November in 1996. Roots were sorted into live and dead fractions based on the
5
elasticity of their tissues and the color of the cortex (Tufekcioglu et al., 1999).
6
Soil respiration rates were measured approximately monthly in three randomly
7
selected locations in each of the three plots (i.e. vegetation types) per transect from July
8
1996 to August 1998 using the soda-lime method (Cropper et al., 1985; Edwards, 1982;
9
Raich et al., 1990). The soda-lime method may underestimate actual soil respiration rates
10
at high flux rates (e.g. Ewel et al., 1987; Haynes and Gower, 1995). However, the
11
method does distinguish between higher and lower flux rates and, therefore, it is an
12
appropriate method for comparing sites.
13
Buckets 20 cm tall and 27.5 cm in diameter were used as measurement chambers.
14
One day prior to measurements, plastic rings with the same diameter were placed over
15
the soil and carefully pushed about 1 cm into the soil. All live plants inside the plastic
16
rings were cut to prevent aboveground plant respiration. Carbon dioxide was absorbed
17
with 60 g of soda-lime contained in 7.8 cm diameter by 5.1 cm tall cylindrical tins. In the
18
field, the plastic rings were removed, measurement chambers were placed over the tins of
19
soda-lime, and the chambers were held tightly against the soil with rocks. After 24 h the
20
tins were removed, oven dried at 105° C for 24 h, and weighed. Blanks were used to
21
account for carbon dioxide absorption during handling and drying (Raich et al. 1990).
22
Soda-lime weight gain was multiplied by 1.69 to account for water loss (Grogan, 1998).
23
Soil temperature was measured at 5 cm soil depth adjacent to each chamber in early
1
morning. Gravimetric soil moisture was determined by taking soil samples at 0-5 cm
2
depth and drying them at 105 C for 24 h on the day that the soda-lime tins were removed
3
from the plots. Soil moisture was not measured in winter, when the soil was frozen.
4
Statistical comparisons were made using the general linear models procedure of SAS (SAS 5
Institute 1985). We used ANOVA to compare soil respiration rates, soil temperatures, and soil moisture 6
contents among buffer types, position from stream (streamside, cropside and cropfields), and sampling 7
dates using a repeated measures design. Paired comparisons among vegetation covers, plot positions and 8
sampling dates were determined with Least Significant Difference test (SAS Institute, 1985) at α=0.05.
9
Step-wise multiple regression analysis was performed to evaluate the importance of soil temperature and 10
soil moisture on seasonal soil respiration rates. The possible effects of soil organic carbon content and fine 11
root biomass on annual soil respiration rates were evaluated among vegetation types with correlation 12
analysis.
13
Results 14
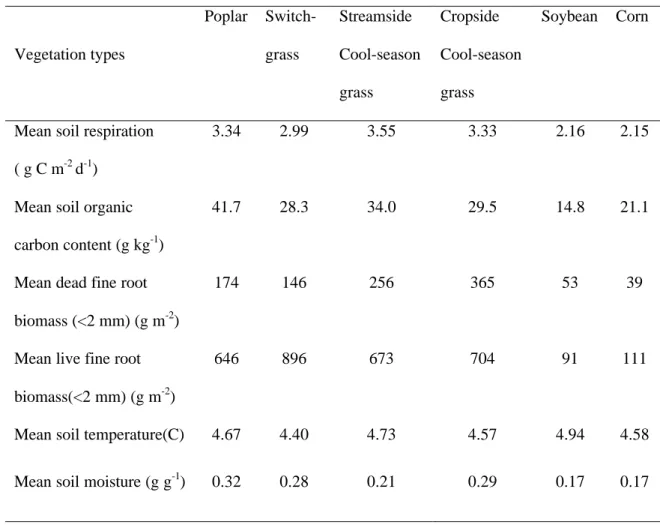
Among all treatments, mean daily soil respiration ranged from 0.14 to 6.7 g C m-2
15
d-1 (Fig. 1A). Highest rates were observed in late July when soil temperatures were high,
16
while lowest rates were observed in January when soil temperatures were minimal (Fig.
17
1B). Soil respiration varied significantly among sampling dates and landscape positions
18
(P<0.0001). The cropped fields had significantly lower soil respiration than did all plots
19
in riparian buffers. Soil respiration in multi-species riparian buffers was not significantly
20
different than in cool-season grass buffers. Within the riparian buffers, the poplar and
21
cool-season grass sites had significantly greater soil respiration rates than did the
22
switchgrass plots (P< 0.05).
23
Soil temperature and soil moisture varied among landscape positions and
1
sampling dates (P<0.01) (Fig. 1B & 1C). Soil temperatures in the crop fields were
2
significantly (P<0.05) different from those in switchgrass, being higher in the spring and
3
the summer; and lower in the winter, but no other temperature differences among
4
different vegetation components of buffers and crops were found. Soil moisture contents
5
under the poplar, cropside cool-season grass and switchgrass sites were significantly
6
greater than in the corn, soybean and streamside cool-season grass sites (P<0.05).
7
Within sites, seasonal changes in soil respiration were correlated most highly with
8
soil temperature. When all sites were considered together, mean daily soil respiration
9
varied with soil temperature and moisture (r2 = 0.69, P<0.0001):
10
ln (SR) = 0.0865 T + 0.0246 M – 0.264
11
where SR is the soil respiration rate (g C m-2 d-1), T is morning surface-soil (0-5 cm
12
depth) temperature (°C) and M is surface-soil (0-5 cm depth) gravimetric moisture
13
content (% H2O). All three parameters were significant (P<0.01).
14
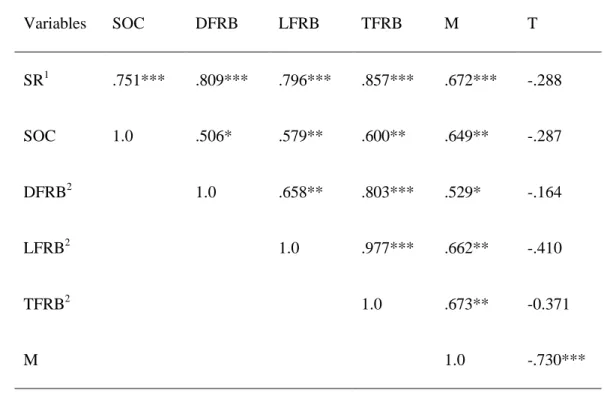
Among sites, mean annual soil respiration rate correlated positively with mean
15
soil organic carbon content, dead fine root biomass, live fine root biomass, total fine root
16
biomass (dead + live) and soil moisture content (Table 2, Fig. 2). Despite the pronounced
17
influence of soil temperatures on seasonal variations in soil respiration (Fig. 1), mean
18
annual soil respiration rates among vegetation types did not correlate with mean annual
19
soil temperatures (Table 2). Soil temperature and soil moisture were negatively
20
correlated, suggesting that high (mean annual) soil temperatures were associated with
21
drier soils. Live, dead and total fine root biomass were positively correlated at P<0.005,
22
so we discuss total fine root biomass only, which had the highest correlations with soil
23
respiration rates. Soil moisture, total fine root biomass, and soil organic carbon content
1
were all positively correlated with one another (Table 2), making the clear identification
2
of cause and effect impossible.
3
For summary comparisons, annual soil respiration rates were estimated by
4
calculating the average soil respiration rate per month over the duration of the study and
5
assuming February respiration equaled the average of the January and March rates.
6
Annual soil respiration totaled 1220 g C m-2 for streamside cool-season grass, 1150 g C
7
m-2 for cropside cool-season grass, 1140 g C m-2 for poplar, 1030 g C m-2 for switchgrass,
8
750 g C m-2 for soybean and 740 g C m-2 for the corn sites.
9 10
Discussion
11
The mean daily soil respiration rates measured in this study (0.14 to 6.7 g C m-2 d-
12
1) were similar to those observed by others (Coleman, 1973; Jurik et al., 1991; Kucera &
13
Kirkham, 1971; Lessard et al., 1994). Soil respiration increased from winter to summer
14
and decreased from summer to fall, as is typical in temperate latitudes (e.g., Hudgens and
15
Yavitt, 1997; Kowalenko et al., 1978). Kowalenko et al. (1978) reported that temperature
16
was limiting during the winter and spring (cold and moist) and moisture was limiting
17
during the summer or fall. A similar effect of temperature on soil respiration was
18
observed in this study; but temperature was also a limiting factor during late fall.
19
Although soil moisture was higher or similar in November than in August; soil
20
respiration was higher in August than in November (Fig 1). This indicates the limiting
21
effect of temperature during fall. Significant soil temperature differences were only
22
observed between the switchgrass and cropped plots. Soil temperature in the switchgrass
23
sites was higher in fall and lower in spring than in adjacent crop fields. Switchgrass
1
produces aboveground biomass up to 16300 kg ha-1 (Huang et al., 1996). The surface
2
litter in the switchgrass sites probably delayed soil warming in early spring and cooling in
3
late fall.
4
While temperature was the most important factor driving seasonal variation in soil
5
respiration (Fig. 1), it was not significant in terms of explaining variation among
6
vegetation types (Table 2). The crop fields had the highest average soil temperature but
7
the lowest overall soil respiration rates. This is probably due to lowest root biomass, soil
8
organic carbon and water contents in the crop fields (Table 1).
9
Soil respiration rates in the buffer sites were significantly higher than in the crop
10
fields (Fig. 1). Previous comparisons between perennial and adjacent cropped systems by
11
other researchers have given inconsistent results. Higher soil respiration rates in a forest
12
than a nearby corn field were reported by Lessard et al. (1994), whereas Beyer (1991)
13
found both higher and lower soil respiration rates in forests compared to cropped fields.
14
Grasslands had higher rates of soil respiration than did cropped fields in studies by de
15
Jong (1981) and Wagai et al. (1998), but Buyanovsky et al. (1987) found lower overall
16
soil respiration rates in a prairie than in a winter wheat system. In our case, the higher
17
soil respiration rates in the buffers were correlated with more soil organic carbon
18
contents, greater fine root biomass, and higher soil moisture contents, all of which
19
correlated significantly with one another (Table 2).
20
Respiration by roots and their associated microbial components represent a
21
significant part of soil respiration in most ecosystems (Bowden et al., 1993; Kelting et al.,
22
1998). While live roots directly contribute to soil respiration, dead roots and root
23
exudates provide carbon as an energy source and nutrients for microbial biomass.
1
Grayston et al. (1996) reported that root exudates stimulate microbial growth and activity
2
because they are readily assimilated, and they may act as primers for the degradation of
3
existing soil organic matter. In a native prairie, belowground litter contributed 20-25 %,
4
root respiration contributed 25-30 %, and decay of organic matter contributed 30-35 % of
5
the total soil respiration (Buyanovsky et al., 1987). Root respiration accounted for 33-50
6
% of total soil respiration in broad-leaved forests, 17-40 % in grasslands, and 12-38 % in
7
crop fields in temperate regions (Raich and Tufekcioglu, 1999). Higher annual soil
8
respiration in poplar, switchgrass and cool season grass sites compared to crop sites
9
might be driven mainly by root biomass, and soil organic matter content differences
10
among sites.
11
Switchgrass had the highest live fine root biomass, but soil respiration was lower
12
in switchgrass sites than in poplar and cool-season grass sites. This might be due to
13
either relatively low root turnover, low root respiration of switchgrass, or low C:N ratio
14
of switchgrass detritus. Hartnett (1989) reported that switchgrass produced long-lived
15
rhizomes and maintained intact rhizome interconnections among stems up to 10 y.
16
Substrate quality and root respiration differences between the switchgrass and cool-
17
season grasses might also result in different soil respiration rates. For example, Wedin
18
(1995) reported that low-quality litter from the prairie grass Schizachyrium scoparium
19
(Michx.) Nash., a C4 species, decomposed slowly and immobilized large amounts of N,
20
whereas litter from the C3 grass Agropyron repens (L.) Beauv. decomposed faster and
21
showed no net N immobilization. We hypothesize that physiological or substrate-quality
22
differences between switchgrass and the cool-season grass species may lead to lower
1
rates of C cycling in the soils beneath switchgrass.
2
Soil organic matter is an important determinant of soil respiration and soil
3
moisture. Franzluebbers et al. (1995) found a significant relationship between soil
4
organic carbon and soil respiration in crop fields planted with soybean, sorghum and
5
wheat under no-tillage regimes. Management practices also influence soil respiration
6
rates through their influence on soil organic matter (Franzluebbers et al., 1995). In
7
general, cultivation decreases the soil organic matter content of agricultural soils except
8
in intensively manured fields. Decreases from 20 to 68 % in soil organic carbon were
9
reported depending on years under cultivation (Collins et al., 1999; Ellert and Gregorich,
10
1996, Mann, 1986). Lower soil organic matter under crops are likely the result of the
11
combined effect of annual vegetation and management practices.
12
Soil moisture differences among sites were probably also driven by soil organic
13
matter differences. Water holding capacity of soil increases with an increase in soil
14
organic matter (Kern, 1995). More soil organic matter in the poplar and grass plots may
15
have enhanced soil respiration by providing carbon as an energy source to
16
microorganisms and by increasing the water-holding capacity of the soil. Increased water
17
holding capacity provides better conditions for root growth and for microorganisms,
18
which may lead to higher soil respiration. Rochette et al. (1997) found that soil
19
respiration in moist soil was two to three times greater than in drier soils. Soil moisture
20
contents under crop fields were significantly lower than under other vegetation types
21
except the streamside cool-season grass. The relatively low soil moisture content of the
22
streamside cool-season grass plots (Fig. 1C) was due to sandy sediment deposited on the
1
soil surface by flooding events.
2
Annual carbon release values found in this study (740-1220 g C m-2 y-1) are
3
within the ranges reported by others. Soil respiration rates in our grass sites (1030-1220
4
g C m-2 y-1) were higher than those observed in tallgrass prairie by Risser et al. (1981)
5
(660 g C m-2 y-1), and Buyanovsky et al. (1987) (490 g C m-2 y-1), who also used static,
6
closed chamber techniques. Rates in prairie ecosystems measured with dynamic IRGA-
7
based systems include 450 g C m-2 y-1 in Missouri (Kucera and Kirkham, 1971), 720 g C
8
m-2 y-1 in Wisconsin (Wagai et al., 1998), and 1100-2100 g C m-2 y-1 in Kansas (Bremer
9
et al., 1998; Knapp et al., 1998). Our crop field values (740-750 g C m-2 y-1) are slightly
10
higher than those found in a winter wheat ecosystem in Missouri (640 g C m-2 y-1)
11
(Buyanovsky et al., 1987), and from tilled and no-till corn in Wisconsin (508-534 g C m-2
12
y-1) (Wagai et al., 1998); and are close to those found in a soybean field in Missouri (760
13
g C m-2 y-1) (Buyanovsky and Wagner, 1995).
14
The buffers had significantly higher rates of soil respiration than did the crop
15
fields, but were also closer to the stream. Therefore, a position effect might be expected.
16
However, switchgrass and cropside cool-season grass sites were in the same positions,
17
yet they had significantly different soil respiration rates. There was no significant
18
difference between streamside and cropside grass sites, suggesting that stream- and
19
cropside cool-season grass sites were similar or no position effect existed under the same
20
vegetation type. Overall, the perennial vegetation present in the buffers supported higher
21
rates of C cycling through the soil than did annual crops. These higher rates of soil
22
respiration are evidence of high rates of the biological activity that promote the
23
effectiveness of riparian buffers as living filters between agricultural fields and surface
1
waters.
2
Acknowledgments
3
Journal Paper No. J-17839 of the Iowa Agriculture and Home Economics Experiment
4
Station, Ames, Iowa, Project No. 3332, and supported by Hatch Act and State of Iowa
5
funds. The research has also been funded in part by the Iowa Department of Natural
6
Resources through a grant from the U.S. Environmental Protection Agency under the
7
Federal Non-point Source Management Program (Section 319 of the Clean Water Act),
8
by the Leopold Center for Sustainable Agriculture, a State of Iowa Institution located at
9
Iowa State University, and by the U.S. Department of Agriculture National Research
10
Initiative Competitive Grants Program award number 95-37192-2213.
11
This material was prepared with the support of a grant from the Agriculture in Concert
12
with the Environment (ACE) program, which is jointly funded by the U.S. Department of
13
Agriculture, Cooperative State Research, Education and Extension Service, and the
14
Environmental Protection Agency under Cooperative Agreement No. 94-COOP-1-0809.
15
Any opinions, findings, conclusions, or recommendations expressed here in are those of
16
the authors and do not necessarily reflect the views of the U.S. Department of Agriculture
17
or the Environmental Protection Agency.
18
We would like to thank to Akif Karsli, Kathie Taylor, Michelle Ludwig, Seyrani
19
Goncagul and Zeki Gokalp for their assistance with this study in the field and laboratory.
20 21
References
22
Beyer L 1991 Intersite characterization and variability of soil respiration in different
1
arable and forest soils. Biol. Fertil. Soils 12, 122-126.
2
Bowden R D, Nadelhoffer K J Boone R D Melillo J M and Garrison J B 1993
3
Contributions of aboveground litter, belowground litter, and root respiration to
4
total soil respiration in a temperate mixed hardwood forest. Can. J. For. Res. 23,
5
1402-1407.
6
Bremer D J, Ham J M, Owensby C E and Knapp A K 1998 Responses of soil respiration
7
to clipping and grazing in a tallgrass prairie. J. Environ. Qual. 27, 1539-1548.
8
Buyanovsky G A, Kucera C L and Wagner G H 1987 Comparative analyses of carbon
9
dynamics in native and cultivated ecosystems. Ecology 68 (6), 2023-2031.
10
Buyanovsky G A and Wagner G H 1995 Soil respiration and carbon dynamics in
11
parallel native and cultivated ecosystems. In Soils and Global Change. Ed. R.
12
Lal, J. Kimble, E. Levine and B. A. Stewart. pp 209-216. Lewis Publishers, Boca
13
Raton, USA.
14
Coleman D C 1973 Soil carbon balance in a successional grassland. Oikos 24, 195-199.
15
Collins H P, Belvins R L Bundy L G Christenson D R Dick W A Huggins D R and Paul
16
E A 1999 Soil carbon dynamics in corn-based agroecosystems: Results from
17
carbon-13 natural abundance. Soil Sci. Soc. Am. J. 63, 584-591.
18
Cropper P W, Ewel K C and Raich J W 1985 The measurement of soil CO2 in situ.
19
Pedobiologia 28, 35-40.
20
Davidson E A, Belk E and Boone R D 1998 Soil water content and temperature as
1
independent or confounded factors controlling soil respiration in a temperate
2
mixed hardwood forest. Global Change Biology 4, 217-227.
3
De Jong E 1981 Soil aeration as affected by slope position and vegetative cover. Soil
4
Sci. 131, 34-43.
5
DeWitt T A 1984 Soil survey of Story County, Iowa. USDA Soil Conservation Service,
6
Washington, DC.
7
Edwards N T 1982 The use of soda-lime for measuring respiration rates in terrestrial
8
systems. Pedobiologia 23, 321-330.
9
Ellert B H and Gregorich G 1996 Storage of carbon, nitrogen and phosphorus in
10
cultivated and adjacent forested soils of Ontario. Soil science 161, 587-603.
11
Ewel K C, Cropper W C and Gholz H L 1987 Soil CO2 evolution in Florida slash pine
12
plantations. I. Changes through time. Canadian Journal of Forest Research 17,
13
325-329.
14
Franzluebbers A J, Hons F M Zuberer D A 1995 Tillage and crop effect on seasonal
15
dynamics of soil CO2 evolution, water content, temperature, and bulk density.
16
Applied Soil Ecology 2, 95-109.
17
Grayston S J, Vaughan D and Jones D 1996 Rhizosphere carbon flow in trees, in
18
comparison with annual plants: the importance of root exudation and its impact on
19
microbial activity and nutrient availability. Applied Soil Ecology 5, 29-56.
20
Griffiths R P, Entry J A Ingham E R and Emmingham W H 1997 Chemistry and
1
microbial activity of forest and pasture riparian zone soils along three Pacific
2
Northwest streams. Plant and Soil 190, 169-178.
3
Grogan P 1998 CO2 flux measurement using soda-lime: Correction for water formed
4
during CO2 adsorption. Ecology 79, 1467-1468.
5
Hartnett D C 1989 Density- and growth stage-dependent responses to defoliation in two
6
rhizomatous grasses. Oecologia 80, 414-420.
7
Haynes B E and Gower S T 1995 Belowground carbon allocation in unfertilized and
8
fertilized red pine plantations in northern Wisconsin. Tree Physiol. 15, 317-325.
9
Hill A R 1996 Nitrate removal in stream riparian zones. Journal Environmental Quality
10
25, 743-755.
11
Huang Y, Ricker D H and Kephart K D 1996 Recovery of deep-point injected soil
12
nitrogen-15 by switchgrass, alfalfa, ineffective alfalfa, and corn. Journal of
13
Environmental Quality 25, 1394-1400.
14
Hudgens D E and Yavitt J B 1997 Land-use effects on soil methane and carbon dioxide
15
fluxes in forest near Ithaca, New York. Ecoscience 4(2), 214-222.
16
Isenhart T M, Schultz R C Colletti J P 1997 Watershed restoration and agricultural
17
practices in the Midwest: Bear Creek of Iowa. In Watershed Restoration:
18
Principles and Practices. Ed. J E Williams C A Wood and M P Dombeck. pp
19
318-334. American Fisheries Society, Maryland, USA.
20
Jordan T E, Correll D L and Weller D E 1993 Nutrient interception by a riparian forest
1
receiving inputs from adjacent cropland. Journal of Environmental Quality 22,
2
467-473.
3
Jurik T W, Briggs G M and Gates D M 1991 Soil respiration of five aspen stands in
4
Northern Lower Michigan. Am. Midl. Nat. 126, 68-75.
5
Karlen D L, Mausbach M J Doran J W Cline R G Harris R F and SchumanG E 1997
6
Soil Quality: A concept, definition, and framework for evaluation (a guest
7
editorial). Soil Science Society of America Journal 61, 4-10.
8
Kelting D L, Burger J A and Edwards G S 1998 Estimating root respiration, microbial
9
respiration in the rhizosphere, and root-free soil respiration in forest soils. Soil
10
Biology and Biochemistry 30, 961-968.
11
Kern J S 1995 Evaluation of soil water retention models based on basic soil physical
12
properties. Soil Science Society of America Journal 59, 1134-1141.
13
Knapp A K, Konard S L and Blair J M 1998 Determinants of soil CO2 flux from a sub-
14
humid grassland: effect of fire and fire history. Ecological Applications 8(3),
15
760-770.
16
Kowalenko C G, Ivarson K C and Cameron D R 1978 Effect of moisture content,
17
temperature and nitrogen fertilization on carbon dioxide evolution from field
18
soils. Soil Biology and Biochemistry 10, 417-423.
19
Kucera C L and Kirkham D R 1971 Soil respiration studies in tallgrass prairie in
1
Missouri. Ecology 52, 912-915.
2
Lessard R, Rochette P Topp E Pattey E Desjardins R L and Beaumont G 1994 Methane
3
and carbon dioxide fluxes from poorly drained adjacent cultivated and forest sites.
4
Canadian Journal of Soil Science 74, 139-146.
5
Mann L K 1986 Changes in soil carbon storage after cultivation. Soil Sci. 142, 279-
6
288.
7
Marquez C O, Cambardella C A Isenhart t M and Schultz R C 1999 Assessing soil
8
quality in a riparian buffer by testing organic matter fractions in Central Iowa.
9
Agroforestry Systems 44(2-3), 133-140.
10
National Research Council 1993 Soil and Water Quality: an agenda for agriculture.
11
National Academy Press, Washington, DC, USA.
12
Parkin T B,Doran J W and Franco-Wizcaino E 1996 Field and Laboratory tests of soil
13
respiration in Methods for Assessing Soil Quality. Ed. J.W. Doran and A.J.
14
Jones. Soil Science Society of America special publication no 49, Madison,
15
Wisconsin, USA.
16
Peterjohn TW and Correll D L 1983 Nutrient dynamics in an agricultural watershed:
17
observations on the role of a riparian forest. Ecology 65(5), 1466-1475.
18
Raich J W and Schlesinger W H 1992 The global carbon dioxide flux in soil respiration
19
and its relationship to vegetation and climate. Tellus 44B, 81-99.
20
Raich J W and Tufekcioglu A 1999 Vegetation and soil respiration: Correlations and
1
controls. Biogeochemistry 48 (1), 71-90.
2
Raich J W, Bowden R D and Steudler P A 1990 Comparison of two static chamber
3
techniques for determining carbon dioxide efflux from forest soils. Soil Science
4
Society of America Journal 54,1754-1757.
5
Risser P G, Birney E G Blocker H D May S W Parton W J and Wiens J A 1981 The
6
True Prairie Ecosystem. US/IBP Synthesis Series, 16, 155-187. Hutchison Ross
7
Publishing Company: Stroudsburg/Pennsylvania, USA.
8
Rochette P, Ellert B Gregorich E G Desjardins R L Pattey Lessard E R and Johnson B G
9
1997 Description of a dynamic closed chamber for measuring soil respiration and
10
its comparison with other techniques. Canadian Journal of Soil Science 77, 195-
11
203.
12
SAS Institute, Inc. 1985 SAS users guide: statistics. Version 5 edition. SAS Institute
13
Inc., Cary/ New Jersey, U.S.A.
14
Schlesinger, W H 1977 Carbon balance in terrestrial detritus. Ann. Rev. Ecol. Syst. 8,
15
51-81.
16
Schultz R C, Colletti J P Isenhart T M Simkins W W Mize C W and Thompson M L
17
1995 Design and placement of a multi-species riparian buffer strip sytem.
18
Agroforestry Systems 29, 1-16.
19
Singh J S and Gupta S R 1977 Plant decomposition and soil respiration in terrestrial
1
ecosystems. Bot. Rev. 43, 449-528.
2
Tufekcioglu A, Raich J W Isenhart T M and Schultz R C 1999 Fine root dynamics,
3
coarse root biomass, root distribution, and soil respiration in a multi species
4
riparian buffer in Central Iowa, USA. Agroforestry Sytems 44, 163-174.
5
Wagai R, Brye K R Gower S T Norman J M and Bundy L G 1998 Land use and
6
environmental factors influencing soil surface CO2 flux and microbial biomass in
7
natural and managed ecosystems in southern Wisconsin. Soil Biology and
8
Biochemistry 30, 1501-1509.
9
Wedin D A 1995 Species, nitrogen, and grassland dynamics: the constraints of stuff. In
10
Linking Species and Ecosystems. Ed. C. G. Jones and J. H. Lawton. pp 252-262.
11
Chapman and Hall Publishing, New York, USA.
12
13
14
Figure Legend
1
Figure 1: Mean monthly (± 1 SE) soil respiration rates (A), soil temperature (B), and soil
2
moisture content (0-5 cm depth) (C) in poplar, cool-season grasses (CSG-S:
3
streamside, CSG-C: cropside), soybean and maize sites in central Iowa, averaged
4
over the two year period, 1996-1998.
5
Figure 2: Mean annual soil respiration in relation to soil organic carbon (A) and root
6
biomass content (0-35 cm depth) (B) in Bear Creek Watershed, Iowa (n=18).
7
8
Table 1: Mean soil respiration, soil temperature, soil moisture, soil organic carbon and
1
root biomass in the six vegetation types investigated in this study (n=3 plots per
2
vegetation). Root data are from Tufekcioglu et al. (1999) and soil organic carbon
3
data are from Marquez et al. (1999); both refer to the surface 35 cm of soil.
4
Vegetation types
Poplar Switch- grass
Streamside Cool-season grass
Cropside Cool-season grass
Soybean Corn
Mean soil respiration ( g C m-2 d-1)
3.34 2.99 3.55 3.33 2.16 2.15
Mean soil organic carbon content (g kg-1)
41.7 28.3 34.0 29.5 14.8 21.1
Mean dead fine root biomass (<2 mm) (g m-2)
174 146 256 365 53 39
Mean live fine root biomass(<2 mm) (g m-2)
646 896 673 704 91 111
Mean soil temperature(C) 4.67 4.40 4.73 4.57 4.94 4.58
Mean soil moisture (g g-1) 0.32 0.28 0.21 0.29 0.17 0.17 5
Table 2: Pearson correlation coefficients among measured variables in the study area
1
(n=18). Asterisks refer the level of significance; *, P<.05; **, P<.01; ***, P<.001
2
Variables SOC DFRB LFRB TFRB M T
SR1 .751*** .809*** .796*** .857*** .672*** -.288
SOC 1.0 .506* .579** .600** .649** -.287
DFRB2 1.0 .658** .803*** .529* -.164
LFRB2 1.0 .977*** .662** -.410
TFRB2 1.0 .673** -0.371
M 1.0 -.730***
3
1 SR: soil respiration (g C M-2 d-1); SOC: Mean soil organic carbon content (g kg-1).
4
2 5
3 DFRB, LFRB & TFRB: Mean dead, live and total fine root biomass (g m-2),
6
respectively.
7
M: Mean soil moisture (%).
8
T: Mean soil temperature (C)
9
10
Figure Legend
1
Figure 1: Mean monthly (± 1 SE) soil respiration rates (A), soil temperature (0-5 cm
2
depth) (B), and soil moisture content (0-5 cm depth) (C) in poplar, cool-season
3
grasses (CSG-S: streamside, CSG-C: cropside), soybean and maize sites in
4
central Iowa, averaged over the two year period, 1996-1998.
5
Figure 2: Mean annual soil respiration in relation to soil organic carbon (0-35 cm depth)
6
(A) and root biomass content (0-35 cm depth) (B) in Bear Creek Watershed, Iowa
7
(n=18).
8
9
1
2
3
4
5
6
7
8
0 1 2 3 4 5 6 7 8
Jan March May July Sept Nov
Sampling Months
Soil Respiration (g C/m2/day)
Poplar Switchgrass Coolgrass I Coolgrass II Soybean Corn
1
2
3
4
5
6
7
8
9
0 5 10 15 20 25 30 35 40 45
March April May June July August Oct Nov Dec Sampling Months
Soil Moisture Content (%)
Poplar Switchgrass Coolgrass I Coolgrass II Soybean Corn
1
2
3
4
5
6
7
8
9
0 2 4 6 8 10 12
2 2.5 3 3.5 4 4.5 5 5.5 6
Soil respiration (g C/m2/day)
Live root (<5 mm) biomass (Mg/ha)
1
2
3
4
5
6
7
8
0.0 1.0 2.0 3.0 4.0 5.0
2.0 3.0 4.0 5.0 6.0
Soil Respiration (g C/m2/day)
Organic Carbon Content (%)
SR=1.027 (OCC) + 1.502 R2=0.66