20
RESEARCH ARTICLE • FORSCHUNGSARTIKEL • ARAŞTIRMA MAKALESİ
Submitted:
Submitted: 23.11.2021 Revised: Revised: 20.05.2023 Accepted:
Accepted: 06.03.2023 PublishedPublished Online:Online: 22.06.2023
To cite this article: Kayaçetin, N. V. (2023). Elections and stock market returns: evidence from Borsa Istanbul. Journal of Research in Business, 8(1), 20-40. DOI: 10.54452/jrb.1027577
Ethics Committee: “There is no requirement of Ethics Committee Approval for this study.”
ELECTIONS AND STOCK MARKET RETURNS: EVIDENCE FROM BORSA ISTANBUL
HALK OYLAMALARI VE HİSSE PİYASASI GETİRİLERİ: BORSA İSTANBUL’DAN BULGULAR
Nuri Volkan KAYAÇETİN 1*
Abstract
Stock prices may display predictable patterns around major political events, particularly in emerging market economies where political risk is a key component of asset risk premiums. One distinct event that would be expected to result in an abrupt increase in political risk is elections. Motivated by this notion, we study the returns for a set of indicator and sectoral indices of Borsa Istanbul stocks and the U.S. Dollar–Turkish Lira exchange rate around political elections held in Turkey over 2001–2020. Our tests reveal an accumulation of economically and statistically significant positive abnormal returns for all Borsa Istanbul stock indices and negative abnormal returns for the U.S. Dollar–Turkish Lira exchange rate over a window that starts as early as a month before the election date and extends for two weeks into the post-election period, with the effect being particularly strong in the week that immediately follows the election. Consistent with a political risk-based story, volatility of index returns starts increasing over the same period and plateaus out at a level that is roughly one-and-a-half to two-folds greater than its pre-election period average.
Keywords: Political risk, elections, stock market, abnormal returns, Borsa Istanbul JEL Classification: G10, G12, G15
Öz
Hisse senedi fiyatlarının, özellikle siyasi riskin beklenen risk primlerinin önemli bir bileşeni olduğu gelişmekte olan ekonomilerde, önemli siyasi olaylar etrafında öngörülebilir kalıplar göstermesi beklenebilir. Siyasi riskte belirgin bir artışa yol açabilecek önemli olaylardan biri de seçimlerdir. Bu makalede,bu düşünceden yola çıkılarak Borsa İstanbul gösterge ve sektörel endekslerinin ve Amerikan Doları-Türk Lirası döviz kurunun 2001–2020 yılları arasında Türkiye’de gerçekleştirilen seçimler etrafındaki davranışı incelenmiştir.
Testlerimiz seçim tarihlerinden bir ay önce başlayan ve seçim sonrasında iki hafta devam eden bir pencerede, ağırlıkla seçim gününü takip eden haftada olmak üzere, Borsa Istanbul endekslerinde ekonomik ve istatistiksel olarak anlamlı bir kümülatif pozitif anormal getiri, Amerikan Doları-Türk Lirası döviz kurunda ise negatif bir kümülatif anormal getiri ortaya koymaktadır. Siyasi risk temelli bir hikaye ile tutarlı olarak, günlük endeks getirilerindeki oynaklığın aynı periyot içerisinde artmaya başladığı ve seçim öncesi dönemdeki ortalamasından kabaca bir buçuk ila iki kat daha yüksek bir seviyede doyuma ulaştığı gözlemlenmiştir.
Anahtar Kelimeler: Siyasi risk, seçimler, pay piyasası, anormal getiriler, Borsa Istanbul JEL Sınıflandırması: G10, G12, G15
1* Corresponding Author: Assistant Professor, FMV Işık University, Faculty of Engineering and Nature Sciences, Department of Industrial Engineering,[email protected], ORCID: 0000-0001-7441-8053.
21
Elections and Stock Market Returns: Evidence from Borsa Istanbul
1. Introduction
Governments play an important role in the economy, directly through guiding public investments and expenditures (e.g., Aschauer (1989)) and indirectly by influencing policies pursued by central banks and other major economic institutions (e.g., Haslag (1988)). Given this role, the stability of a government and its economic policies can be expected to have a significant bearing on the risk borne by financial market investors. 1 Following this notion, a large and growing strand of literature studies the impact of political risk on stock returns. Pastor and Veronesi (2013), for instance, devise a theoretical model of government policy choice and demonstrate that political uncertainty instills a significant risk premium into equity returns, the size of which varies as a function of the state of the economy. In line with this notion, Diamonte et al. (1996) and Erb et al. (1996) find that the mean equity return in countries experiencing a reduction in political risk is larger than those in counties experiencing a risk increase, with the effect being more pronounced in emerging markets.
More recently, Dimic et al. (2015) document that political risk is priced in developed, emerging, and frontier markets, with government stability acting as a unique factor for frontier markets.
A distinct event that can be expected to lead to an increase in political risk is elections. Under the efficient markets hypothesis, all relevant information about an election’s outcome will be priced prior to the election date and the stock market response to any event day surprises should occur immediately and in full once the market reopens. Brown et al. (1988), however, argue that usual definitions of rationality do not imply that stock prices should react to major information shocks instantaneously and advance the uncertain information hypothesis (UIH), which holds that a noisy piece of favorable or unfavorable news causes risk-averse investors to set risky asset prices significantly below their conditional expected values and the resolution of uncertainty results in a positive price drift, on average, regardless of the nature of the catalyzing event. Adapted to our setting, the UIH predicts stock prices should remain depressed prior to election dates and a risk relief would take place in the form of a post-election price rally once the election outcome is known and the uncertainty is resolved. This risk relief may begin earlier in the pre-election period if the election outcome becomes evident before the event date or with a delay in the post-election period if the market is unsure about the implications of the observed outcome on future economic activity.
The extant literature on the impact of elections on equity market returns goes back to Niederhoffer et al. (1970) who document significant positive abnormal returns on days immediately preceding and succeeding U.S. presidential elections. Pantzalis et al. (2000) study equity market returns around national elections in thirty-three countries and document positive and significant abnormal returns over a ten-day pre-event period, the magnitude of which varies as a function of political, economic, and press freedom, election timing, and the success or failure of the incumbent. Last, Li and Born (2006), Goodell and Vähäma (2013), and Bialkowski et al. (2008) all demonstrate that political elections tend to induce significant increases in stock market volatility and/or in average stock returns both in the U.S. equity market and on an international scale across many countries.
1 This impact may be expected to be particularly strong in emerging market countries, where the policies followed by key economic institutions such as central banks tend to be closely intertwined with those of the incumbent government.
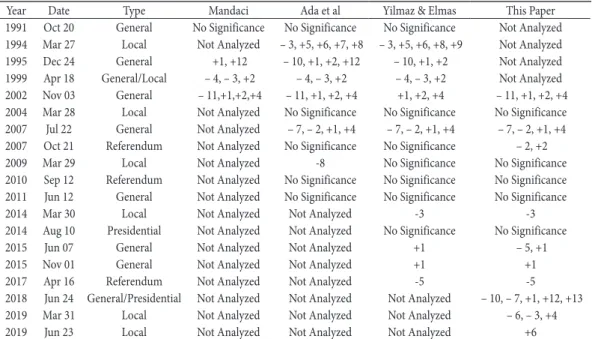
22 While the findings from international markets point to a prevalence of positive abnormal returns and increased volatility around elections, the evidence on Borsa Istanbul (BIST) is limited to four papers and is somewhat conflicting and incomplete in terms of its conclusions. Mandaci (2003) examines a 30-day window centered around general election dates and documents positive and statistically significant post-election abnormal returns for elections of 1995, 1999, and 2002, but not for 1991.
Ada et al (2013) analyze a sample of 12 elections between 1991-2011 and uncover positive post- election abnormal returns for general and local elections. Konak and Guner (2016) study a sample of 12 elections held between 2000–2014 and conclude that the significant abnormal returns over the same 30-day window as in Mandaci (2003) and Ada et al (2013) are predominantly negative. Last, Yılmaz and Elmas (2019) study 16 political elections held between 1991–2017 and report significant abnormal returns (positive in 8 and negative in 6 cases) over a 20-day window centered around the election dates. All four papers, however, examine a single benchmark index (namely, BIST100), focus only on its returns (and thus ignore volatility), and only one (Ada et al, 2013) tests whether the aggregate impact is positive or negative across all the elections studied.
This paper provides a comprehensive analysis of the election period behavior of the Turkish equity market that helps reconcile the evidence on the impact of elections on BIST index returns with one another and with the reciprocating evidence from the U.S. and other foreign markets. Our analysis differs from the extant papers in the literature in that (a) it takes a broader perspective on the subject matter by analyzing a richer set of test assets over an up-to-date sample period; (b) it offers a more complete treatment by jointly examining the return and volatility patterns around elections; (c) it focuses on the aggregate price and statistical significance of election risk across all elections.
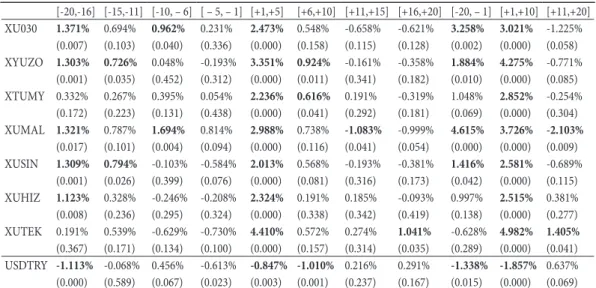
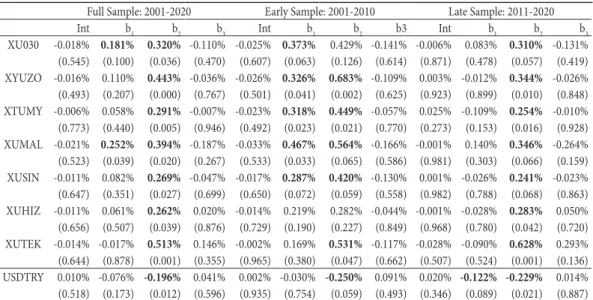
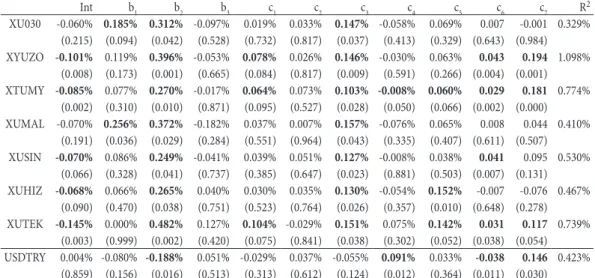
In our event study tests, we examine the daily abnormal returns of various BIST indices around political elections held in Turkey over the period from January 2001 to December 2021. Consistent with the predictions of the UIH, we observe an abnormal positive drift over a 20-day pre-election window and an accumulation of statistically significant and economically large positive abnormal returns amid heightened volatility (one-and-a-half to two-folds greater than the pre-event average) over a 10-day post-election window for all indices. The mean cumulative abnormal return over the pre – and post-election periods combined is 6.28% for an index of the 30 largest and most actively traded BIST stocks (XU030), 6.16% for a value-weighted index of large-to-medium market cap stocks (XYUZO), 3.90% for a benchmark index of medium-to-small market cap stocks (XTUMY), and is significantly greater for finance and technology stocks (8.34% for XUMAL and 6.38% for XUTEK) than for industrial and services stocks (4.00% for XUSIN and 3.51% for XUHIZ).
By way of regressions, we confirm that these effects are consistent across subsamples and robust to controlling for stylized calendar patterns and serial dependencies in returns. The subsample tests reveal that the post-election abnormal performance observed in the event study tests is significant in both the early and the late halves of our sample period, but stronger in the early half. The positive pre-election period drift, however, turns out to be specific to the early half of our sample period.
In regressions that control for calendar effects and lagged returns, we obtain evidence of a strong
23
Elections and Stock Market Returns: Evidence from Borsa Istanbul
turn-of-the-month effect in all stock indices analyzed, a weak Halloween effect 2 in medium – and small-cap stock indices and technology stocks, and a strong Friday effect in service and technology stocks, along with several statistically significant but economically negligible serial dependencies.
The statistical and economic significance of the abnormal election period returns implicated by the loadings on our election period dummies, however, remain robust to the presence of these controls.
The rest of the paper is organized as follows. The next section provides a brief review of the extant literature on the impact of political elections on stock market returns. Section 3 explains the sources and characteristics of our data and explains our event study and regression methodologies. Section 4 presents and discusses the results from our event study analysis in its former half and those from our regression tests in its latter half. Section 5 presents our concluding remarks.
2. Literature Review
There is ample evidence of the role governments and their policies play in spurring or destroying economic growth, either directly through public investments (e.g., Aschauer (1989), Easterly and Rebelo (1993), and Bom and Ligthart (2014)) 3 or indirectly through their influence on policies pursued by key economic institutions such as central banks (e.g., Haslag (1988), Gertler and Karadi (2015), and Aastveit et al. (2017)) 4. Considering the importance of this role, it is conceivable that uncertainty regarding the stability of a government and its policies would have an adverse impact on real economic activity (e.g., Julio and Yook (2012) and Fernandez-Villaverde et al. (2015)). 5
Given its adverse impact on economic activity, political risk should be an important consideration for investors. 6 In line with this notion, Pastor and Veronesi (2013) devise a general equilibrium model of government policy choice and show that political risk should be a significant component
2 Despite the name with which it is commonly referred to, the Halloween effect has nothing to do with the actual Halloween event. The name merely derives from the fact that the period over which the seasonal pattern is observed begins at the end of October, concurrently with Halloween. It is also called the ‘Sell in May’ effect in the literature.
3 Aschauer (1989) finds that public investment has positive direct and indirect effects on private sector output and productivity growth. Easterly and Rebelo (1993) uncover a strong correlation between government budget surplus and investment policies and economic growth. Bom and Ligthart (2014) conduct a meta-analysis of three decades of research on the link between public capital and private output and estimate a positive co-integrating relationship over the long- run between public capital and private output, which is almost thrice as strong as its short-run effects.
4 Haslag (1988) studies monetary policy effects and finds that inflation and reserve requirements are negatively linked to economic growth. Gertler and Karadi (2015) find that unanticipated shocks to monetary policy lead to a significant decline in economic output through their impact on credit costs. Aastveit, Natvik, and Sola (2017) document that monetary policy shocks affect economic activity, with the effect being weaker when economic uncertainty is higher.
5 Julio and Yook (2012) study a large cross-section of companies from across the globe and document slower corporate investment during national election years, with firms reducing their investment expenditures by an average of 4.8%.
Fernandez-Villaverde et al. (2015) find that increasing uncertainty about taxes, social security, and fiscal policy has a negative impact on the economy. For Turkey, Şahinöz and Coşar (2018) show that economic policy uncertainty, which rises around elections and crises, adversely impacts output growth, consumption, and corporate investment.
6 Sialm (2006), for instance, studies the effect of stochastic taxation in a dynamic general equilibrium model and finds that investors require higher risk premia as compensation for the risk introduced by tax changes. Croce, Nguyen, and Schmid (2012) explore the economic impact of countercyclical deficit policies aimed at short-run stabilization and show that such policies increase long-run risk premiums and reduce incentives for economic growth.
24 of the equity premium. Diamonte, Liew, and Stevens (1996) find that the mean quarterly equity market return is greater by 11% in emerging markets and 2.5% in developed markets in countries experiencing a reduction in political risk than in those experiencing an increase. Bilson, Brailsford, and Hooper (2002) document that political risk is more important in explaining return variation in emerging markets than in developed markets. Dimic, Orlov, and Piljak (2015) show that political risk is priced in developed, emerging, and frontier markets alike, government action acting as a common factor in all markets and government stability acting as a unique factor in frontier markets.
A unique event that can be expected to result in increased political risk is elections. The literature on elections and stock market returns goes back to Niederhoffer, Gibbs, and Bullock (1970), who provide evidence of significant positive returns on days immediately preceding and succeeding U.S. presidential elections. Pantzalis, David, and Turtle (2000) analyze equity market returns of 33 countries around national elections and document significant positive abnormal returns over a 10-day pre-election window, which may persist up to four weeks past the election date. Li and Born (2006) examine U.S. presidential elections and find that stock market volatility and average returns both rise if an election lacks a candidate with a dominant lead. Bialkowski, Gottschalk, and Wisniewski (2008) study national elections held in 27 OECD countries and show that the country- specific component of index return volatility can easily double up during the election week. Last, Goodell and Vähäma (2013) show that the volatility of stock market returns tends to increase in response to changes in the probability of success for the eventual winner in line with the idea that investors form and revise expectations about future macroeconomic policy based on these results.
The evidence on the impact of elections on Borsa Istanbul returns is limited to four papers and in conflict with the evidence from international markets and with one another. Mandaci (2003), for instance, examines a 30-day window centered around the four general elections held between 1991 and 2002 and documents positive and statistically significant post-election abnormal returns for the elections of 1995, 1999, and 2002, but not for the election held in 1991. Ada, Bolak, and Suer (2013) analyze 12 elections held between 1991-2011 and uncover positive post-election abnormal returns for general and local elections. Konak and Guner (2016) explore a sample of 12 elections held between 2000–2014 and conclude that the significant abnormal returns over the same 30-day event window as in Mandaci (2003) are predominantly negative. 7 Yılmaz and Elmas (2019) study 16 elections held between 1991–2017 and find statistically significant abnormal returns (positive in 8 and negative in 6 cases) over a 20-day window centered around elections. 8 All four of these papers examine a single index (namely, BIST100), focus only on returns, and study each election
7 This conclusion is made based on a simple count of elections with significantly positive and significantly negative event period abnormal returns. Unfortunately, the significance statistics (p-values) of – cumulative abnormal returns seem to be miscalculated in the paper for elections with positive abnormal returns due to a coding error. The author’s conclusion would be reversed if significance statistics of positive abnormal return periods were computed correctly.
8 An analysis of the cumulative abnormal returns presented in Yılmaz and Elmas (2019) has led us to believe that their abnormal return estimates may be plagued by a simple computational error. The authors, for instance, report negative abnormal returns over a twenty-day window centered around the 2002 general election, while the evidence here and those in Mandaci (2003) and Konak and Guner (2016) point to large and positive abnormal returns. The issue appears to generalize over some of the other elections studied in the paper (e.g., the local election of 2014), which makes it hard to guess the exact number of elections with significant positive or negative cumulative abnormal returns.
25
Elections and Stock Market Returns: Evidence from Borsa Istanbul
as an individual event with the exception of Ada et al (2013). Our paper thus fills a void in this line of literature by jointly analyzing election period returns and volatilities of a richer set of test assets over an up-to-date sample, and by quantifying the aggregate impact of the political risk induced by elections and interpreting it from the looking glass of alternative hypotheses.
Our findings may raise questions about market efficiency. While the idea of efficient markets goes back to earlier work (e.g., Bachelier (1900), Friedman (1953), and Samuelson (1965)), the efficient market hypothesis (EMH) is formally introduced in the landmark paper by Fama (1970), where an efficient market is defined as one in which prices always fully reflect all available information. Fama (1991) examines market efficiency in three forms: weak, semi-strong, and strong. The prices reflect all available information in historical returns under weak-form efficiency, all public information including that in historical returns under semi-strong form efficiency, and all available public and private information under strong-form efficiency. Recent studies testing the weak-form efficiency of the Turkish equity market yield mixed conclusions with some indicating weak form efficiency holds for Borsa Istanbul indices (e.g., Gozbasi et al. (2014) and Yucel (2016)), some rejecting weak form efficiency (e.g., Malcioglu and Aydin (2016), Aliyev (2019), and Hailu and Vural (2020)) and some arguing the weak form efficiency is regime dependent (e.g., Cevik (2018)).
In the context of elections, the EMH predicts that all available information about the outcome of the election should be incorporated in prices prior to the election date and the stock market should respond to any event day surprises immediately and in full, without any return continuations. An alternative hypothesis that may apply to the election period behavior of stock market returns is the uncertain information hypothesis of Brown, Harlow, and Tinic (1988). The authors argue that usual definitions of rationality do not imply that security prices should react to major information surprises instantaneously and show that a noisy and major piece of information, regardless of whether it is favorable or unfavorable, would cause a market comprised of risk-averse investors to set risky asset prices significantly below their conditional expected values and gradual resolution of uncertainty surrounding the information event would result in a positive price drift following its release. Mehdian, Nas, and Perry (2018) and Akkoc and Ozkan (2013) provide evidence that demonstrates that Borsa Istanbul returns behave in a manner consistent with the predictions of the UIH around major information events, with the pattern being more significant in earlier periods.
3. Data and Methodology 3.1. Data Sources and Characteristics
Political elections analyzed in this paper include: (a) general elections, which are cast to choose the members of the parliament; (b) local elections, cast to select the majors of municipality areas; (c) presidential elections, cast to select the president of the state; and (4) constitutional referenda, cast on an as-needed basis if the incumbent government fails to achieve the supermajority required to make constitutional amendments. Historically, local and general elections in Turkey were held via direct ballot every 5 years and presidential elections were held through indirect proxy voting every 7 years
26 unless an early or late election is declared. Following the constitutional referendum of October 2007, a 4-year cycle was adopted for general elections and presidential elections moved to a 5-year cycle and direct ballot, while local elections continued to be held at a 5-year cycle.
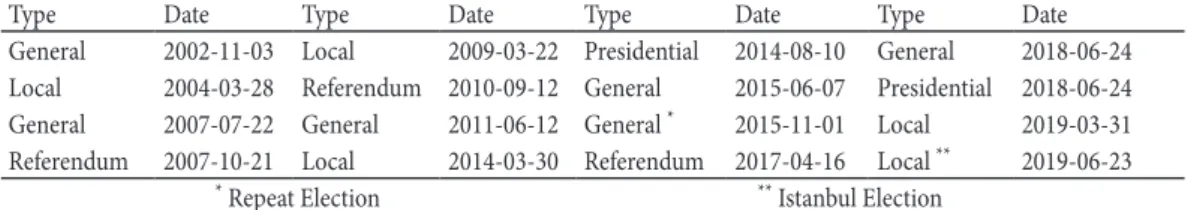
Table 1: Types and Dates of Political Elections in Turkey: 2001–2020.
Type Date Type Date Type Date Type Date
General 2002-11-03 Local 2009-03-22 Presidential 2014-08-10 General 2018-06-24 Local 2004-03-28 Referendum 2010-09-12 General 2015-06-07 Presidential 2018-06-24 General 2007-07-22 General 2011-06-12 General * 2015-11-01 Local 2019-03-31 Referendum 2007-10-21 Local 2014-03-30 Referendum 2017-04-16 Local ** 2019-06-23
* Repeat Election ** Istanbul Election
This table lists the dates of all political elections held in Turkey between January 1st, 2001, and December 31st, 2020. The list includes two repeat elections. The first is the repeat general election that was held on November 1st, 2015, due to an electoral lock-down that prevented the formation of the government following the original general election on June 7th, 2015. The second is the Istanbul municipality repeat local election held on June 23rd, 2019, that ensued after multiple vote recounts due to a tight race between the incumbent party candidate and the eventual winner.
Data on political election dates and outcomes come from the website of the Supreme Election Council (www.ysk.gov.tr), a venue that contains comprehensive information on elections held in Turkey. The type and date of each election held over the period from 1/1/2001 to 31/12/2020 are listed chronologically in Table 1. The full list of elections in our sample is comprised of six general elections (including one repeat election), four municipal elections, three presidential elections (one coinciding with a general election), and three constitutional referenda, suggesting that Turkey has gone to the ballot a total of fifteen times in our twenty-year sample period. Due to the limited number of political elections in our sample, we choose not to differentiate between different types of elections in our analysis and treat each election as a distinct event that may have significant repercussions on the stability and longevity of the incumbent government and its socio-economic policies, an assumption that likely holds well in Turkey’s fragile political environment.
In our analysis, we use seven different indices of Borsa Istanbul (BIST) stocks and the USDTRY exchange rate as test assets. The stock indices analyzed include: XU030—a value-weighted index of the top 30 largest and most actively traded BIST stocks (i.e. the BIST30 index); XYUZO—a value- weighted index of the stocks that remain once the BIST30 components are removed from an index of the top 100 largest and most actively traded BIST stocks (i.e., the BIST100 index); XTUMY—a value- weighted index of the stocks that remain once the BIST100 components are removed from a value- weighted index of all BIST stocks; and XUMAL, XUSIN, XUHIZ, and XUTEK—value-weighted indices of stocks issued by firms operating in the financial, industrial, service, and technology sectors, respectively. Given their ‘residual’ nature, XYUZO and XTUMY are used as proxies that capture the performance of medium – and small-cap BIST stocks.
27
Elections and Stock Market Returns: Evidence from Borsa Istanbul Table 2: Information on Important Borsa Istanbul Indices
Index Name Symbol Start Date End Date Description
BIST 30 XU030 1997-01-01 2020-12-31 A value-weighted index of the 30 largest & most actively traded stocks.
BIST 100 XU100 1988-01-01 2020-12-31 A value-weighted index of the 100 largest & most actively traded stocks.
BIST All XUTUM 1997-01-01 2020-12-31 A comprehensive value-weighted index of all BIST stocks.
BIST 100 – 30 XYUZO 2009-01-01 2020-12-31 A value-weighted index of the BIST100 stocks minus the BIST30 stocks.
BIST All – 100 XTUMY 2009-01-01 2020-12-31 A value-weighted index of all BIST stocks minus the BIST100 stocks.
BIST Financials XUMAL 1997-02-01 2020-12-31 A value-weighted index of the stocks issued by financial sector companies.
BIST Industrials XUSIN 1997-01-01 2020-12-31 A value-weighted index of the stocks issued by industrial sector companies.
BIST Services XUHIZ 1997-01-01 2020-12-31 A value-weighted index of the stocks issued by services sector companies.
BIST Technology XUTEK 2000-07-01 2020-12-31 A value-weighted index of the stocks issued by technology sector companies.
This table reports the names, symbols, data ranges, and brief descriptions of the stock market indices we use as test assets. All indices listed herein are free-float market capitalization-weighted price indices that do not account for cash dividends. XU030 and XU100 are indices of a selection of largest and most actively traded BIST stocks. XUTUM is an index all of stocks. XYUZO and XTUMY are residual indices comprised of a smaller subset of XU100 and XUTUM stocks. XUMAL, XUSIN, XUHIZ, and XUTEK are indices of financial, industrial, services, and technology stocks.
Data on daily closing levels of all stock indices are obtained from the Thomson Reuters database, while those for the USDTRY exchange rate come from the website of the Central Bank of Turkey.
Daily price data is available starting on 1/1/1988 for XU100; on 1/1/1997 for XU030, XUTUM, XUMAL, XUSIN, and XUHIZ; on 1/7/2000 for XUTEK; and on 1/1/2009 for XYUZO and XTUMY.
We manually compute daily returns on XYUZO and XTUMY going back to 1/1/2001 using daily returns on XU030, XU100, and XUTUM and set our sample period between 1/1/2001 and 31/12/2020. The daily return on trading day
9
of the top 30 largest and most actively traded BIST stocks (i.e. the BIST30 index); XYUZO—a value-weighted index of the stocks that remain once the BIST30 components are removed from an index of the top 100 largest and most actively traded BIST stocks (i.e., the BIST100 index);
XTUMY—a value-weighted index of the stocks that remain once the BIST100 components are removed from a value-weighted index of all BIST stocks; and XUMAL, XUSIN, XUHIZ, and XUTEK—value-weighted indices of stocks issued by firms operating in the financial, industrial, service, and technology sectors, respectively. Given their ‘residual’ nature, XYUZO and XTUMY are used as proxies that capture the performance of medium- and small-cap BIST stocks.
Table 2: Information on Important Borsa Istanbul Indices Index Name Symbol Start Date End Date Description
BIST 30 XU030 1997-01-01 2020-12-31 A value-weighted index of the 30 largest & most actively traded stocks.
BIST 100 XU100 1988-01-01 2020-12-31 A value-weighted index of the 100 largest & most actively traded stocks.
BIST All XUTUM 1997-01-01 2020-12-31 A comprehensive value-weighted index of all BIST stocks.
BIST 100 - 30 XYUZO 2009-01-01 2020-12-31 A value-weighted index of the BIST100 stocks minus the BIST30 stocks.
BIST All - 100 XTUMY 2009-01-01 2020-12-31 A value-weighted index of all BIST stocks minus the BIST100 stocks.
BIST Financials XUMAL 1997-02-01 2020-12-31 A value-weighted index of the stocks issued by financial sector companies.
BIST Industrials XUSIN 1997-01-01 2020-12-31 A value-weighted index of the stocks issued by industrial sector companies.
BIST Services XUHIZ 1997-01-01 2020-12-31 A value-weighted index of the stocks issued by services sector companies.
BIST Technology XUTEK 2000-07-01 2020-12-31 A value-weighted index of the stocks issued by technology sector companies.
This table reports the names, symbols, data ranges, and brief descriptions of the stock market indices we use as test assets. All indices listed herein are free-float market capitalization-weighted price indices that do not account for cash dividends. XU030 and XU100 are indices of a selection of largest and most actively traded BIST stocks. XUTUM is an index all of stocks. XYUZO and XTUMY are residual indices comprised of a smaller subset of XU100 and XUTUM stocks. XUMAL, XUSIN, XUHIZ, and XUTEK are indices of financial, industrial, services, and technology stocks.
Data on daily closing levels of all stock indices are obtained from the Thomson Reuters database, while those for the USDTRY exchange rate come from the website of the Central Bank of Turkey
.Daily price data is available starting on 1/1/1988 for XU100; on 1/1/1997 for XU030, XUTUM, XUMAL, XUSIN, and XUHIZ; on 1/7/2000 for XUTEK; and on 1/1/2009 for XYUZO and XTUMY. We manually compute daily returns on XYUZO and XTUMY going back to 1/1/2001 using daily returns on XU030, XU100, and XUTUM and set our sample period between 1/1/2001 and 31/12/2020. The daily return on trading day
𝑡𝑡is then computed as
𝑅𝑅𝑡𝑡= (𝑃𝑃𝑡𝑡− 𝑃𝑃𝑡𝑡−1)/𝑃𝑃𝑡𝑡−1,where
𝑃𝑃𝑡𝑡and
𝑃𝑃𝑡𝑡−1reflect closing prices observed at the end of trading days
𝑡𝑡 and 𝑡𝑡 − 1. To ensure that our results are not driven by extreme positive or negative observations, we trim the top and bottom 0.25% extreme observations of daily returns for each test asset and apply a log transformation, 𝑟𝑟
𝑡𝑡= 𝑙𝑙𝑙𝑙(𝑅𝑅
𝑡𝑡) , to facilitate the compounding of returns across multiple trading days.
is then computed as
9
of the top 30 largest and most actively traded BIST stocks (i.e. the BIST30 index); XYUZO—a value-weighted index of the stocks that remain once the BIST30 components are removed from an index of the top 100 largest and most actively traded BIST stocks (i.e., the BIST100 index);
XTUMY—a value-weighted index of the stocks that remain once the BIST100 components are removed from a value-weighted index of all BIST stocks; and XUMAL, XUSIN, XUHIZ, and XUTEK—value-weighted indices of stocks issued by firms operating in the financial, industrial, service, and technology sectors, respectively. Given their ‘residual’ nature, XYUZO and XTUMY are used as proxies that capture the performance of medium- and small-cap BIST stocks.
Table 2: Information on Important Borsa Istanbul Indices Index Name Symbol Start Date End Date Description
BIST 30 XU030 1997-01-01 2020-12-31 A value-weighted index of the 30 largest & most actively traded stocks.
BIST 100 XU100 1988-01-01 2020-12-31 A value-weighted index of the 100 largest & most actively traded stocks.
BIST All XUTUM 1997-01-01 2020-12-31 A comprehensive value-weighted index of all BIST stocks.
BIST 100 - 30 XYUZO 2009-01-01 2020-12-31 A value-weighted index of the BIST100 stocks minus the BIST30 stocks.
BIST All - 100 XTUMY 2009-01-01 2020-12-31 A value-weighted index of all BIST stocks minus the BIST100 stocks.
BIST Financials XUMAL 1997-02-01 2020-12-31 A value-weighted index of the stocks issued by financial sector companies.
BIST Industrials XUSIN 1997-01-01 2020-12-31 A value-weighted index of the stocks issued by industrial sector companies.
BIST Services XUHIZ 1997-01-01 2020-12-31 A value-weighted index of the stocks issued by services sector companies.
BIST Technology XUTEK 2000-07-01 2020-12-31 A value-weighted index of the stocks issued by technology sector companies.
This table reports the names, symbols, data ranges, and brief descriptions of the stock market indices we use as test assets. All indices listed herein are free-float market capitalization-weighted price indices that do not account for cash dividends. XU030 and XU100 are indices of a selection of largest and most actively traded BIST stocks. XUTUM is an index all of stocks. XYUZO and XTUMY are residual indices comprised of a smaller subset of XU100 and XUTUM stocks. XUMAL, XUSIN, XUHIZ, and XUTEK are indices of financial, industrial, services, and technology stocks.
Data on daily closing levels of all stock indices are obtained from the Thomson Reuters database, while those for the USDTRY exchange rate come from the website of the Central Bank of Turkey
.Daily price data is available starting on 1/1/1988 for XU100; on 1/1/1997 for XU030, XUTUM, XUMAL, XUSIN, and XUHIZ; on 1/7/2000 for XUTEK; and on 1/1/2009 for XYUZO and XTUMY. We manually compute daily returns on XYUZO and XTUMY going back to 1/1/2001 using daily returns on XU030, XU100, and XUTUM and set our sample period between 1/1/2001 and 31/12/2020. The daily return on trading day
𝑡𝑡is then computed as
𝑅𝑅𝑡𝑡= (𝑃𝑃𝑡𝑡− 𝑃𝑃𝑡𝑡−1)/𝑃𝑃𝑡𝑡−1,where
𝑃𝑃𝑡𝑡and
𝑃𝑃𝑡𝑡−1reflect closing prices observed at the end of trading days
𝑡𝑡 and 𝑡𝑡 − 1. To ensure that our results are not driven by extreme positive or negative observations, we trim the top and bottom 0.25% extreme observations of daily returns for each test asset and apply a log transformation, 𝑟𝑟
𝑡𝑡= 𝑙𝑙𝑙𝑙(𝑅𝑅
𝑡𝑡) , to facilitate the compounding of returns across multiple trading days.
where
9
of the top 30 largest and most actively traded BIST stocks (i.e. the BIST30 index); XYUZO—a value-weighted index of the stocks that remain once the BIST30 components are removed from an index of the top 100 largest and most actively traded BIST stocks (i.e., the BIST100 index);
XTUMY—a value-weighted index of the stocks that remain once the BIST100 components are removed from a value-weighted index of all BIST stocks; and XUMAL, XUSIN, XUHIZ, and XUTEK—value-weighted indices of stocks issued by firms operating in the financial, industrial, service, and technology sectors, respectively. Given their ‘residual’ nature, XYUZO and XTUMY are used as proxies that capture the performance of medium- and small-cap BIST stocks.
Table 2: Information on Important Borsa Istanbul Indices Index Name Symbol Start Date End Date Description
BIST 30 XU030 1997-01-01 2020-12-31 A value-weighted index of the 30 largest & most actively traded stocks.
BIST 100 XU100 1988-01-01 2020-12-31 A value-weighted index of the 100 largest & most actively traded stocks.
BIST All XUTUM 1997-01-01 2020-12-31 A comprehensive value-weighted index of all BIST stocks.
BIST 100 - 30 XYUZO 2009-01-01 2020-12-31 A value-weighted index of the BIST100 stocks minus the BIST30 stocks.
BIST All - 100 XTUMY 2009-01-01 2020-12-31 A value-weighted index of all BIST stocks minus the BIST100 stocks.
BIST Financials XUMAL 1997-02-01 2020-12-31 A value-weighted index of the stocks issued by financial sector companies.
BIST Industrials XUSIN 1997-01-01 2020-12-31 A value-weighted index of the stocks issued by industrial sector companies.
BIST Services XUHIZ 1997-01-01 2020-12-31 A value-weighted index of the stocks issued by services sector companies.
BIST Technology XUTEK 2000-07-01 2020-12-31 A value-weighted index of the stocks issued by technology sector companies.
This table reports the names, symbols, data ranges, and brief descriptions of the stock market indices we use as test assets. All indices listed herein are free-float market capitalization-weighted price indices that do not account for cash dividends. XU030 and XU100 are indices of a selection of largest and most actively traded BIST stocks. XUTUM is an index all of stocks. XYUZO and XTUMY are residual indices comprised of a smaller subset of XU100 and XUTUM stocks. XUMAL, XUSIN, XUHIZ, and XUTEK are indices of financial, industrial, services, and technology stocks.
Data on daily closing levels of all stock indices are obtained from the Thomson Reuters database, while those for the USDTRY exchange rate come from the website of the Central Bank of Turkey
.Daily price data is available starting on 1/1/1988 for XU100; on 1/1/1997 for XU030, XUTUM, XUMAL, XUSIN, and XUHIZ; on 1/7/2000 for XUTEK; and on 1/1/2009 for XYUZO and XTUMY. We manually compute daily returns on XYUZO and XTUMY going back to 1/1/2001 using daily returns on XU030, XU100, and XUTUM and set our sample period between 1/1/2001 and 31/12/2020. The daily return on trading day
𝑡𝑡is then computed as
𝑅𝑅𝑡𝑡= (𝑃𝑃𝑡𝑡− 𝑃𝑃𝑡𝑡−1)/𝑃𝑃𝑡𝑡−1,where
𝑃𝑃𝑡𝑡and
𝑃𝑃𝑡𝑡−1reflect closing prices observed at the end of trading days
𝑡𝑡 and 𝑡𝑡 − 1. To ensure that our results are not driven by extreme positive or negative observations, we trim the top and bottom 0.25% extreme observations of daily returns for each test asset and apply a log transformation, 𝑟𝑟
𝑡𝑡= 𝑙𝑙𝑙𝑙(𝑅𝑅
𝑡𝑡) , to facilitate the compounding of returns across multiple trading days.
and
9
of the top 30 largest and most actively traded BIST stocks (i.e. the BIST30 index); XYUZO—a value-weighted index of the stocks that remain once the BIST30 components are removed from an index of the top 100 largest and most actively traded BIST stocks (i.e., the BIST100 index);
XTUMY—a value-weighted index of the stocks that remain once the BIST100 components are removed from a value-weighted index of all BIST stocks; and XUMAL, XUSIN, XUHIZ, and XUTEK—value-weighted indices of stocks issued by firms operating in the financial, industrial, service, and technology sectors, respectively. Given their ‘residual’ nature, XYUZO and XTUMY are used as proxies that capture the performance of medium- and small-cap BIST stocks.
Table 2: Information on Important Borsa Istanbul Indices Index Name Symbol Start Date End Date Description
BIST 30 XU030 1997-01-01 2020-12-31 A value-weighted index of the 30 largest & most actively traded stocks.
BIST 100 XU100 1988-01-01 2020-12-31 A value-weighted index of the 100 largest & most actively traded stocks.
BIST All XUTUM 1997-01-01 2020-12-31 A comprehensive value-weighted index of all BIST stocks.
BIST 100 - 30 XYUZO 2009-01-01 2020-12-31 A value-weighted index of the BIST100 stocks minus the BIST30 stocks.
BIST All - 100 XTUMY 2009-01-01 2020-12-31 A value-weighted index of all BIST stocks minus the BIST100 stocks.
BIST Financials XUMAL 1997-02-01 2020-12-31 A value-weighted index of the stocks issued by financial sector companies.
BIST Industrials XUSIN 1997-01-01 2020-12-31 A value-weighted index of the stocks issued by industrial sector companies.
BIST Services XUHIZ 1997-01-01 2020-12-31 A value-weighted index of the stocks issued by services sector companies.
BIST Technology XUTEK 2000-07-01 2020-12-31 A value-weighted index of the stocks issued by technology sector companies.
This table reports the names, symbols, data ranges, and brief descriptions of the stock market indices we use as test assets. All indices listed herein are free-float market capitalization-weighted price indices that do not account for cash dividends. XU030 and XU100 are indices of a selection of largest and most actively traded BIST stocks. XUTUM is an index all of stocks. XYUZO and XTUMY are residual indices comprised of a smaller subset of XU100 and XUTUM stocks. XUMAL, XUSIN, XUHIZ, and XUTEK are indices of financial, industrial, services, and technology stocks.
Data on daily closing levels of all stock indices are obtained from the Thomson Reuters database, while those for the USDTRY exchange rate come from the website of the Central Bank of Turkey
.Daily price data is available starting on 1/1/1988 for XU100; on 1/1/1997 for XU030, XUTUM, XUMAL, XUSIN, and XUHIZ; on 1/7/2000 for XUTEK; and on 1/1/2009 for XYUZO and XTUMY. We manually compute daily returns on XYUZO and XTUMY going back to 1/1/2001 using daily returns on XU030, XU100, and XUTUM and set our sample period between 1/1/2001 and 31/12/2020. The daily return on trading day
𝑡𝑡is then computed as
𝑅𝑅𝑡𝑡= (𝑃𝑃𝑡𝑡− 𝑃𝑃𝑡𝑡−1)/𝑃𝑃𝑡𝑡−1,where
𝑃𝑃𝑡𝑡and
𝑃𝑃𝑡𝑡−1reflect closing prices observed at the end of trading days
𝑡𝑡 and 𝑡𝑡 − 1. To ensure that our results are not driven by extreme positive or negative observations, we trim the top and bottom 0.25% extreme observations of daily returns for each test asset and apply a log transformation, 𝑟𝑟
𝑡𝑡= 𝑙𝑙𝑙𝑙(𝑅𝑅
𝑡𝑡) , to facilitate the compounding of returns across multiple trading days.
reflect closing prices observed at the end of trading days
9
of the top 30 largest and most actively traded BIST stocks (i.e. the BIST30 index); XYUZO—a value-weighted index of the stocks that remain once the BIST30 components are removed from an index of the top 100 largest and most actively traded BIST stocks (i.e., the BIST100 index);
XTUMY—a value-weighted index of the stocks that remain once the BIST100 components are removed from a value-weighted index of all BIST stocks; and XUMAL, XUSIN, XUHIZ, and XUTEK—value-weighted indices of stocks issued by firms operating in the financial, industrial, service, and technology sectors, respectively. Given their ‘residual’ nature, XYUZO and XTUMY are used as proxies that capture the performance of medium- and small-cap BIST stocks.
Table 2: Information on Important Borsa Istanbul Indices Index Name Symbol Start Date End Date Description
BIST 30 XU030 1997-01-01 2020-12-31 A value-weighted index of the 30 largest & most actively traded stocks.
BIST 100 XU100 1988-01-01 2020-12-31 A value-weighted index of the 100 largest & most actively traded stocks.
BIST All XUTUM 1997-01-01 2020-12-31 A comprehensive value-weighted index of all BIST stocks.
BIST 100 - 30 XYUZO 2009-01-01 2020-12-31 A value-weighted index of the BIST100 stocks minus the BIST30 stocks.
BIST All - 100 XTUMY 2009-01-01 2020-12-31 A value-weighted index of all BIST stocks minus the BIST100 stocks.
BIST Financials XUMAL 1997-02-01 2020-12-31 A value-weighted index of the stocks issued by financial sector companies.
BIST Industrials XUSIN 1997-01-01 2020-12-31 A value-weighted index of the stocks issued by industrial sector companies.
BIST Services XUHIZ 1997-01-01 2020-12-31 A value-weighted index of the stocks issued by services sector companies.
BIST Technology XUTEK 2000-07-01 2020-12-31 A value-weighted index of the stocks issued by technology sector companies.
This table reports the names, symbols, data ranges, and brief descriptions of the stock market indices we use as test assets. All indices listed herein are free-float market capitalization-weighted price indices that do not account for cash dividends. XU030 and XU100 are indices of a selection of largest and most actively traded BIST stocks. XUTUM is an index all of stocks. XYUZO and XTUMY are residual indices comprised of a smaller subset of XU100 and XUTUM stocks. XUMAL, XUSIN, XUHIZ, and XUTEK are indices of financial, industrial, services, and technology stocks.
Data on daily closing levels of all stock indices are obtained from the Thomson Reuters database, while those for the USDTRY exchange rate come from the website of the Central Bank of Turkey
.Daily price data is available starting on 1/1/1988 for XU100; on 1/1/1997 for XU030, XUTUM, XUMAL, XUSIN, and XUHIZ; on 1/7/2000 for XUTEK; and on 1/1/2009 for XYUZO and XTUMY. We manually compute daily returns on XYUZO and XTUMY going back to 1/1/2001 using daily returns on XU030, XU100, and XUTUM and set our sample period between 1/1/2001 and 31/12/2020. The daily return on trading day
𝑡𝑡is then computed as
𝑅𝑅𝑡𝑡= (𝑃𝑃𝑡𝑡− 𝑃𝑃𝑡𝑡−1)/𝑃𝑃𝑡𝑡−1,where
𝑃𝑃𝑡𝑡and
𝑃𝑃𝑡𝑡−1reflect closing prices observed at the end of trading days
𝑡𝑡 and 𝑡𝑡 − 1. To ensure that our results are not driven by extreme positive or negative observations, we trim the top and bottom 0.25% extreme observations of daily returns for each test asset and apply a log transformation, 𝑟𝑟
𝑡𝑡= 𝑙𝑙𝑙𝑙(𝑅𝑅
𝑡𝑡) , to facilitate the compounding of returns across multiple trading days.
and
9
of the top 30 largest and most actively traded BIST stocks (i.e. the BIST30 index); XYUZO—a value-weighted index of the stocks that remain once the BIST30 components are removed from an index of the top 100 largest and most actively traded BIST stocks (i.e., the BIST100 index);
XTUMY—a value-weighted index of the stocks that remain once the BIST100 components are removed from a value-weighted index of all BIST stocks; and XUMAL, XUSIN, XUHIZ, and XUTEK—value-weighted indices of stocks issued by firms operating in the financial, industrial, service, and technology sectors, respectively. Given their ‘residual’ nature, XYUZO and XTUMY are used as proxies that capture the performance of medium- and small-cap BIST stocks.
Table 2: Information on Important Borsa Istanbul Indices Index Name Symbol Start Date End Date Description
BIST 30 XU030 1997-01-01 2020-12-31 A value-weighted index of the 30 largest & most actively traded stocks.
BIST 100 XU100 1988-01-01 2020-12-31 A value-weighted index of the 100 largest & most actively traded stocks.
BIST All XUTUM 1997-01-01 2020-12-31 A comprehensive value-weighted index of all BIST stocks.
BIST 100 - 30 XYUZO 2009-01-01 2020-12-31 A value-weighted index of the BIST100 stocks minus the BIST30 stocks.
BIST All - 100 XTUMY 2009-01-01 2020-12-31 A value-weighted index of all BIST stocks minus the BIST100 stocks.
BIST Financials XUMAL 1997-02-01 2020-12-31 A value-weighted index of the stocks issued by financial sector companies.
BIST Industrials XUSIN 1997-01-01 2020-12-31 A value-weighted index of the stocks issued by industrial sector companies.
BIST Services XUHIZ 1997-01-01 2020-12-31 A value-weighted index of the stocks issued by services sector companies.
BIST Technology XUTEK 2000-07-01 2020-12-31 A value-weighted index of the stocks issued by technology sector companies.
This table reports the names, symbols, data ranges, and brief descriptions of the stock market indices we use as test assets. All indices listed herein are free-float market capitalization-weighted price indices that do not account for cash dividends. XU030 and XU100 are indices of a selection of largest and most actively traded BIST stocks. XUTUM is an index all of stocks. XYUZO and XTUMY are residual indices comprised of a smaller subset of XU100 and XUTUM stocks. XUMAL, XUSIN, XUHIZ, and XUTEK are indices of financial, industrial, services, and technology stocks.
Data on daily closing levels of all stock indices are obtained from the Thomson Reuters database, while those for the USDTRY exchange rate come from the website of the Central Bank of Turkey
.Daily price data is available starting on 1/1/1988 for XU100; on 1/1/1997 for XU030, XUTUM, XUMAL, XUSIN, and XUHIZ; on 1/7/2000 for XUTEK; and on 1/1/2009 for XYUZO and XTUMY. We manually compute daily returns on XYUZO and XTUMY going back to 1/1/2001 using daily returns on XU030, XU100, and XUTUM and set our sample period between 1/1/2001 and 31/12/2020. The daily return on trading day
𝑡𝑡is then computed as
𝑅𝑅𝑡𝑡= (𝑃𝑃𝑡𝑡− 𝑃𝑃𝑡𝑡−1)/𝑃𝑃𝑡𝑡−1,where
𝑃𝑃𝑡𝑡and
𝑃𝑃𝑡𝑡−1reflect closing prices observed at the end of trading days
𝑡𝑡 and 𝑡𝑡 − 1. To ensure that our results are not driven by extreme positive or negative observations, we trim the top and bottom 0.25% extreme observations of daily returns for each test asset and apply a log transformation, 𝑟𝑟
𝑡𝑡= 𝑙𝑙𝑙𝑙(𝑅𝑅
𝑡𝑡) , to facilitate the compounding of returns across multiple trading days.
. To ensure that our results are not driven by extreme positive or negative observations, we trim the top and bottom 0.25% extreme observations of daily returns for each test asset and apply a log transformation,
9
of the top 30 largest and most actively traded BIST stocks (i.e. the BIST30 index); XYUZO—a value-weighted index of the stocks that remain once the BIST30 components are removed from an index of the top 100 largest and most actively traded BIST stocks (i.e., the BIST100 index);
XTUMY—a value-weighted index of the stocks that remain once the BIST100 components are removed from a value-weighted index of all BIST stocks; and XUMAL, XUSIN, XUHIZ, and XUTEK—value-weighted indices of stocks issued by firms operating in the financial, industrial, service, and technology sectors, respectively. Given their ‘residual’ nature, XYUZO and XTUMY are used as proxies that capture the performance of medium- and small-cap BIST stocks.
Table 2: Information on Important Borsa Istanbul Indices Index Name Symbol Start Date End Date Description
BIST 30 XU030 1997-01-01 2020-12-31 A value-weighted index of the 30 largest & most actively traded stocks.
BIST 100 XU100 1988-01-01 2020-12-31 A value-weighted index of the 100 largest & most actively traded stocks.
BIST All XUTUM 1997-01-01 2020-12-31 A comprehensive value-weighted index of all BIST stocks.
BIST 100 - 30 XYUZO 2009-01-01 2020-12-31 A value-weighted index of the BIST100 stocks minus the BIST30 stocks.
BIST All - 100 XTUMY 2009-01-01 2020-12-31 A value-weighted index of all BIST stocks minus the BIST100 stocks.
BIST Financials XUMAL 1997-02-01 2020-12-31 A value-weighted index of the stocks issued by financial sector companies.
BIST Industrials XUSIN 1997-01-01 2020-12-31 A value-weighted index of the stocks issued by industrial sector companies.
BIST Services XUHIZ 1997-01-01 2020-12-31 A value-weighted index of the stocks issued by services sector companies.
BIST Technology XUTEK 2000-07-01 2020-12-31 A value-weighted index of the stocks issued by technology sector companies.
This table reports the names, symbols, data ranges, and brief descriptions of the stock market indices we use as test assets. All indices listed herein are free-float market capitalization-weighted price indices that do not account for cash dividends. XU030 and XU100 are indices of a selection of largest and most actively traded BIST stocks. XUTUM is an index all of stocks. XYUZO and XTUMY are residual indices comprised of a smaller subset of XU100 and XUTUM stocks. XUMAL, XUSIN, XUHIZ, and XUTEK are indices of financial, industrial, services, and technology stocks.
Data on daily closing levels of all stock indices are obtained from the Thomson Reuters database, while those for the USDTRY exchange rate come from the website of the Central Bank of Turkey
.Daily price data is available starting on 1/1/1988 for XU100; on 1/1/1997 for XU030, XUTUM, XUMAL, XUSIN, and XUHIZ; on 1/7/2000 for XUTEK; and on 1/1/2009 for XYUZO and XTUMY. We manually compute daily returns on XYUZO and XTUMY going back to 1/1/2001 using daily returns on XU030, XU100, and XUTUM and set our sample period between 1/1/2001 and 31/12/2020. The daily return on trading day
𝑡𝑡is then computed as
𝑅𝑅𝑡𝑡= (𝑃𝑃𝑡𝑡− 𝑃𝑃𝑡𝑡−1)/𝑃𝑃𝑡𝑡−1,where
𝑃𝑃𝑡𝑡and
𝑃𝑃𝑡𝑡−1reflect closing prices observed at the end of trading days
𝑡𝑡 and 𝑡𝑡 − 1. To ensure that our results are not driven by extreme positive or negative observations, we trim the top and bottom 0.25% extreme observations of daily returns for each test asset and apply a log transformation, 𝑟𝑟
𝑡𝑡= 𝑙𝑙𝑙𝑙(𝑅𝑅
𝑡𝑡) , to facilitate the compounding of returns across multiple trading days.
, to facilitate the compounding of returns across multiple trading days.Table 3 reports the descriptive statistics of daily raw returns on our test assets in its left panel. Over the period from 1/1/2001 to 31/12/2020, the mean daily return is 0.072% with a standard deviation of 2.05% and extreme values of – 18.18% and 14.72% for XU030; 0.065% with a standard deviation of 1.68% and extreme values of – 17.71% and 11.37% for XYUZO; 0.082% with a standard deviation of 1.45% and extreme values of – 15.71% and 11.71% for XTUMY; and 0.055% with a standard deviation of 1.33% and extremes of – 10.45% and 52.73% for USDTRY. For the sectoral indices, the mean daily return is 0.075% with a standard deviation of 2.25% for XUMAL; 0.077% with a standard
28 deviation of 1.66% for XUSIN; 0.068% with a standard deviation of 1.76% for XUHIZ; and 0.070%
with a standard deviation of 2.14% for XUTEK. The first-order daily return autocorrelations of all indices are statistically insignificant and close to zero.
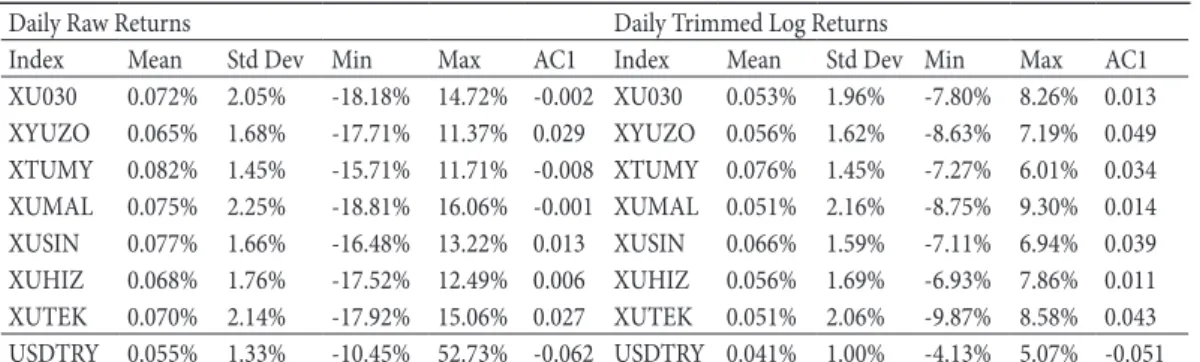
Table 3: Descriptive Statistics of Daily Returns on Borsa Istanbul Indices and USD/TRY Exchange Rate
Daily Raw Returns Daily Trimmed Log Returns
Index Mean Std Dev Min Max AC1 Index Mean Std Dev Min Max AC1
XU030 0.072% 2.05% -18.18% 14.72% -0.002 XU030 0.053% 1.96% -7.80% 8.26% 0.013 XYUZO 0.065% 1.68% -17.71% 11.37% 0.029 XYUZO 0.056% 1.62% -8.63% 7.19% 0.049 XTUMY 0.082% 1.45% -15.71% 11.71% -0.008 XTUMY 0.076% 1.45% -7.27% 6.01% 0.034 XUMAL 0.075% 2.25% -18.81% 16.06% -0.001 XUMAL 0.051% 2.16% -8.75% 9.30% 0.014 XUSIN 0.077% 1.66% -16.48% 13.22% 0.013 XUSIN 0.066% 1.59% -7.11% 6.94% 0.039 XUHIZ 0.068% 1.76% -17.52% 12.49% 0.006 XUHIZ 0.056% 1.69% -6.93% 7.86% 0.011 XUTEK 0.070% 2.14% -17.92% 15.06% 0.027 XUTEK 0.051% 2.06% -9.87% 8.58% 0.043 USDTRY 0.055% 1.33% -10.45% 52.73% -0.062 USDTRY 0.041% 1.00% -4.13% 5.07% -0.051 This table reports the means and standard deviations (Mean and StDev), the minimum and maximum values (Min and Max), and the first-order autocorrelations (AC1) of daily raw and trimmed log returns for three indicator indices (XU030, XYUZO, XTUMY) and four sectoral indices (XUMAL, XUSIN, XUHIZ, XUTEK) of Borsa Istanbul stocks in addition to the U.S. dollar–
Turkish lira exchange rate (USDTRY) over the period from 1/1/2001 to 31/12/2020. Trimmed returns exclude 0.25% extreme observations on each tail of the distribution. The stock indices are as described in Table 2.
The descriptive statistics of daily trimmed log returns are presented in the right panel. The sample mean is 0.053% with a standard deviation of 1.96% and extreme values of –7.80% and 8.26% for XU030; 0.056% with a standard deviation of 1.62% and extreme values of –8.63% and 7.19% for XYUZO; 0.076% with a standard deviation of 1.45% and extreme values of –7.27% and 6.01% for XTUMY; and 0.041% with a standard deviation of 1.00% and extremes of –4.13% and 5.07% for USDTRY. For sectoral indices, the sample mean is 0.051% with a standard deviation of 2.16% for XUMAL; 0.066% with a standard deviation of 1.59% for XUSIN; 0.056% with a standard deviation of 1.69% for XUHIZ; and 0.051% with a standard deviation of 2.06% for XUTEK. Trimming of extreme observations, as demonstrated in the extreme values reported in this panel, reduces the likelihood that our results are driven by unduly high or low return observations.
3.2. Methodology
In the first part of our analysis, we apply the standard event study methodology to our test assets.
Each election date
11
extreme observations, as demonstrated in the extreme values reported in this panel, reduces the likelihood that our results are driven by unduly high or low return observations.
3.2. Methodology
In the first part of our analysis, we apply the standard event study methodology to our test assets.
Each election date 𝑇𝑇
𝑖𝑖is taken as an event occurring at origin 𝑡𝑡
0𝑖𝑖= 0, and daily returns of the test assets are studied over a fifty-day event period between days 𝑡𝑡
1𝑖𝑖= 𝑡𝑡
0𝑖𝑖− 25 and 𝑡𝑡
2𝑖𝑖= 𝑡𝑡
0𝑖𝑖+ 25 .
The estimation period for each election is
set as the 250-trading-day period preceding the event window, i.e., between days 𝑡𝑡
3𝑖𝑖= 𝑡𝑡
0𝑖𝑖− 275 and 𝑡𝑡
4= 𝑡𝑡
𝑖𝑖0− 26 . For each asset, abnormal returns are computed as the excess daily return over and above the estimation period mean of its daily returns:
𝐴𝐴𝑅𝑅
𝑖𝑖,𝑡𝑡= 𝑅𝑅
𝑖𝑖,𝑡𝑡− 𝑅𝑅̅
𝑖𝑖,𝑡𝑡, 𝑤𝑤ℎ𝑒𝑒𝑒𝑒𝑒𝑒 𝑅𝑅̅
𝑖𝑖,𝑡𝑡= ∑ 𝑅𝑅
𝑡𝑡𝑡𝑡=𝑡𝑡4𝑖𝑖 𝑖𝑖,𝑡𝑡3𝑖𝑖
, 𝑤𝑤ℎ𝑒𝑒𝑒𝑒𝑒𝑒 𝑆𝑆
𝐴𝐴𝑅𝑅2𝑖𝑖=
2491∑ [𝐴𝐴𝑅𝑅
𝑡𝑡𝑡𝑡=𝑡𝑡4𝑖𝑖 𝑖𝑖,𝑡𝑡]
23𝑖𝑖
(1) The average abnormal return on each day within the event period is computed as the arithmetic mean of the abnormal returns on that day across all political elections in our sample period and the cumulative average abnormal returns are computed for various windows within the fifty-day event period as the simple sum of the average abnormal returns on days falling into that specific window.
𝐴𝐴𝐴𝐴𝑅𝑅
𝑡𝑡= ∑ 𝐴𝐴𝑅𝑅
𝑁𝑁 𝑖𝑖,𝑡𝑡𝑖𝑖=1
𝑎𝑎𝑎𝑎𝑎𝑎 𝐶𝐶𝐴𝐴𝐴𝐴𝑅𝑅
𝑡𝑡𝑡𝑡+𝑘𝑘= ∑ 𝐴𝐴𝐴𝐴𝑅𝑅
𝑘𝑘 𝑡𝑡+𝑠𝑠𝑠𝑠=0
, (2)
𝑤𝑤ℎ𝑒𝑒𝑒𝑒𝑒𝑒 𝑁𝑁 𝑖𝑖𝑖𝑖 𝑡𝑡ℎ𝑒𝑒 𝑎𝑎𝑛𝑛𝑛𝑛𝑛𝑛𝑒𝑒𝑒𝑒 𝑜𝑜𝑜𝑜 𝑒𝑒𝑒𝑒𝑒𝑒𝑒𝑒𝑡𝑡𝑖𝑖𝑜𝑜𝑎𝑎𝑖𝑖 𝑎𝑎𝑎𝑎𝑎𝑎 𝑘𝑘 𝑖𝑖𝑖𝑖 𝑡𝑡ℎ𝑒𝑒 𝑒𝑒𝑒𝑒𝑎𝑎𝑙𝑙𝑡𝑡ℎ 𝑜𝑜𝑜𝑜 𝑡𝑡ℎ𝑒𝑒 𝐶𝐶𝐴𝐴𝑅𝑅 𝑤𝑤𝑖𝑖𝑎𝑎𝑎𝑎𝑜𝑜𝑤𝑤.The significance of the 𝐴𝐴𝐴𝐴𝑅𝑅 and 𝐶𝐶𝐴𝐴𝐴𝐴𝑅𝑅 for each test asset is tested with the following t-statistics:
𝑡𝑡
𝐴𝐴𝐴𝐴𝑅𝑅𝑡𝑡=
𝐴𝐴𝐴𝐴𝑅𝑅𝑡𝑡√𝑁𝑁1∑ 𝑆𝑆𝑁𝑁𝑖𝑖=1 𝐴𝐴𝑅𝑅𝑖𝑖2
𝑎𝑎𝑎𝑎𝑎𝑎 𝑡𝑡
𝐶𝐶𝐴𝐴𝐴𝐴𝑅𝑅𝑡𝑡𝑡𝑡+𝑘𝑘=
𝐶𝐶𝐴𝐴𝐴𝐴𝑅𝑅𝑡𝑡𝑡𝑡+𝑘𝑘√𝑁𝑁