Contents lists available at Science-Gate
International Journal of Advanced and Applied Sciences
Journal homepage: http://www.science-gate.com/IJAAS.html29
Exploring switching factors for mobile number portability: A survey
Imran Hameed Khaliq1, *, Hafiz Zahid Mahmood1, Summaira Malik1, Malik Jahangir Jan 2, Asif Zameer3
1Department of Management Sciences, COMSATS Institute of Information Technology, Lahore, Pakistan 2Department of New Media, Kadir Has University, Istanbul, Turkey
3Department of Marketing, FORE School of Management, New Delhi, India
A R T I C L E I N F O A B S T R A C T
Article history:
Received 18 April 2017 Received in revised form 27 June 2017
Accepted 28 June 2017
Pakistan’s mobile phone market is one of the world’s fastest growing markets with a subscriber base of 137 million users. Competition in the country’s telecommunication industry is dominated by four players and customer demand is high. In addition, Pakistan is the first country in South Asia to have implemented Mobile Number Portability (MNP) in March 2007. MNP is a facility that allows mobile subscribers to switch between service providers without changing their existing phone numbers. Mobile phone service provider’s selection may be influenced by various factors. Therefore, this research was undertaken to explore factors affecting MNP and to determine which factors were most influential in the selection of mobile phone service providers in a developing economy like Pakistan. Moreover, the study also probed into differences in customer perceptions between pre-paid and post-pre-paid customers. This exploratory study is based on primary data collected from 300 customers using services of different cellular companies who had experienced MNP facility. Factor analysis was carried out on obtained data and reliability of the resultant scale was verified to achieve the objectives of the study. The outcome of this research provided a concise framework of the various dimensions of customer choice. Contrary to previous researches, the result of this study indicated that infrastructural services, customer relationships, call quality and promotional packages were the most important factors affecting MNP. However, price of services was found less important factor in selection of telecommunication service providers. This study also showed that pre-paid and post-paid customers can be significantly different for many value-added services and promotional tools.
Keywords:
Mobile number portability Telecommunication Developing economy
Mobile phone service provider Customer satisfaction
© 2017 The Authors. Published by IASE. This is an open access article under the CC BY-NC-ND license (http://creativecommons.org/licenses/by-nc-nd/4.0/).
1. Introduction
*Throughout history humans have always
communicated through verbal and non-verbal methods. For the majority of time that humans have inhabited the Earth, verbal communications were limited to cover only a few yards’ distance. However, technology overcame these limitations by transforming human voice into radio signals such that now we can talk to anyone worldwide.
In fact, today it is hard imagining life without this ability and one might say that the cellular phone has become vital to human life. A mobile phone user checks his cellular device about 150 times a day (Meeker and Wu, 2013). By the end of 2015, there
* Corresponding Author.
Email Address: [email protected] (I. H. Khaliq) https://doi.org/10.21833/ijaas.2017.08.005 2313-626X/© 2017 The Authors. Published by IASE. This is an open access article under the CC BY-NC-ND license (http://creativecommons.org/licenses/by-nc-nd/4.0/)
are more than 7 billion mobile cellular subscriptions, corresponding to a penetration rate of 97%, up from 738 million in 2000, globally (ITU, 2015).
A sound telecommunication infrastructure is essential to the sustainable development of any country. The first mobile was invented in 1973
(Page, 2013) and this technology first became
available in Pakistan in 1990 (Mohammad and Zar
Wajidi, 2007). Pakistan’s mobile phone market is
now one of the world’s fastest growing markets with a subscriber base of 137 million as of February 2017
(PTA, 2017). Cellular Mobile Average Revenue per
user / month is recorded PKR 440 in 2015.
Pakistan Telecommunication Authority (PTA) regulates the establishment, operations and maintenance of telecommunication systems and the provision of telecom services in Pakistan. In this country, cellular technology has shifted from Global System for Mobile Communications (GSM) to 4th Generation Long Term Evolution (4G LTE) even as other parts of the world transition to 5G (GSMA,
30
2015). At present, four cellular mobile operators offer services in Pakistan including: Mobilink (Pakistan Mobile Communication Limited), Ufone
(Pak Telecom Mobile Limited), Telenor Pakistan, and Zong (China Mobile Pakistan).
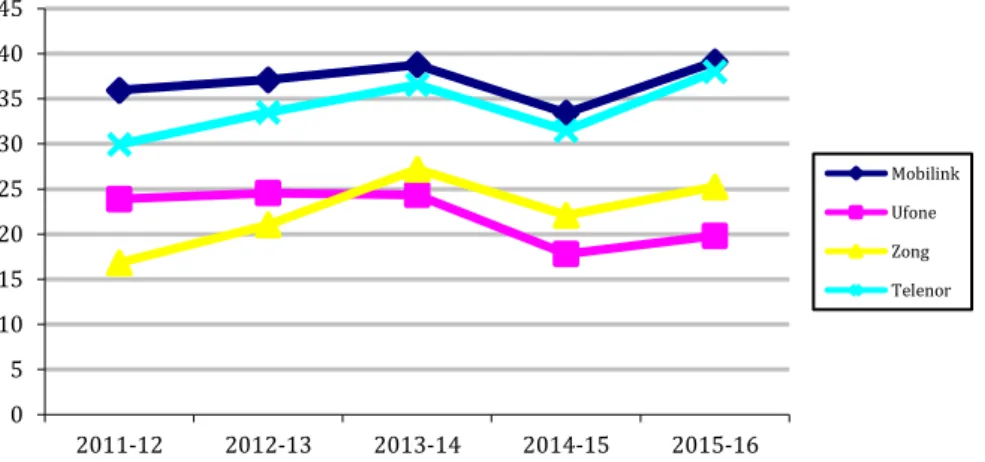
Fig. 1 depicts the total market share of cellular mobile service providers (PTA, 2017).
Fig. 1: Market share of mobile phone service providers in Pakistan (in Millions)
Currently, in Pakistan two types of packages are available to subscribers: post-paid and pre-paid. Customers also are able to change networks while retaining their phone number through Mobile Number Portability (MNP).
This option was introduced in Pakistan in 2007 and the cellular subscribers who switched providers through this option between 2008 and 2014 are depicted in Fig. 2 (PTA, 2014).
0 2 4 6 8 10 2009-10 2010-11 2011-12 2012-13 2013-14 MNP
Fig. 2: Total number of subscribers opted mobile number portability service (in Millions)
These figures indicate that most of the customers are loyal to their parent network with only a small percentage of customers (3.29% in 2013-2014) using the MNP option. Surprisingly, when converted to revenue terms, this small percentage yields PKR. 916.3 million of revenue shifting between providers, or PKR.183.3 million per individual operator. The objectives of this study were to a) identify discrete factors in the selection of, and switching between, mobile phone service providers opting the ease of MNP facility and b) to explore which services and promotional tools are most attractive to the pre-paid and post-paid customers.
2. Literature review
Standardized satisfaction measures could be valuable for a variety of telecommunication industry stakeholders. Nevertheless, a global standard measure of customer satisfaction with mobile operator services does not exist. Customer satisfaction in mobile services is multidimensional
(Min and Wan, 2009). As per Lee et al. (2001)
satisfaction could be further delineated with respect to value added services, pricing and core services. In addition to Lee et al. (2001), Lim et al. (2006)
identified entertainment services, customer services, locator services, network quality, billing system and data/messages services as noteworthy factors. Ali et al. (2010) asserted that customer satisfaction with telecom providers can be predicted based on value added services, call clarity, price, user friendliness of services, customer complaints and support service.
Herrmann et al. (2007) identified price as a
significant factor in the purchase and continuity of service with the implication being that it influences satisfaction. Consumer churn between mobile service providers occurs in competitive markets if more reasonable prices are available (Ali et al., 2010). Another study carried out using university students as subjects revealed that price fairness and coverage are the most influential factors of telecom customer satisfaction; in addition, results identified weak signal strength as a key factor for customers
0 5 10 15 20 25 30 35 40 45 2011-12 2012-13 2013-14 2014-15 2015-16 Mobilink Ufone Zong Telenor
31
switching from one mobile phone service provider to another in rural areas (Khan and Afsheen, 2012).
It’s well known that perceived service quality, customer value and satisfaction are the most important success factors of business competition for both manufacturers and service providers
(Buzzell and Gale, 1987; Bolton and Drew, 1991;
Parasuraman et al., 1991; Zeithaml et al., 1996). The
literature identifies quality as the foremost determinant of satisfaction. It has mutually positive relationship with satisfaction in the short and long run; customer loyalty is a long-term consequence of satisfaction (Oliver, 2014). Various academic studies have demonstrated a positive relationship between service quality and profitability (Fornell, 1992;
Danaher and Rust, 1996), customer preference
(Ranaweera and Neely, 2003), competitiveness
(Rapert and Wren, 1998) and customer satisfaction
(Danaher and Mattsson, 1994; Kim et al., 2004). An empirical study based on the Malaysian telecommunications industry indicated a significant relationship between price, customer satisfaction and quality (Ismail and Khatibi, 2004). Customer satisfaction mediates the relationship between service quality and customer loyalty but does not itself have a direct role in the establishment of a loyal customer base.
High service quality results in positive perceptions of the service provider and heightened commitment to re-patronize. Study entrenched trust as an important precursor of customer loyalty (Akbar and Parvez, 2009). Satisfaction is generally defined as customer attitude toward a service provider, or, more specifically, an emotional response to the concordance between what customers anticipate and what they receive in fulfillment of a purchase (Hansemark and Albinsson, 2004). Conversely, customer loyalty refers to a profoundly held commitment to re-buy a preferred service or product in the future in spite of situational influences or competitor marketing efforts that could reasonably cause switching behavior (Oliver, 2014).
In a study of Thailand’s mobile cellular network industry, it was explored that customer retention is one of the major factors influencing market survival
(Leelakulthanit and Hongcharu, 2011). Moreover,
the study concludes that the customer values emotions, network quality, promotional value, quality of call center services and quality of service at retail locations. From a more holistic viewpoint, corporate image plays an important role in enhancing customer satisfaction with mobile cellular networks. In the Indian mobile market, Paulrajan
and Rajkumar (2011) revealed that consumer
perception varies in accordance with the call quality services, price, facilities, service provider attributes (e.g. short messaging services, call waiting etc.) and customer care. The study shows that communication and price are the most influential factors; however, availability and product quality also has a significant impact on consumer perception in selecting mobile phone service providers. In a study of customer perceptions of Bangladeshi operators, Das (2013)
recommends improving networks for better communication, reducing call rates, improving billing and payments system, making packages more customer oriented, improving customer services and customer care and toll free help line, improving internet service and costs, reducing SMS charges and increasing corporate social responsibility (CSR) activities. Ibrahim et al. (2008) conducted research work in the telecom industry of Pakistan revealing that companies can be competitive in the telecommunications industry by focusing on quality of service alone, as these days communication customers’ expectation on quality of service is high and they will compromise on every other factor for it.
One pragmatic study explored factors that influence customer loyalty by analyzing the customers of pioneer mobile sector company in Erode District, India (John, 2010). It identified relationship; inconvenience in switching phone number, value added services (VAS), trustworthiness and image as key factors influencing customer loyalty. Researchers recommended that telecommunication service providers focus beyond price competitiveness to technology upgrade timing, network quality improvements and overall customer value in order to ensure customer loyalty (John,
2010). Jahanzeb et al. (2011) examined customer
loyalty in 146 customers using cell phones in the Pakistani telecommunication industry and found customer loyalty to be shaped predominantly by: service quality, trust, switching cost and staff loyalty. A study of Malaysian telecommunication operators reveals that service quality is most important in the selection of a mobile phone operator followed by network quality and price (Rahman et al., 2011).
Gupta and Sharma (2009) had similar findings in
India finding that both customer attraction and retention is possible when ‘service with reasonable quality without any hidden price’ is provided.
MNP allows subscribers to pursue the most favorable price and preferred services from operator to operator whilst retaining their original mobile numbers. Consequently, mobile carriers will need to vigorously compete by providing innovative and high-quality customer service for their customers based on their needs and demands, so as to avoid consumer churn and to attract new subscribers. One study found that the introduction of MNP enhanced competition in the supply of value-added services, and resulted in lower prices and better services in a fixed telecommunications market (Viard, 2007). Strong competition will create service as well as product innovation (Shin and Kim, 2007).
Mobile phone service providers will develop greater variety of products and services in order to differentiate themselves from their rivals in the market place. In this environment, companies will find it prudent to explore what customers are willing to pay for and do their best to meet their consumer’s need. To a certain degree, new product development and innovation may raise supply-side costs. However, consumers will benefit and receive more
32
value from the variety of choice and new products. Eventually, competition will benefit operators themselves by giving them the opportunity to catch up with the more advanced telecommunication industries in the world and compete with them
(Buehler and Haucap, 2004). It will strengthen
domestic carriers striving to enter foreign markets. MNP is being effectively executed in various countries and progressively accepted as a strategy for increased competition in the mobile market
(Buehler and Haucap, 2004). Its primary objective is
to give subscribers more flexibility in selecting their mobile phone service providers and increasing competition by enabling consumers to switch between service providers without changing their existing numbers. Since the mid-1990s, various telecommunications regulatory bodies have proposed implementing MNP. This idea became popular with the growth of mobile telephone utilization. However, different carriers have resisted this implementation.
Incumbent carriers with great current subscriber bases sturdily opposed MNP saying it places excessive burden on management cost. Meanwhile, new entrants and competitor carriers have welcomed MNP for its effect on reducing consumer lock-in which gives them an opportunity to compete fairly with rivals (PTA, 2013). Owing to these differing interests MNP is usually implemented across all the carriers by telecommunication regulatory authorities. Initial execution of mobile number portability has been found to bring substantial benefits to consumers, such as higher quality, greater choice, lower prices, a wide range of products and services, and wide-ranging social networks. Furthermore, MNP has been argued by many to be an effective policy instrument for creating a more competitive market, specifically by providing new entrants competitive opportunity (Ibid). Singapore was the first country to initiate (limited) MNP in 1997, followed by Hong Kong in 1999. Almost one-third (30%) of mobile users in Hong Kong ported out their numbers in the year after the introduction of MNP. The mobile market experienced a stern price war among seven mobile service operators competing to retain existing and attracting new consumers. The Korean regulatory authority implemented MNP to strengthen competition between carriers in 2004 (Park and Lee, 2002).
In 1999, Netherlands and United Kingdom were the first European countries to implement MNP, followed by others: Spain in 2000; Denmark and Sweden in 2001; and Italy, Belgium, Portugal and Germany in 2002 (Sutherland, 2007). All 27 members of European Union had shifted to MNP by 2008 (Sánchez and Asimakopoulos, 2012). The MNP implementation in the United States began in 2003, through which Verizon Wireless successfully attracted number of subscribers, with the help of customer service and quality network (Shin and Kim 2007).
2.1. Need for study
Competition in the Pakistani telecommunications industry is dominated by four players and customer demand is high. In addition, Pakistan is the first country in South Asia to have implemented Mobile Number Portability (MNP) in March 2007. MNP is a facility that allows mobile subscribers to switch between providers without changing their existing phone number. The financial costs of switching are also very economical. Prior to MNP availability, customers faced switching costs related to printing new business cards, informing social circles about their new number, missing important calls from people that do not have the new number, etc. Regulatory authorities imposed mandatory MNP service in order to make the mobile telecommunication more competitive and reduce customer switching costs (Reinke, 1998). In this market scenario, customer retention becomes both more difficult and critical to business success. With the reduced barriers to switching providers, customer attraction and retention is based solely on customer satisfaction; however, past research indicates that customer satisfaction is composed of a variety of other factors. There is a need to understand the most influential factors affecting customer satisfaction in this low-barrier market and we designed a study using exploratory factor analysis to identify them. The outcome of this study will not only be prodigiously important for the local carriers but likewise useful for international market.
3. Research objectives
Mobile phone service provider selection is influenced by various factors. This research aims to determine which factors are most influential in the selection of mobile phone service providers in Pakistan’s economy.
Network coverage, signal strength, call services, entertainment services, text service, call rates, package plans, voice quality, customer service, value added services, promotional offers are assessed to determine which have the most influence in the selection of providers. Another objective of this study was to reveal differences in customer perceptions between pre-paid and post-paid customers.
4. Research methodology 4.1. Data collection
This exploratory study utilizes primary data collected from 300 Lahore residents via a random-cluster sampling method. The sample was restricted to MNP service customers. It included respondents from a variety (n=41) of professional categories, including unemployed. University students were predominant (n=55) followed by employees of private companies, housewives, businessmen,
33
unemployed, shopkeepers, farmers, helpers, retailers, transporters and teachers. Data collection was administered via a telephonic interview questionnaire consisting of 49 items. Eleven items collected demographic information while the remaining 38 were multiple choices with response options based on a five point Likert scale representing high importance to low importance from 1 to 5 respectively. Expert opinion and review of existing literature was carried out to develop the questionnaire. Some of the items used in the scales were taken from the Paulrajan and Rajkumar (2011)
study. The remainder of the items was included based on the knowledge of the researchers and discussions with experts from mobile telecommunication industry.
4.2. Data analysis 4.2.1. Factor analysis
Bartlett’s Test of Sphericity and the Kaiser– Mayer–Olkin Measure of Sampling Adequacy (KMO) were run to determine the suitability of factor analysis to this sample. The KMO statistic helps to predict whether data shares a common factor structure. KMO is also used to assess which variables to drop from the model due to multicollinearity problem. The value of KMO varies from 0 to 1 and KMO overall should be 0.60 or higher to perform factor analysis. The null hypothesis of Bartlett’s Test is that the correlation matrix of the variables is an Identity Matrix (no variable has any correlation with any other variable except itself). The Significance value of Bartlett’s Test should be lower than 0.05 to demonstrate that null hypothesis is not accepted. The extraction method to arrive this matrix is
‘Principal Component Analysis’ and rotation method is ‘Varimax with Kaiser Normalization’. Variables with factor loading less than 0.5 were removed from the model.
4.2.2. Comparing perceptions between pre-paid and post-paid customers
To do a comparative analysis of the perceptions of pre-paid and post-paid customers, item-to-item independent samples t-tests were carried out. The null hypothesis for each item in the questionnaire was that there was no difference in the mean perception of the pre-paid and post-paid customers.
5. Results and discussion 5.1. Factor analysis
Responses to all 16 items were skewed towards being important considerations. Except for the questions: Call rates (Regular Calls), Service Reliability, Family Preference, Restoration Capabilities, Scratch Cards and Easy Load Availability, Voice Quality, Signal Strength, Responsiveness to Customer Query, and Geographical Network Coverage at Desired Areas; respondents indicated items were important. Questions, Disclosed Policies and Charges (Hidden Charges) and Complaint resolutions had very little variance, indicating consistent responses among sample members. Respondents placed high importance on ‘Disclosed Policies and Charges (Hidden Charges)’, ‘Complaint resolutions’, and ‘Day Time Call Packages.’ Means and standard deviations of responses are depicted in Table 1.
Table 1: Descriptive statistics
Item Mean Std. Deviation Disclosed Policies and Charges (Hidden Charges) 4.100 .8117
Complain resolutions 4.064 .8376 Day Time Call Packages 4.003 .9729 Complaint redress system 3.895 .8917 Maximum talk time for the given recharge amount 3.728 .9293 Call rates (Regular Calls) 3.657 1.2254
Service Reliability 3.639 1.1181 Family Preference 3.610 1.0561 Restoration capabilities 3.558 1.2985 Call drop rate 3.557 .9729 Scratch Cards and Easy Load availability 3.537 1.3775
Voice Qualities 3.498 1.1105 Signal Strength 3.432 1.0459 Network in rural areas 3.399 .9613 Responsiveness to customer query 3.271 1.1738 Geographical Network coverage at desired areas 3.228 1.2069
Bartlett’s Test of Sphericity and the KMO test were both highly significant and concluded that factor analysis was an appropriate method to use with this data Table 2.
Table 2: KMO and bartlett's test
Kaiser-Meyer-Olkin Measure of Sampling Adequacy. .664 Bartlett's Test of Sphericity Approx. Chi-Square Df 432.154 153
Sig. .000
The rotated component matrix results are shown in Table 3. From the results of factor analysis, only 16 out of 38 items have substantial influence on selection of service provider and 22 items do not influence customers’ selection of service providers.
The sixteen remaining items converged into five factors. The factors and relevant items are: Network Factor, The Customer Relationship factor, Service Quality, Promotional Package and Pricing.
34
Table 3: Rotated component matrix
Item 1 2 Component 3 4 5
Signal Strength .784 Network in rural areas .761 Geographical Network coverage at desired areas .600
Complain resolutions .750 Responsiveness to customer query .726 Restoration capabilities .697 Complaint redress system .674
Service Reliability .733
Call drop rate .731
Voice Qualities .543
Maximum talk time for the given recharge amount .501
Day Time Call Packages .644
Family Preference .570
Call rates (Regular Calls) .578
Disclosed Policies and Charges (Hidden Charges) .576 Scratch Cards and Easy Load availability .552
Three items – Signal Strength, Network in Rural Areas, and Network Coverage in Desired Areas – load on the Network factor (Factor 1). The Customer Relationship factor (Factor 2) consists of four items: Complaint Resolution, Responsiveness to Customer Queries, Restoration Capabilities, and Complaint Redress System’. Service Reliability, Call Drop Rate, Voice Quality, and Maximum Talk Time for the Given Recharge Amount loaded on Service Quality (Factor 3). Promotional Package (Factor 4) consists of two items: Day Time Call Packages, and Family Preference. Finally, three items load on the fifth factor, Pricing: Call Rates (Regular Calls), Disclosed Policies and Charges (Hidden Charges), and Scratch Cards and Easy Load availability.
5.2. Independent samples t-test
By this procedure, out of total 38 variables, there are 18 variables where there is a significant difference between the importance given by prepaid and postpaid customers. These variables are:
Obnoxious Callers protection, Caller tunes, Call forwarding and waiting (Missed Call Alerts), SMS Package Plans, Daytime Call Packages, Weekends Call Packages, International Call Rates/ Packages, Talky Messages, GPRS Package Plans, Free Minutes / Sim Jagao Offers, Free Night Call Packages, Restoration capabilities, Call drop rates, Phone Book Backup Service, GSM / EDGE Technology, Location Based Concessional Offers, Balance Share Service among users, and Scratch Cards and Easy Load availability. Variables of higher importance to postpaid customers are: Obnoxious Callers Protection, Call forwarding and waiting (Missed Call Alerts), GPRS Package Plans, Restoration capabilities, Call drop rates, GSM / EDGE Technology, Balance Share Service among users, and Scratch Cards and Easy Load availability. Variables of higher importance to prepaid customers are: Caller tunes, SMS Package Plans, Daytime Call Packages, Weekends Call Packages, International Call Rates/ Packages, Talky Messages, Free Minutes / Sim Jagao Offers, Free Night Call Packages, Phone Book Backup Service, and Location Based Concessional Offers.
Mobile phone services are one of the fastest growing service sectors in developing countries like Pakistan, however, researches do not give a clear idea of how to measure customer satisfaction. This study sheds light on influence of network related factors, customer relationship management, call quality, promotional packages and pricing related factors on customer satisfaction. The objective of this study was to examine and identify critical factors in consumer selection of mobile phone service providers using a sample of consumers with access to the MNP option. The study revealed that five components of customer satisfaction exist: infrastructural services, customer relationships, service quality, promotional packages and pricing factors. This study also indicates that infrastructural services are the most influential component. This would indicate that mobile phone service providers can retain their existing customers and attract the new ones by strategically expanding network coverage in rural and other areas where coverage services are weak. In Pakistan, some coverage expansion opportunities exist; during the fiscal year 2012-13, 25% of the population and 8% of the land area did not have coverage (PTA, 2013).
The results of this study are in line with that of
Kim et al. (2004) study in that both highlight ‘service
quality’ as one of the leading factors itself affecting customer loyalty. They are also in line with the findings of Aydin and Özer (2005) which showed that perceived service quality was an inadequate provision for customer loyalty. Additionally, while the current study found that customer relationship is an important component of customer satisfaction, it also highlighted that having complaints about service do not on their own negatively influence satisfaction, but rather it is the responsiveness to consumer complaints that is most influential. These findings are similar to those of Fornell and
Westbrook (1984) about the strategic importance of
managing customers’ complaints. They demonstrated that a company might be able to reduce future complaints by encouraging the expression of customer complaints in real time. It is essential for customers to know where to address complaints and to have the knowledge that they will
35
be given appropriate consideration. Price sensitivity, while important to grabbing attention and initial buy-in, was identified as the least important factor to being loyal with the network. Furthermore, fair price has direct impact on customer satisfaction. This result is consistent with empirical findings of other scholars (Diller, 2000; Varki and Colgate, 2001; Evanschitzky et al., 2008; Uddin and Akhter, 2012). Cost effectiveness is one of the ingredients in designing new packages and promotions.
6. Conclusion
To summarize, the outcome of this research provides a concise integrated framework to help mobile phone service providers and policy makers better understand the factors influencing customer satisfaction and retention. This framework provides guidance on where providers should focus resources aimed at increasing customer loyalty, and thereby, retention. Finally, this study highlights that the choice consideration for pre-paid and post-paid customers can be significantly different for many value-added services and promotional tools. The comparative analysis carried out in the study provides insight into which services and promotional tools variously attract pre-paid versus post-paid customers.
Acknowledgment
The authors wish to thank Dr. Kimberly J. Wilson who assisted in the proof-reading and content reviewing of the manuscript.
References
Akbar MM and Parvez N (2009). Impact of service quality, trust, and customer satisfaction on customers loyalty. ABAC Journal, 29(1): 24-38.
Ali JF, Ali I, ur Rehman K, Yilmaz AK, Safwan N, and Afzal H (2010). Determinants of consumer retention in cellular industry. African Journal of Business Management, 4(12): 2402-2408. Aydin S and Özer G (2005). The analysis of antecedents of
customer loyalty in the Turkish mobile telecommunication market. European Journal of Marketing, 39(7/8): 910-925. Bolton RN and Drew JH (1991). A multistage model of customers'
assessments of service quality and value. Journal of Consumer Research, 17(4): 375-384.
Buehler S and Haucap J (2004). Mobile number portability. Journal of Industry, Competition and Trade, 4(3):223-238. Buzzell D and Gale BT (1987). The PIMS principles: linking
strategy to performance. Simon and Schuster, New York, USA. Danaher PJ and Mattsson J (1994). Customer Satisfaction during the service delivery process. European Journal of Marketing, 28(5): 5-16.
Danaher PJ and Rust RT (1996). Indirect financial benefits from service quality. Quality Management Journal, 3(2): 63-75. Das SK (2013). Customer satisfaction of mobile operators in
Bangladesh. Available online at: https://ssrn.com/abstract= 2353433
Diller H (2000). Preiszufriedenheit bei dienstleistungen. Betriebswirtschaft-Stuttgart, 60(5): 570-587.
Evanschitzky H, Iyer GR, and Caemmerer B (2008). Dimensions of satisfaction in retail settings: A research note. Journal of Relationship Marketing, 7(3): 275-285.
Fornell C (1992). A national customer satisfaction barometer: The Swedish experience. The Journal of Marketing, 56(1): 6-21. Fornell C and Westbrook RA (1984). The vicious circle of
consumer complaints. Journal of Marketing, 48(3): 68-78. GSMA (2015). The mobile economy. GSMA Company, London, UK.
Available online at: https://www.gsma.com/aboutus/ worldwide-offices/london-office
Gupta D and Sharma A (2009). Customer loyalty and approach of service providers: An empirical study of mobile airtime service industry in India. Services Marketing Quarterly, 30(4): 342-364.
Hansemark OC and Albinsson M (2004). Customer satisfaction and retention: the experiences of individual employees. Managing Service Quality: An International Journal, 14(1): 40-57.
Herrmann A, Xia L, Monroe KB, and Huber F (2007). The influence of price fairness on customer satisfaction: An empirical test in the context of automobile purchases. Journal of Product and Brand Management, 16(1): 49-58.
Ibrahim MS, Sadiq N, and Sajid A (2008). Impact of ethical practices on quality of services of bile telecom companies: Case study of Pakistan. In the 11th QMOD Conference on
Quality Management and Organizational Development Attaining Sustainability From Organizational Excellence to SustainAble Excellence, Linköping University Electronic Press, Helsingborg, Sweden, 033: 931-939. Available online at: http://www.ep.liu.se/ecp/article.asp?issue=033&article=78 Ismail H and Khatibi A (2004). Study of the relationship between
perception of value and price and customer satisfaction: The case of Malaysian telecommunications industry. Journal of American Academy of Business, 4(1/2): 309-313.
ITU (2015). ICT facts and figures. International Telecommunication Union. Geneva, Switzerland. Available online at: www.itu.int/net
Jahanzeb S, Fatima T, and Khan MB (2011). An empirical analysis of customer loyalty in Pakistan's telecommunication industry. Journal of Database Marketing and Customer Strategy Management, 18(1): 5-15.
John JS (2010). An analysis on the customer loyalty of bharat sanchar nigam Ltd.. Journal of Development Research, 2(2). Available online at: https://ssrn.com/abstract=1600511 Khan S and Afsheen S (2012). Determinants of customer
satisfaction in telecom industry. Journal of Basic and Applied Scientific Research, 2(12): 12833-12840.
Kim MK, Park MC, and Jeong DH (2004). The effects of customer satisfaction and switching barrier on customer loyalty in Korean mobile telecommunication services. Telecommunications Policy, 28(2): 145-159.
Lee J, Lee J, and Feick L (2001). The impact of switching costs on the customer satisfaction‐loyalty link: Mobile phone service in France. Journal of Services Marketing, 15(1): 35-48.
Leelakulthanit O and Hongcharu B (2011). Factors that impact customer satisfaction: Evidence from the Thailand mobile cellular network industry. International Journal of Management and Marketing Research, 4(2): 67-76.
Lim H, Widdows R, and Park J (2006). M‐loyalty: winning strategies for mobile carriers. Journal of Consumer Marketing, 23(4): 208-218.
Meeker M and Wu L (2013). Internet Trends D11 Conference. The annual Internet Trends Report, Kleiner Perkins Caufield Byers (KPCB). Menlo Park, USA.
Min D and Wan L (2009). Switching factors of mobile customers in Korea. Journal of Service Science, 1(1): 105-120.
36 Mohammad J and Zar Wajidi A (2007). Cellular mobile phone
service and users’ preferences in Quetta city. Journal of Managerial Sciences, 2(1):141-153.
Oliver RL (2014). Satisfaction: A behavioral perspective on the consumer. Routledge, Abingdon, UK.
Page T (2013). Smartphone technology, consumer attachment and mass customisation. International Journal of Green Computing (IJGC), 4(2): 38-57.
Parasuraman A, Berry LL, and Zeithaml VA (1991). Perceived service quality as a customer‐based performance measure: An empirical examination of organizational barriers using an extended service quality model. Human Resource Management, 30(3): 335-364.
Park MC and Lee SW (2002). Double marginalization problems: Evidence from the Korean fixed-to-mobile service market. Telecommunications Policy, 26(11): 607-621.
Paulrajan R and Rajkumar H (2011). Service quality and customers preference of cellular mobile service providers. Journal of Technology Management and Innovation, 6(1): 38-45.
PTA (2013). Annual Report 2012-2013. Pakistan Telecommunication Authority, Islamabad, Pakistan. Available online at: http://www.pta.gov.pk/index.php?option=com_ contentandview=articleandid=1919:annual-report-2013and catid=94:newsupdates
PTA (2014). Annual Report 2013-2014. Pakistan Telecommunication Authority, Islamabad, Pakistan. Available online at: http://www.pta.gov.pk/index.php?option=com_ contentandtask=viewandid=2038andItemid=740
PTA (2017). Telecom Indicators. Pakistan Telecommuncation Authority, Islamabad, Pakistan. Available online at: http://www.pta.gov.pk/index.php?option=com_contentandta sk=viewandid=269andItemid=658
Rahman S, Haque A, and Ahmad MIS (2011). Choice criteria for mobile telecom operator: Empirical investigation among
Malaysian customers. International Management Review, 7(1): 50-57
Ranaweera C and Andy N (2003). Some moderating effects on the service quality-customer retention link. International Journal of Operations and Production Management, 23(2): 230-248. Rapert MI and Wren BM (1998). Service quality as a competitive
opportunity. Journal of Services Marketing, 12(3): 223-235. Reinke TH (1998). Local number portability and local loop
competition. Critical issues. Telecommunications Policy, 22(1): 73-87.
Sánchez BU and Asimakopoulos G (2012). Regulation and competition in the European mobile communications industry: An examination of the implementation of mobile number portability. Telecommunication Policy, 36(3): 187-196.
Shin DH and Kim WY (2007). Mobile number portability on customer switching behavior: In the case of the Korean mobile market. Info, Digital Policy, Regulation and Governance, 9(4): 38-54.
Sutherland E (2007). Mobile number portability. Info- Digital Policy, Regulation and Governance, 9(4): 10-24.
Uddin MB and Akhter B (2012). Customer satisfaction in mobile phone services in Bangladesh: A survey research. Management and Marketing-Craiova, 10(1): 20-36.
Varki S and Colgate M (2001). The role of price perceptions in an integrated model of behavioral intentions. Journal of Service Research, 3(3): 232-240.
Viard VB (2007). Do switching costs make markets more or less competitive? The case of 800 number portability. The RAND Journal of Economics, 38(1): 146-163.
Zeithaml VA, Berry LL, and Parasuraman A (1996). The behavioral consequences of service quality. The Journal of Marketing, 60(2): 31-46.