LOW GDP GROWTH RATE HAS NOT
AFFECTED EMPLOYMENT YET
Seyfettin Gürsel
*Gökçe Uysal
∗∗and Ayşenur Acar
∗∗∗Executive Summary
Seasonally adjusted labor market data shows that non-agricultural unemployment rate decreased from 11.2
percent to 11 percent in the period of June 2012. There is a decline in non-agricultural unemployment which
had remained stagnant for a long time. However, we observe that the decrease in unemployment rates is
slowing down parallel to slower growth rates. The data released by the Kariyer.Net indicates that the
non-agricultural unemployment may increase slightly in the period of July.
Increase in non-agricultural unemployment
According to the labor market statisics released by TurkStat on September 17
th( May – June – July)
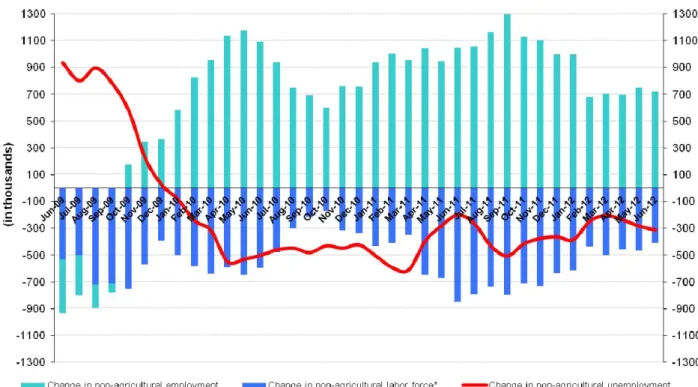
non-agricultural labor force increased by 410 thousand (2 percent), non-non-agricultural employment increased by
721 thousand (3.9 percent) and the number of unemployment in non-agricultural decreased by 311 thousand
to 2 million 161 thousand on a year-on-year basis in the period of June 2012 (Figure 1).
Figure 1 Year-on-year changes in non-agricultural labor force, employment and unemployment
Source: TurkStat, Betam
* Prof. Seyfettin Gürsel, Betam, Director, [email protected]
∗∗ Assoc. Prof. Gökçe Uysal, Betam, Vice Director, gokce.uysal @bahcesehir.edu.tr ∗∗∗ Ayşenur Acar, Betam, Research Assistant, [email protected]
May 15, 2012
Labor Market Outlook:
September 2012
Slight decline in Non-agricultural unemployment
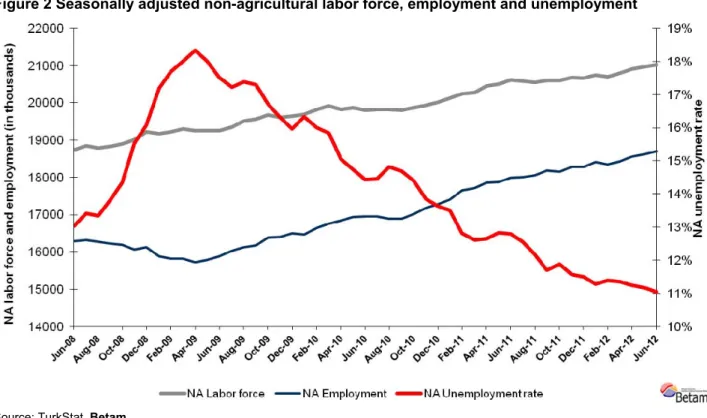
According to seasonally adjusted series, non-agricultural labor force increased by 52 thousand from 20
million 961 thousand to 21 million 18 thousand in the period of June compared to the period of May 2012
(Figure 2, Table 1). Non-agricultural employment increased by 75 thousand and reached 18 million 698
thousand. Consequently, the number of unemployed persons in non-agricultural sectors decreased by 23
thousand and seasonally adjusted non-agricultural unemployment rate decreased to 11 percent. We already
know that labor market statistics follow GDP growth with a lag. Hence, we expect to observe the effects of
the slower growth rates on non-agricultural unemployment rates in the upcoming periods.
Figure 2 Seasonally adjusted non-agricultural labor force, employment and unemployment
Source: TurkStat, Betam
According to Kariyer.net series Non-agricultural unemployment may increase
Seasonal and calendar day adjusted total vacancy series show a sizeable increase in August 2012, which
indicates an increase in non-agricultural unemployment for the upcoming period.
1Note that data which will
be released by TurkStat next month pertains to July 2012 and it will comprise of the averages of three
months, in turn, June, July and August. We expect that the effect of the increase indicated by Kariyer.net
total vacancy series on non-agricultural unemployment rate will be observed in the next period.
1
We have been using seasonal and calendar adjusted application per vacancy series released by Kariyer.net. However, we started using total vacancy series as the total application series contains a structural break due to technical difficulties since April 2012. Seasonal and calendar adjustment procedure is applied to total vacancy series released by Kariyer.net. Total vacancy series is continuously increasing given that the customers base of Kariyer.net is widening overtime. Therefore we calculate the cycle of the series by subtracting the absolute number from the trend calculated by a Hodrick-Prescott fitler. Since the changes in the number of vacancies are negatively correlated with the changes in unemployment we use the inverse of total vacancy series by multiplying it with -1. Although this vacancy series are not as strong forecasters as the application per vacancy series, it gives an idea for the direction of non-agricultural unemployment.
Figure 3 Seasonally adjusted non-agricultural unemployment rate and total vacancy cycle
Data source: Kariyer.net, TurkStat, Betam
Increase in agricultural employment came to an end
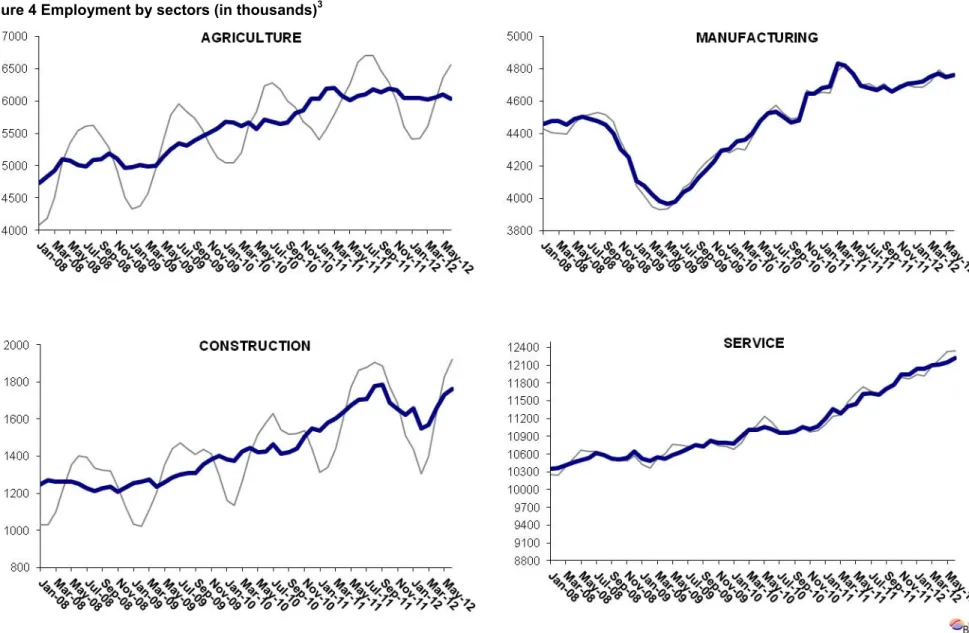
According to seasonally adjusted labor market series, employment in services increased by 67 thousand in
the period of June 2012 (Table 2, Figure 4)
2. Employment in construction had a sizeable increase (30
thousand) whereas employment in manufacturing increased only slightly (10 thousand).
Agricultural employment decreased by 69 thousand compared to the period of May 2012. In addition,
agricultural employment decreased by 43 thousand on a year-on-year basis (Table 2). We expect that
agricultural employment, which has been increasing since 2008, came to the an end.
2 Seasonal adjustment procedure is applied to each sector of employment series separately. Hence the sum of these series may differ from the seasonally adjusted series of total employment. The difference stems from the non-linearity of the seasonal adjustment process.
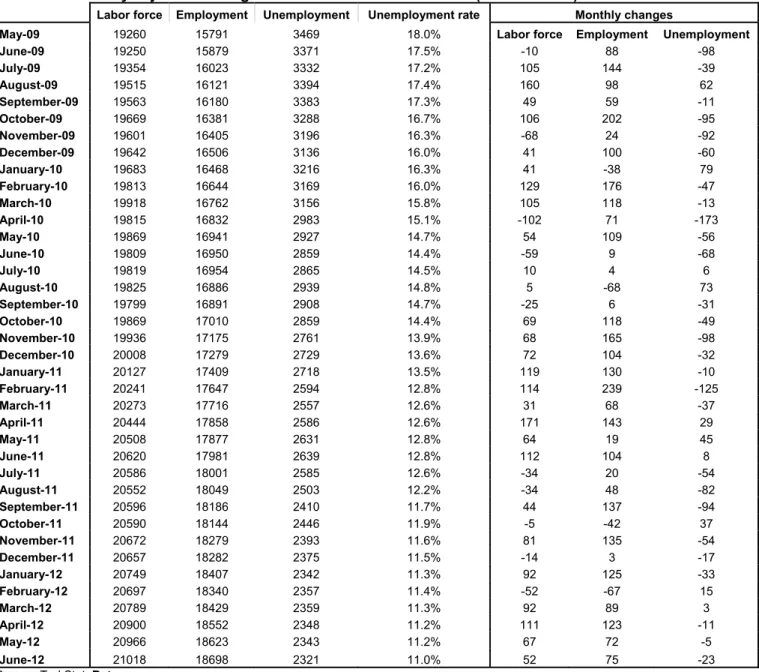
Table 1 Seasonally adjusted non-agricultural labor force indicators (in thousands)
Labor force Employment Unemployment Unemployment rate Monthly changes
May-09 19260 15791 3469 18.0% Labor force Employment Unemployment
June-09 19250 15879 3371 17.5% -10 88 -98 July-09 19354 16023 3332 17.2% 105 144 -39 August-09 19515 16121 3394 17.4% 160 98 62 September-09 19563 16180 3383 17.3% 49 59 -11 October-09 19669 16381 3288 16.7% 106 202 -95 November-09 19601 16405 3196 16.3% -68 24 -92 December-09 19642 16506 3136 16.0% 41 100 -60 January-10 19683 16468 3216 16.3% 41 -38 79 February-10 19813 16644 3169 16.0% 129 176 -47 March-10 19918 16762 3156 15.8% 105 118 -13 April-10 19815 16832 2983 15.1% -102 71 -173 May-10 19869 16941 2927 14.7% 54 109 -56 June-10 19809 16950 2859 14.4% -59 9 -68 July-10 19819 16954 2865 14.5% 10 4 6 August-10 19825 16886 2939 14.8% 5 -68 73 September-10 19799 16891 2908 14.7% -25 6 -31 October-10 19869 17010 2859 14.4% 69 118 -49 November-10 19936 17175 2761 13.9% 68 165 -98 December-10 20008 17279 2729 13.6% 72 104 -32 January-11 20127 17409 2718 13.5% 119 130 -10 February-11 20241 17647 2594 12.8% 114 239 -125 March-11 20273 17716 2557 12.6% 31 68 -37 April-11 20444 17858 2586 12.6% 171 143 29 May-11 20508 17877 2631 12.8% 64 19 45 June-11 20620 17981 2639 12.8% 112 104 8 July-11 20586 18001 2585 12.6% -34 20 -54 August-11 20552 18049 2503 12.2% -34 48 -82 September-11 20596 18186 2410 11.7% 44 137 -94 October-11 20590 18144 2446 11.9% -5 -42 37 November-11 20672 18279 2393 11.6% 81 135 -54 December-11 20657 18282 2375 11.5% -14 3 -17 January-12 20749 18407 2342 11.3% 92 125 -33 February-12 20697 18340 2357 11.4% -52 -67 15 March-12 20789 18429 2359 11.3% 92 89 3 April-12 20900 18552 2348 11.2% 111 123 -11 May-12 20966 18623 2343 11.2% 67 72 -5 June-12 21018 18698 2321 11.0% 52 75 -23
Table 2 Seasonally adjusted employment by sector (in thousands)
Agriculture Manufacturing Construction Service Monthly changes
May-09 5141 3968 1258 10586 Agriculture Manufacturing Construction Service
June-09 5259 3980 1284 10632 118 12 27 47 July-09 5340 4036 1303 10695 82 56 18 63 August-09 5306 4063 1308 10749 -34 28 5 54 September-09 5395 4127 1311 10723 89 64 3 -26 October-09 5459 4177 1354 10822 64 50 44 99 November-09 5507 4226 1384 10791 48 50 29 -30 December-09 5577 4293 1404 10794 70 67 20 2 January-10 5675 4303 1382 10783 98 10 -22 -11 February-10 5664 4353 1373 10903 -11 50 -9 120 March-10 5617 4360 1425 11003 -46 7 52 101 April-10 5669 4402 1446 11003 52 42 21 -1 May-10 5572 4475 1423 11058 -98 73 -23 56 June-10 5709 4528 1424 11021 138 53 1 -37 July-10 5675 4537 1462 10955 -35 9 38 -66 August-10 5651 4502 1414 10962 -24 -34 -48 7 September-10 5664 4466 1420 10989 13 -37 6 26 October-10 5811 4481 1440 11060 147 16 19 71 November-10 5860 4647 1507 11021 49 166 67 -39 December-10 6031 4645 1550 11067 172 -2 43 47 January-11 6035 4681 1536 11189 4 36 -14 122 February-11 6189 4691 1579 11354 154 11 44 165 March-11 6201 4832 1605 11290 12 140 25 -64 April-11 6080 4818 1639 11405 -121 -14 34 114 May-11 6016 4769 1674 11449 -63 -49 35 44 June-11 6080 4695 1706 11620 63 -74 32 172 July-11 6099 4679 1708 11627 19 -15 3 7 August-11 6176 4670 1778 11605 77 -10 70 -23 September-11 6140 4690 1787 11704 -36 20 9 99 October-11 6194 4657 1689 11777 54 -33 -97 74 November-11 6165 4688 1655 11944 -29 31 -35 167 December-11 6049 4707 1622 11937 -117 19 -33 -6 January-12 6052 4711 1659 12037 3 5 37 100 February-12 6044 4723 1548 12035 -8 12 -111 -3 March-12 6029 4753 1567 12105 -15 31 18 70 April-12 6061 4769 1660 12118 32 16 93 12 May-12 6106 4750 1732 12152 44 -19 73 34 June-12 6037 4759 1763 12219 -69 10 30 67
Figure 4 Employment by sectors (in thousands)
3Source: TurkStat, Betam