FEB/ Vol 23/ No 7a/ 2014 – pages 1574 – 1584
CHARACTERIZATION AND ADSORPTIVE PROPERTIES OF
ACTIVATED CARBON PREPARED FROM OLIVE STONES
Aydın Türkyilmaz, Mehmet Doğan* and Mahir Alkan
Balikesir University, Faculty of Science and Literature, Department of Chemistry, 10145 Balikesir, Turkey
ABSTRACT
Preparation of activated carbon from olive stones by H3PO4 chemical activation under different H3PO4 concen-trations and calcination temperatures was carried out. The surface area of chemically modified activated carbon was 524 m2/g. The surface characterization of both olive stones and activated carbon was undertaken using FTIR spectro-scopic technique. Prepared activated carbon was used as an adsorbent for the removal of a basic textile dye (meth-ylene blue) from aqueous solutions. The effects of various process parameters i.e., pH, ionic strength and tempera-ture, on the adsorption capacity of activated carbon were investigated. The results showed that methylene blue adsorption increased with increasing pH, temparature and ion strength. Activated carbon had an isoelectrical point at approximately 2.50, and adsorption enthalpy was calculat-ed to be 11.30 kj/mol. The experimental data indicatcalculat-ed that the adsorption isotherms were well described by the Langmuir equilibrium isotherm equation. The separation factor (RL) revealed the favorable nature of Langmuir iso-therm for the methylene blue-activated carbon system.
KEYWORDS: Olive stone, activated carbon, characterization,
adsorption, zeta potential, adsorption isotherm.
1. INTRODUCTION
Water pollution is an important environmental con-cern in the world, and there are many sources of chemi-cals in the environment, such as industrial pollution, man-aged landfills or pesticide runoff. Many industrial activi-ties, particularly in textile, paper, plastics, coal, and food industry, consume large amounts of water. Almost every industry uses dyes to color their products, and the residual and unspent dyes are discharged into the environment. The main problem involved in decontaminating textile wastewaters is the removal of colour, since no single process is currently capable of generating adequate efflu-ents. Most dyes have an adverse impact on the environ-ment as they are considered to be toxic and have carcino-genic properties,
* Corresponding author
which make the water inhibitory to aquatic life [1]. Meth-ylene blue (MB), which was the most commonly used substance for dying cotton, wood and silk, can cause some harmful effects. Acute exposure to MB can cause increased heart rate, vomiting, shock, Heinz body formation, cyano-sis, jaundice, quadriplegia, and tissue necrosis in humans. Therefore, the removal of this dye from waste streams before discharge to public water sources is of primary con-cern [2].
Precipitation, ion exchange, solvent extraction, bio-sorption, filtration, electrochemical treatment and adsorp-tion on oxides are the convenadsorp-tional methods for the re-moval of contaminants from aqueous solutions. These meth-ods are either expensive or cannot cope with high concentra-tions of contaminants. The adsorption process is used espe-cially in the water treatment field. Studies so far have fo-cused on adsorbents, such as alumina, magnetite, pyrolusite, rutile, zirconia, hydrous manganese oxide, silica, geothite, hematite, amorphous ferric oxide, bentonite, sphalerite, anatase, red mud, mica, illite, kaolinite and clay [3]. The cost of the adsorbent minerals indicates that cheaper and easily obtainable unconventional adsorbents should also be studied for the removal of pollutants from water. The need for economically viable industrial and wastewater processes that protect the environment and public health has led to research into processes using alternative water. Activated carbon, in granular or powdered form, is the most widely used adsorbent. It has a good capacity for the adsorption of organic molecules.
Commercially available activated carbons are usually derived from natural materials, such as wood or coal, and therefore, are still considered to be expensive [2]. Due to economical reasons, renewable sources like agricultural byproducts and waste materials have been investigated for a long time for the production of activated carbon. The activated carbons are products of physical and chemical methods. In the physical activation, a raw material is firstly carbonized and the carbonized material is secondly activat-ed by steam or carbon dioxide, i.e., there are two steps: carbonization step and activation step. In the chemical activation, a raw material is impregnated with an
activat-ing reagent and the impregnated material is heat-treated under an inert atmosphere. The carbonization step and the activation step simultaneously progress in the chemical activation [4]. Chemical method is used widely because of its lower activation temperature and high carbon prod-uct, large surface area yield as compared to the physical method [5].
A large amount of a woody residue is generated which is usually burnt in the landfield, releasing greenhouse gases. Alternatively, olive-tree wood has been used as a domes-tic fuel. In the last decades, however, this kind of use has lost importance due to the availability of other heating sources. Owing to its ligneous character, abundance and low cost the above-referred residue is suitable to be used as a raw material for the preparation of activated carbons. However, in spite of its potential use, only a few studies have been performed previously on the preparation of activated carbon from olive-tree wood [6]. The use of a suitable raw material is mainly conditioned by its availa-bility and cost due to these reasons; olive stone is a very important raw material for production of activated car-bon,. and in Turkey, olive stones and residues are a cheap and quite abundant agricultural waste.
In this study, activated carbon samples were prepared from olive stones via chemical activation with H3PO4. The effects of process variables, such as activation temperature and H3PO4 concentration, were investigated to optimize these parameters. The surface area, pore volumes and pore size of the activated carbon samples were characterized by BET surface area analyzer. The interaction between H3PO4 and olive stones was discussed by FTIR-ATR and SEM images giving information about morphology of activated carbon samples. The ζ-potential of activated carbon sus-pensions was investigated as a function of pH and solid to liquid ratio for understanding of the electokinetice proper-ties of activated carbon. The adsorption ability of pre-pared activated carbon was tested towards a cationic dye (methylene blue, MB). In our previous works, we investi-gated the adsorption and kinetice properties of MB onto perlite and sepiolite samples [7-9]. In the present study, the effects of solution pH, concentration, ionic strength and temperature on MB adsorption have been evaluated.
2. MATERIAL AND METHODS
2.1. Materials
The olive stone samples were collected from Manisa-Akhisar, Turkey. The raw material was ground, dried and sieved, and only the fraction with particle sizes in the range of 0-75 µm was selected for the preparation of acti-vated carbons. All chemicals, except methylene blue, were obtained from Merck and of analytical grade.
2.2. Methylene Blue (MB)
Methylene blue was chosen as an adsorbate in this study because of its known strong adsorption onto solids.
Methylene blue has a molecular weight of 373.9 g/mol, which corresponds to MB hydrochloride with three groups of water.
2.3. Preparation of Activated Carbon and Methylene Blue Solution
Waste biomass (100 g) was impregnated at different H3PO4 concentrations (0.1, 0.5, 1 and 5 M) for 24 h, and then, each of the mixtures was dired at 105 °C overnight. The impregnated samples were placed in a stainless steel reactor at 800 °C under N2 flow (10 psi/min) at a heating rate of 10 °C/min, and 2 h for carbonization. We deter-mined optimal concentration of H3PO4 from BET surface area measurments, and then, the same procedure was repeated at optimal concentration of H3PO4 under differ-ent carbonization temperatures (300, 400, 500, 600, 700 and 800 °C) for determining optimal carbonization tem-perature. After cooling the reactor to the room tempera-ture under N2 flow, the char was removed from the reac-tor. In order to remove the remaining H3PO4 on the char, it was washed by hot distilled water and filtered. The washing and filtration steps were repeated until the filtrate became neutral. The washed sample was dried at 105 °C for 24 h. From these experimental studies, we determined the optimal concentration (5 M H3PO4) and optimal car-bonization temperature (800 °C). This activated carbon sample was used for adsorption experiments.
Methylene blue was of A.R. grade (Carlo Erba) and used without further purification. Methylene blue was dried at 110 °C for 2 h before use. Stock solution concen-trations of MB (1×10⁻² and 1×10⁻³ mol/L) were prepared with distilled water, and other concentrations by dilution were in the range of 1×10⁻⁴ to 20×10-3 mol/L. Studies of MB adsorption onto activated carbon were carried out with these solutions.
2.4. Zeta Potential Measurement
The zeta potential of activated carbon suspensions was measured using a Zeta meter 3.0 equipped with a microprocessor unit. The unit automatically calculates the electrophoretic mobility of the particles and converts it to the zeta potential using the Smoluchowski equation. The Smoluchowski equation, the most elementary expression for zeta potential, gives a direct relation between zeta potential and electrophoretic mobility:
EM t D π t 4V ζ= ⋅ (1)
where, EM is electrophoretic mobility at actual tem-perature (Volt s/cm2), V
t is viscosity of the suspending liquid (cm2/s), D
t is the dielectric constant, π is a constant and ζ is the zeta potential (mV) [10]. The zeta potential measurements were carried out as a function of the solid to liquid ratio and pH. A sample of 0.05 g activated car-bon in 50 ml distilled water was added to a thermostatic shaker bath and rinsed for 24 h at 30±1 °C. The samples were allowed to stand for 1 min to let larger particles settle. An aliquot taken from the supernatant was used to measure the zeta potential. The average of 15
measure-ments was taken to represent the measured potential. The applied voltage during the measurements was generally varied in the range of 50–150 mV [7].
2.5. Adsorption Experiments
The adsorption experiments were carrried out at de-sired concentrations, temperatures and pH values. The pH of the solution was adjusted with NaOH or HCl solution by using an Orion 920A pH-meter with a combined pH electrode, standardized with NBS buffers before every measurement. A preliminary experiment revealed that about 24 h is required for the adsorption process to reach the equi-librium concentration. An incubator stirrer at 30 °C and 150 rpm for 24 h continuously agitated the mixture. A thermostated bath was used to keep the temperature con-stant. At the end of the adsorption period, the solution was centrifuged for 15 min at 3500 rpm. The samples at appropriate time intervals were pipetted from the reactor by the aid of a very thin point micropipette, which pre-vents the transition to solution of activated carbon sam-ples. Preliminary experiments showed that the effect of the separation time on the amount of adsorbed dye was negligible. The amount of adsorbed dye on activated car-bon was determined from absorbance measured with a Perkin Elmer Lambda 25 UV/VIS spectrophotometer at 663 nm (maximum absorbance). The amounts of dye ad-sorbed were cal-culated from the concentrations in solu-tions before and after adsorption. Each experimental point was an average of two independent adsorption tests. The MB concentration on activated carbon was calculate ac-cording to Eq. (2):
(
C C)
WVqe= 0− e (2)
where, Co and Ce are the inital and equilibrium liquid-phase concentrations of MB solution (mol/L), respectively; qe is equilibrium MB concentration on adsorbent (mol/g), V is the volume of MB solution (L), and W is the mass of activated carbon sample used (g) [7].
2.6. Characterization of Activated Carbon
BET surface area and porous properties of activated carbon were determined by N2 adsorption (at 77 K) using a surface analyzer (Quantachrome Ins., Nova 2200e). The activated carbon sample was degassed for 24 h at 250 °C to remove any moisture or adsorbed contaminants that may have been present on the surface. Micropore volume was obtained using the t plot method, total volume of pores was determined using DFT dV(r) method, and mes-opore volume was calculated from Vtotal (Vmeso = Vtotal
-Vmicro) equation. The characteristics of the activated car-bon samples are presented in Table 1.
TABLE 1 - Some physicochemical properties of the activated car-bon sample.
Properties Value
Total pore volume (cm3 g-1) 0.361
Mezopore volume (cm3 g-1) 0.342
Micropore volume (cm3 g-1) 0.019
Bulk density (g cm-3) 0.26
The surface physical morphology of activated carbon was determined by using a SUPRA Zeiss 50 VP scanning electron microscope (SEM). The functional groups on the surface of activated carbon were determined by using FTIR-ATR technique (Perkin Elmer Spectrum 100) in the range of 4000–600 cm−1 in the transmission mode.
3. RESULTS AND DISCUSSION
3.1. Characterization of Activated Carbon
3.1.1. BET Surface Area and Pore Structural Characterization
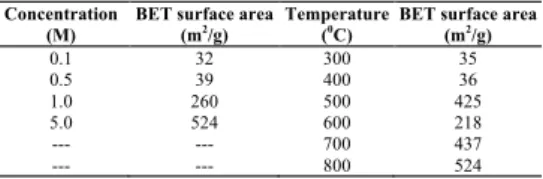
Surface areas of activated carbons synthesized by H3PO4 activation fromolive stones under different condi-tions have been given in Table 2. As the concentration in-creased, a rise in BET surface area has been observed. The tendency of the change in the specific surface area with the carbonization temperature resembles each other. BET sur-face area at optimal conditions (5 M H3PO4 and 1073 K) was found to be 524 m2/g. At low temperatures, surface area of activated carbon was lower because pores cannot be entirely opened. Pore size distribution, a very im-portant property of adsorbents, determines the fraction of the total pore volume accessible to molecules of a given size and shape. According to the classification of IUPAC-pore dimensions, the IUPAC-pores of adsorbents can be grouped into micropores (d<2 nm), mesopores (d=2–50 nm) and macropores (d>50 nm) [2]. The pore volume distributions of activated carbon (Table 1) show that a vast majority of the pores fell into the range of mesopores.
TABLE 2 - BET surface areas of the activated carbon samples. Concentration
(M)
BET surface area
(m2/g) Temperature (0C) BET surface area (m2/g)
0.1 32 300 35 0.5 39 400 36 1.0 260 500 425 5.0 524 600 218 --- --- 700 437 --- --- 800 524 3.1.2. SEM Analysis
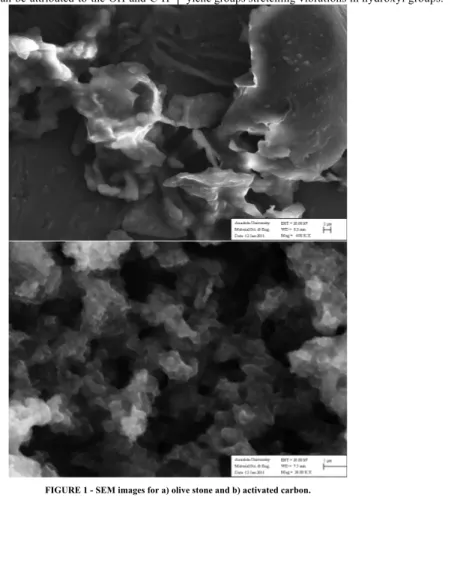
Scanning electron microscopy (SEM) technique was employed to observe the surface physical morphology of activated carbon synthesised from the olive stones. Figure 1 shows SEM photographs of olive stone and activated carbon at optimum conditions. It can be seen from SEM image that olive stone is non-porous, while many large pores were developed on the surface of activated carbon by H3PO4 activation. The external surface of the activated carbon is full of cavities. According to the micrograph, it seems that the cavities resulted from the evaporation of H3PO4 during carbonization, leaving the space previously occupied by H3PO4.
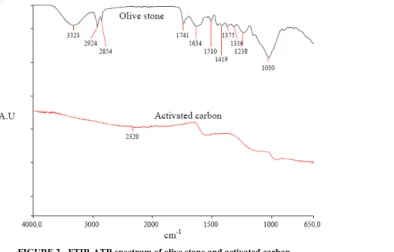
3.1.3. FTIR-ATR Analysis
The FTIR-ATR spectrum of olive stone and activated carbon prepared from olive stones at 800 °C are shown in
a
b
Fig. 2. The spectrum of olive stone exhibited a wide band
at 3323 cm-1 which can be attributed to the OH and C-H vibration of aliphatic groups, such as methyl and meth-ylene groups stretching vibrations in hydroxyl groups.
FIGURE 2 - FTIR-ATR spectrum of olive stone and activated carbon.
The peak at 1741 cm-1 is usually assigned to C=O stretch-ing vibrations in ketones, aldehydes, lactones and carbox-ylic groups. Absorption due to C-O vibrations occurs at 1238 cm-1. The carbonization of olive stones led to a break-up of the bonds of ketones, aldehydes, lactones and carboxylic groups, and then, evaporating them as volatile matter [11]. The decrease in the oxygen groups, following the heat treatment process of pyrolysis, indicates that these parts of the functional groups are thermally unstable [11]. No peaks will be observed corresponding to any functional group for the activated carbon sample, and there is only elemental carbon [12].
3.2. Adsorption
The adsorption of MB on activated carbon from aqueous solutions has been investigated as a function of pH, ionic strength and temperature.
3.2.1. Effect of pH
The pH influences the development of positive and negative surface charges, which directly affect the surface adsorption. The amphoteric nature of carbon depends on not only the surface functional groups of the carbon but also the isoelectric point or point of zero charge of the activated carbon [13]. The surface properties of the acti-vated carbon change with increase in pH because the positive charge on solution interface decreases and the activated carbon surface appears to be negatively charged. Figure 3 shows the variation of zeta potential with equi-librium pH of activated carbon suspensions. As seen from the figure, the zeta potential of activated carbon suspen-sion has decreased with increase in its equilibrium pH, and it has an isoelectrical point at approximately pH 2.50, and activated carbon surface is negatively charged. Figure 4 shows the effect of pH on adsorption of MB onto the activated carbon. The pH of solutions is one of the most important factors which affects MB adsorption as it con-trols the electrostatic interactions between the adsorbent
and the adsorbate. The surface properties of the carbon change with an increase of pH. The surface acidity of the activated carbons might affect the pH of the solution for the adsorption of MB onto the activated carbons. When the pH value increased, the surface of the activated carbon was more negatively charged. Thus, the adsorption of the MB reached a maximum at pH 9.
3.2.2. Effect of Ionic Strength
The ionic strength of solution has a significant role in adsorption process. In this study, NaCl was chosen as salt in order to examine the influence of the ionic strength influencing the adsorption of MB on the surface of acti-vated carbon synthesized from olive stones. Experiments have been conducted in the concentrations of 0, 1x10⁻³, 1x10⁻² and 1x10⁻¹ mol/L of NaCl. Figure 5 illustrates the influence of the ionic strength to MB adsorption on acti-vated carbon. As seen from Fig. 5, it was noticed that the adsorbed amount of MB on the surface of active carbon increased with increasing ionic strength. The presence of
-60 -50 -40 -30 -20 -10 0 10 20 30 0 2 4 6 8 10 pH Z et a pot ent ia l ( m V )
FIGURE 3 - Variation of zeta potential with equilibrium pH of activated carbon suspension.
0 2 4 6 8 10 12 14 16 18 20 0 20 40 60 Ce(mol/L)x105 qe (m ol /g) x10 5
FIGURE 4 - The effect of solution pH to MB adsorption on the activated carbon. 0 5 10 15 20 25 30 35 40 0 10 20 30 40 50 Ce(mol/L)x105 q e (m ol /g) x10 5
FIGURE 5 - The effect of ionic strength to MB adsorption on the activated carbon. 0 5 10 15 20 25 30 35 0 10 20 30 40 50 60 Ce(mol/L)x105 qe (m ol /g) x10 5
FIGURE 6 - The effect of temperature to MB adsorption on the activated carbon.
NaCl in the solution may have two opposite effects. On the one hand, since the salt screens the electrostatic inter-action of opposite charges of the surface and the dye molecules, the adsorbed amount should decrease with increase of NaCl concentration. On the other hand, the salt causes an increase in the degree of dissociation of the dye molecules by facilitating the protonation. The ad-sorbed amount increased when the dissociated dye ions for binding electrostatically onto the surface of oppositely charged ions increased [14, 15]. The latter effect seems to be dominant for the adsorption capacity of the activated carbon. For the adsorption of BBF by soils and mala-chite green by husk-based activated carbon, the adsorp-tion was also found to increase with increasing ionic strength [16, 17].
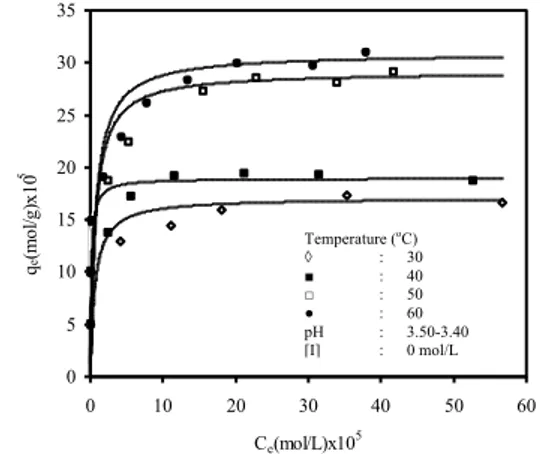
3.2.3. Effect of Temperature
To investigate the effect of temperature, the equilibri-um adsorption capacity for MB onto the activated carbon was studied in the temperature range of 30-60 °C. The variation of adsorbed MB amount with temperature is presented in Fig. 6. The experimental results indicated that the magnitude of adsorption was proportional to the solution temperature. We found that the adsorbed amount of MB increased significantly when temperature increased from 30 to 60 °C. This fact may be due to increasing MB mobility with increasing of temperature [18]. An increas-ing number of molecules may also acquire sufficient energy to undergo an interaction with active sites at the surface. The maximum adsorption capacity for MB onto activated carbon was 8.84x10⁻⁴ mol/g. The adsorbed amount of MB on the surface of activated carbon increas-es with increase in temperature indicating that the procincreas-ess of adsorption is an endothermic one, being opposite to the exothermic adsorption usually encountered.
The isosteric heat of adsorption, ΔH°, from the ad-sorption data at various temperatures as a function of pH ◊ : 3 ■ : 5 □ : 7 ● : 9 [I] : 0 (mol/L) t : 30 oC [I] (mol/L) ◊ : 0 ■ : 0.001 □ : 0.010 ● : 0.100 pH : 3.50-3.40 t : 30 oC Temperature (oC) ◊ : 30 ■ : 40 □ : 50 ● : 60 pH : 3.50-3.40 [I] : 0 mol/L
coverage fraction (θ = qe/qm) can be estimated from the following equation [19]:
( )
0.5 e g 01/T
)
(lnC
R
ΔH
= θ"
#
$
%
&
'
∂
∂
=
−
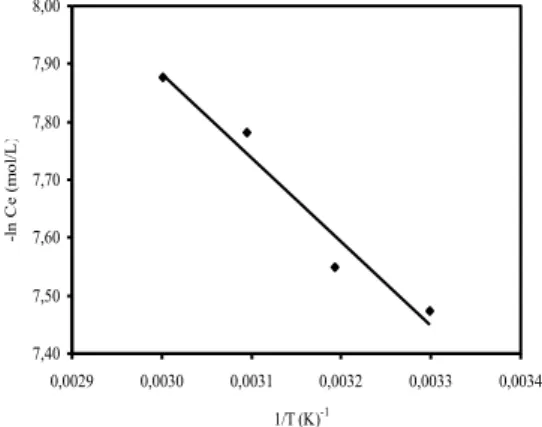
(3)where, Rg is the gas constant. Figure 7 shows the plots of –lnCe against 1/T. The value of ΔH was calculated at a specific coverage fraction of 0.5 as 11.30 kJ/mol. The re-sults show that the interactions between surface and ad-sorbate molecules are a physical interaction. Since adsorp-tion is an endothermic process, it would be expected that an increase in solution temperature would result in an increase of adsorption capacity [3]. Similar results were found for the adsorption of MV on perlite [20].
7,40 7,50 7,60 7,70 7,80 7,90 8,00 0,0029 0,0030 0,0031 0,0032 0,0033 0,0034 1/T (K)-1 -l n C e ( m ol /L )
FIGURE 7 - Plot of –ln Ce vs. 1/T for MB adsorption onto activated
carbon.
3.3. Adsorption Isotherms
The thermodynamic assumptions of adsorption iso-therms and their estimated parameters provide the insight for both the properties of the surface and the mechanism of adsorption [2]. The analysis of the isotherm data by fitting them to different isotherm models is an important step to find out the suitable model that can be used for design purposes. The amount of MB adsorbed (qe) has been plot-ted against the equilibrium concentration (Ce) as shown in Figs. 4-6. Several models have been published in the literature to describe the experimental data of adsorption. The Langmuir and Freundlich models are the most fre-quently employed models.
Langmuir isotherm is valid for monolayer adsorption on a surface containing a finite number of identical sites. The model assumes uniform energies of adsorption on the surface and no transmigration of adsorbate in the plane of the surface [19]. The Langmuir equation is commonly expressed as follows: e e m e
1
KC
KC
q
q
+
=
e m m e e C q 1 K q 1 q C ⋅ + = (4)In Equation (4), Ce and qe are defined as in Equation (2), K is a direct measure for the intensity of the adsorption pro-cess, and qm is a constant related to the area occupied by a monolayer of adsorbate, reflecting the adsorption capaci-ty. From a plot of Ce/qe vs. Ce, qm and K can be deter-mined from its slope and intercept.
The Freundlich isotherm is an empirical equation and shown to be satisfactory for low concentrations. The equa-tion is commonly given as follows:
n 1 e F e
K
C
q =
e F e C n K q ln 1ln ln = + (5)where, KF is a constant for the system, related to the bonding energy. KF can be defined as the adsorption or distribution coefficient and represents the quantity of dye adsorbed onto adsorbent for a unit equilibrium concentra-tion (i.e., Ce = 1 mol/L). The slope 1/n, ranging between 0 and 1, is a measure of adsorption intensity or surface heterogeneity, becoming more heterogeneous as its value is closer to zero. A value for 1/n <1 indicates a normal Langmuir isotherm while 1/n >1 is indicative of coopera-
tive adsorption. A plot of lnqe vs. lnCe enables the empiri-cal constants KF and 1/n to be determined from the inter-cept and slope of the linear regression [19].
Adsorption isotherms were obtained using Eqs. (4) and (5). Table 3 shows the results of Langmuir and Freund-lich isotherm analyses calculated for adsorption of MB dyes on activated carbon from aqueous solutions at different pH, ionic strength and temperature values. The isotherm data were calculated from the least square method and the related correlation coefficients (R2 values) are given in the same table. As seen from Table 3, the Langmuir equation represents the adsorption process very well; the R2 values were all higher than 0.99, indicating a very good mathe-matical fit. The fact that the Langmuir isotherm fits the
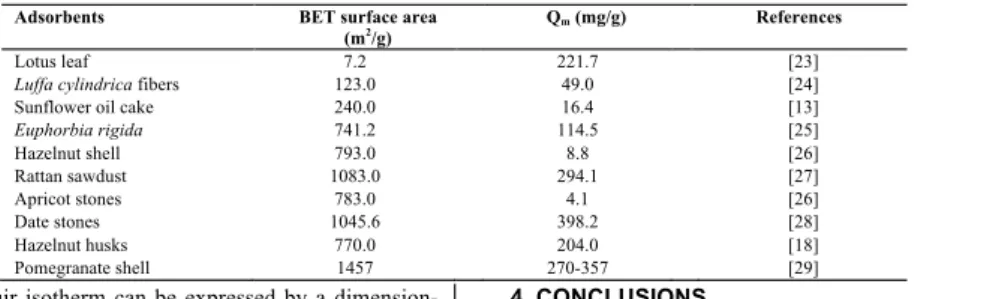
experimental data very well may be due to homogenous distribution of active sites on activated carbon surface; since the Langmuir equation assumes that the surface is homogenous [21]. A comparison between the adsorption capacities of activated carbon and other adsorbents under similar conditions is presented in Table 4. When compar-ing our results for activated carbon with those of other researchers, it can be concluded that the activated carbon adsorbed MB dye as effectively as the other adsorbents listed.
The shape of the isotherm may also be considered with a view to predicting if an adsorption system is ‘fa-vourable’ or ‘unfa‘fa-vourable’. The essential characteristics
TABLE 3 - Isotherm constants for MB adsorption onto activated carbon. Temperature
(°C) [I] (mol/L) pH
Langmuir isotherm Freundlich isotherm
RL qm (mg/g) K (L/mg) R2 R2 30 --- --- 119 0.77 0.99 0.87 0.01-0.98 40 --- --- 135 2.64 0.99 0.86 0.002-0.93 50 --- --- 213 0.42 0.99 0.98 0.02-0.98 60 --- --- 227 0.39 0.99 0.98 0.02-0.99 30 0.1000 --- 270 0.50 0.99 0.94 0.01-0.86 30 0.0100 --- 200 0.34 0.99 0.51 0.02-0.97 30 0.0010 --- 152 0.32 0.99 0.97 0.02-0.96 30 --- 3 118 0.73 0.99 0.97 0.01-0.98 30 --- 5 120 0.74 0.99 0.82 0.02-0.91 30 7 130 0.50 0.99 0.98 0.01-0.98 30 --- 9 135 0.44 0.99 0.97 0.01-0.98
TABLE 4 - Comparison of the maximum monolayer adsorption capacity of methylene blue on activated carbon prepared from different sources. Adsorbents BET surface area
(m2/g) Qm (mg/g) References
Lotus leaf 7.2 221.7 [23]
Luffa cylindrica fibers 123.0 49.0 [24]
Sunflower oil cake 240.0 16.4 [13]
Euphorbia rigida 741.2 114.5 [25] Hazelnut shell 793.0 8.8 [26] Rattan sawdust 1083.0 294.1 [27] Apricot stones 783.0 4.1 [26] Date stones 1045.6 398.2 [28] Hazelnut husks 770.0 204.0 [18] Pomegranate shell 1457 270-357 [29]
of Langmuir isotherm can be expressed by a dimension-less constant called equilibrium parameter, RL [22], which is defined as follows: e L KC 1 1 R + = (6)
The value of RL indicates the type of the isotherm to be either unfavorable (RL>1), linear (RL=1), favorable (0<RL<1), or irreversible (RL=0). The RL values reported in Table 3 show that the adsorption behavior of MB dye was favorable (0<RL<1).
4. CONCLUSIONS
In this study, activated carbon prepared from olive stones was successfully employed as an adsorbent for the quantitative removal of methylene blue from aqueous solution. The BET surface area of activated carbon under optimal conditions (800 °C and 5 M H3PO4) was found to be 524 m2/g. SEM images showed that the external sur-face of activated carbon synthesized by H3PO4 activation was full of cavities according to olive stones. FTIR-ATR spectra show that the olive stone had functional group peaks while activated carbon had not any functional group peak. Activated carbon suspension has an isoelectrical
point at approx. pH 2.50. The straight lines obtained for the Langmuir and Freundlich models obey to fit to the experimental equilibrium, but the Langmuir model gives a better fitting than Freundlich model. Value of RL was found to be in the range of 0.001-0.99 confirming that the prepared activated carbon is favorable for adsorption of MB. The adsorption process was endothermic and the enthalphy value was calculated to be 11.30 kJ/mol. These results indicated that the olive stone-based activated car-bon is effective, low cost, and an abundantly available adsorbent for MB removal from aqueous solutions.
The authors have declared no conflict of interest.
REFERENCES
[1] Berrios, M., Martin, A.M., Martin, A. (2012). Treatment of pollutants in wastewater: Adsorption of methylene blue onto olive-based activated carbon. Journal of Industrial and Engi-neering Chemistry 18, 780-784.
[2] Deng, H., Yang, L., Tao, G., Dai, J. (2009). Preparation and characterization of activated carbon from cotton stalk by mi-crowave assisted chemical activation-application in meth-ylene blue adsorption from aqueous solution. Journal of Haz-ardous Materials. 166, 1514-1521.
[3] Alkan, M., Doğan, M. (2001).Adsorption of copper (II) onto perlite. Journal of Colloid and Interface Science. 243, 280-291.
[4] Hayashi, J., Horikawa, T., Takeda, I., Muroyama, K. (2002). Preparing activated carbon from various nutshells by chemi-cal activation with K2CO3. Carbon. 40, 2381-2386.
[5] Guo, Y., Rockstraw, D.A. (2006). Physical and chemical properties of carbons synthesized from xylan, cellulose, and Kraft lignin by H3PO4 activation. Carbon. 44, 1464-1475.
[6] Idriss-Ould, A., Stitou, M., Cuerda-Correa, E.M., Gonzalez, C.F., Macias-Garcia, A., Alexandre-Franco, M.F., Gomez-Serrano, V. (2011). Preparation of activated carbons from ol-ive-tree wood revisited. I. Chemical activation with H3PO4.
Fuel Processing Technology. 92, 261-265.
[7] Doğan, M., Türkyılmaz, A., Alkan, M., Demirbaş, Ö. (2009). Adsorption of Copper (II) ions onto sepiolite and electroki-netic properties. Desalination. 238, 257-270.
[8] Demirbaş, O., Alkan, M., Dogan, M. (2002). The removal of victoria blue from aqueous solution by adsorption on a low-cost material. Adsorption. 8, 341–349.
[9] Doğan, M., Alkan, M., Türkyılmaz. A., Özdemir, Y. (2004). Kinetics and mechanism of removal of methylene blue by ad-sorption onto perlite. Journal of Hazardous Materials. B(109), 141-148.
[10] Doğan, M., Alkan, M., Çakir, Ü. (1997). Electrokinetic prop-erties of perlite. Journal of Colloid and Interface Science. 192, 114–118.
[11] Lua, A.C., Yang, T. (2004). Effect of activation temperature on the textural and chemical properties of potassium hydrox-ide activated carbon prepared from pistachio-nut shell. Jour-nal of Colloid and Interface Science. 274, 594-601.
[12] Kalavathy, H., Karthik, B., Miranda, L.R. (2010). Removal and recovery of Ni and Zn from aqueous solution using acti-vated carbon from Hevea brasiliensis: Batch and column studies. Colloids and Surface B: Biointerfaces. 78, 291-302. [13] Karagöz, S., Tay, T., Ucar, S., Erdem, M. (2008). Activated
carbons from waste biomass by sulfuric acid activation and their use on methylene blue adsorption. Bioresource Tech-nology. 99, 6214-6222.
[14] Tekin, N., Demirbaş, Ö., Alkan, M. (2005). Adsorption of cationic polyacrylamide onto kaolinite. Microporous and Mesoporous Materials. 85(3), 340-350.
[15] Vermöhlen, K., Lewandowski, H., Narres, H.D., Schwuger, M.J. (2000). Adsorption of polyelectrolytes onto oxides-the influence of ionic strength, molar mass, and Ca2+ ions.
Col-loids and Surface A. 163, 45–53.
[16] German-Heins, J., Flury, M. (2000). Sorption of Brilliant Bleu FCF in soils as affected by pH and Ionic strength. Ge-oderma. 97, 87–101.
[17] Guo, Y., Yang, S., Fu, W., Qi, J., Li, R., Wang, Z., Xu, H. (2003). Adsorption of malachite green on micro- and meso-porous rice husk-based active carbon. Dyes and Pigments. 56, 219–229.
[18] Imamoglu, M., Ozer, C., Turhan, Y., Boysan, F. (2012). Re-moval of methylene blue from aqueous solutions using phos-phoric acid activated carbon produced from hazelnut husks. Toxicological & Environmental Chemistry. 94, 1283-1293. [19] Doğan, M., Alkan, M., Onganer, Y. (2000). Adsorption of
methylene blue on perlite from aqueous solutions. Water, Air and Soil Pollution. 120, 229-248.
[20] Doğan, M., Alkan, M. (2003). Removal of methyl violet from aqueous solutions by perlite. Journal of Colloid and Interface Science. 267, 32-41.
[21] Ozdemir, Y. (2005). MSc thesis, Balıkesir University, De-partment of Chemistry, Balıkesir, Turkey; (in Turkish). [22] Pedro-Silva, J., Sousa, S., Rodrigues, J., Antunes, H., Porter,
J.J., Goncalves, I., Ferreira-Dias, S. (2004). Adsorption of ac-id orange 7 dye in aqueous solutions by spent brewery grains. Sep Purif Technol. 40, 309-315.
[23] Han, X., Wang, W., Ma, X. (2011). Adsorption characteris-tics of methylene blue onto low cost biomass material lotus leaf. Chemical Engineering Journal. 171, 1-8.
[24] Demir, H., Top, A., Balköse, D., Ülkü, S. (2008). Dye ad-sorption behavior of Luffa cylindrica fibers. Journal of Haz-ardous Matterials. 153, 389-394.
[25] Gerçel, Ö., Özcan, A., Özcan, S.A., Gerçel, H.F. (2007). Preparation of activated carbon from a renewable bio-plant of Euphorbia rigida by H2SO4 activation and its adsorption
be-havior in aqueous solutions. Applied Surface Science. 253, 4843–4852.
[26] Aygun, A., Yenisoy-Karakas, S., Duman, I. (2003). Produc-tion of granular activated carbon from fruit stones and nut-shells and evaluation of their physical, chemical and adsorp-tion properties. Microporous Mesoporous Mater. 66, 189– 195.
[27] Hameed, B.H., Ahmad, A.L., Latiff, K.N.A. (2007). Adsorp-tion of basic dye (methylene blue) onto activated carbon pre-pared from rattan sawdust. Dyes and Pigments. 75, 143-149. [28] Ahmed, M.J., Dhedan, S.K. (2012). Equilibrium isotherms
agri-cultural wastes-based activated carbons. Fluid Phase Equilib-ria. 317, 9-14.
[29] Türkyılmaz, A., Dogan, M. Alkan, M. (2013). Surface and adsorptive properties of activated carbon prepared from pom-egranate shell. Fresenius Environmental Bulletin 22, 3317-3325. Received: March 07, 2013 Accepted: April 23, 2013 CORRESPONDING AUTHOR Mehmet Doğan Balikesir University
Faculty of Science and Literature Department of Chemistry 10145 Balikesir TURKEY Phone: +90 266 612 10 00 Fax: +90 266 612 12 15 E-mail: [email protected]