Article
Insights into Autism Spectrum Disorder Genomic
Architecture and Biology from 71 Risk Loci
Highlights
d
De novo copy number variants (dnCNV) are associated with
Autism Spectrum Disorder/ASD
d
De novo mutations are associated with ASD in individuals
with a high IQ
d
Small de novo deletions, but not large dnCNVs, contain one
high-effect ASD risk gene
d
Identifies 6 ASD loci and 65 ASD genes, many of which target
chromatin or the synapse
Authors
Stephan J. Sanders, Xin He,
A. Jeremy Willsey, ..., Bernie Devlin,
Kathryn Roeder, Matthew W. State
Correspondence
[email protected] (S.J.S.),
[email protected] (M.W.S.)
In Brief
Through analysis of de novo mutations in
autism spectrum disorder (ASD), Sanders
et al. find that small deletions, but not
large deletions/duplications, contain one
critical gene. Combining CNV and
sequencing data, they identify 6 loci and
65 genes associated with ASD.
Sanders et al., 2015, Neuron87, 1215–1233 September 23, 2015ª2015 Elsevier Inc. http://dx.doi.org/10.1016/j.neuron.2015.09.016
Neuron
Article
Insights into Autism Spectrum Disorder
Genomic Architecture and Biology from 71 Risk Loci
Stephan J. Sanders,1,*Xin He,2A. Jeremy Willsey,1A. Gulhan Ercan-Sencicek,3Kaitlin E. Samocha,4,5,6A. Ercument Cicek,7,8Michael T. Murtha,3Vanessa H. Bal,1Somer L. Bishop,1Shan Dong,9Arthur P. Goldberg,10,11 Cai Jinlu,10,11John F. Keaney III,12Lambertus Klei,13Jeffrey D. Mandell,1Daniel Moreno-De-Luca,14
Christopher S. Poultney,10,11Elise B. Robinson,4,5Louw Smith,1Tor Solli-Nowlan,15Mack Y. Su,16Nicole A. Teran,17 Michael F. Walker,1Donna M. Werling,1Arthur L. Beaudet,18Rita M. Cantor,19Eric Fombonne,20Daniel H. Geschwind,21 Dorothy E. Grice,11Catherine Lord,22Jennifer K. Lowe,21Shrikant M. Mane,23Donna M. Martin,24Eric M. Morrow,25 Michael E. Talkowski,26James S. Sutcliffe,27Christopher A. Walsh,28Timothy W. Yu,28Autism Sequencing Consortium, David H. Ledbetter,29Christa Lese Martin,29Edwin H. Cook,30Joseph D. Buxbaum,10,11Mark J. Daly,4,5Bernie Devlin,13 Kathryn Roeder,7,31and Matthew W. State1,*
SUMMARY
Analysis of de novo CNVs (dnCNVs) from the full
Simons Simplex Collection (SSC) (N = 2,591 families)
replicates prior findings of strong association with
autism spectrum disorders (ASDs) and confirms six
risk loci (1q21.1, 3q29, 7q11.23, 16p11.2,
15q11.2-13, and 22q11.2). The addition of published CNV
data from the Autism Genome Project (AGP) and
exome sequencing data from the SSC and the
Autism Sequencing Consortium (ASC) shows that
genes within small de novo deletions, but not within
large dnCNVs, significantly overlap the high-effect
risk genes identified by sequencing. Alternatively,
large dnCNVs are found likely to contain multiple
modest-effect risk genes. Overall, we find strong
evidence that de novo mutations are associated
with ASD apart from the risk for intellectual disability.
Extending the transmission and de novo association
test (TADA) to include small de novo deletions
re-veals 71 ASD risk loci, including 6 CNV regions (noted
above) and 65 risk genes (FDR
% 0.1).
INTRODUCTION
Autism Spectrum Disorder (ASD) is characterized by impair-ments in social communication and restricted or repetitive behavior or interests. Until recently, the genetic etiology of ASD has remained obscure. Over the last decade, however, a key role for de novo germline mutation has been established definitively. Such mutations have led to the discovery of dozens of ASD risk loci and genes (De Rubeis et al., 2014; Dong et al.,
(Affiliations continued on next page)
1Department of Psychiatry, University of California, San Francisco, San Francisco, CA 94143, USA 2Department of Human Genetics, University of Chicago, Chicago, IL 60637, USA
3Department of Neurosurgery, Program on Neurogenetics, Yale University School of Medicine, New Haven, CT 06520, USA
4Analytic and Translational Genetics Unit, Department of Medicine, Massachusetts General Hospital and Harvard Medical School, Boston, MA 02114, USA
5Stanley Center for Psychiatric Research and Program in Medical and Population Genetics, Broad Institute of Harvard and MIT, Cambridge, MA 02142, USA
6Program in Genetics and Genomics, Biological and Biomedical Sciences, Harvard Medical School, Boston, MA 02114, USA 7Computational Biology Department, Carnegie Mellon University, Pittsburgh, PA 15213, USA
8Department of Computer Engineering, Bilkent University, Ankara, 0680, Turkey
9Center for Bioinformatics, State Key Laboratory of Protein and Plant Gene Research, School of Life Sciences, Peking University, Beijing 100871, People’s Republic of China
10Seaver Autism Center for Research and Treatment, Icahn School of Medicine at Mount Sinai, New York, NY 10029, USA 11Department of Psychiatry, Icahn School of Medicine at Mount Sinai, New York, NY 10029, USA
12Department of Chronic Disease Epidemiology, Yale School of Public Health, New Haven, CT 06520, USA 13Department of Psychiatry, University of Pittsburgh School of Medicine, Pittsburgh, PA 15213, USA 14Department of Psychiatry, Yale University School of Medicine, New Haven, CT 06520, USA 15TheLab, Inc., Los Angeles, CA 90068, USA
16Program in Biophysics, Harvard University, Boston, MA 02115, USA
17Department of Genetics, Stanford University School of Medicine, Stanford, CA 94305, USA
18Department of Molecular and Human Genetics, Baylor College of Medicine, One Baylor Plaza, T617, Houston, TX 77030, USA
19Departments of Human Genetics and Psychiatry, David Geffen School of Medicine, University of California, Los Angeles, 695 Charles E. Young Drive South, Los Angeles, CA 90095-7088, USA
20Department of Psychiatry and Institute for Development and disability, Oregon Health & Science University, Portland, OR 97239, USA 21Neurogenetics Program, Department of Neurology and Center for Autism Research and Treatment, Semel Institute, David Geffen School of Medicine, University of California, Los Angeles, Los Angeles, CA 90095, USA
2014; Iossifov et al., 2012, 2014; Neale et al., 2012; O’Roak et al., 2012; Sanders et al., 2012), as well as yielding important insights into the genomic architecture and biological mechanisms under-lying social disability (Chang et al., 2015; Parikshak et al., 2013; Pinto et al., 2014; Willsey et al., 2013). The Simons Simplex Collection (SSC), a cohort of simplex ASD families designed to facilitate the discovery de novo variation (Fischbach and Lord, 2010), has played a central role in this progress. Analysis of the SSC has demonstrated an excess of rare de novo mutations in probands versus unaffected siblings across a wide range of mu-tation types, from copy number variants (CNVs) (Levy et al., 2011; Sanders et al., 2011), to small insertion/deletions (indels) (Dong et al., 2014), and single nucleotide variants (SNVs) ( Iossi-fov et al., 2012, 2014; O’Roak et al., 2012; Sanders et al., 2012). Moreover, the cohort has helped lay a foundation for the creation of rigorous statistical frameworks to evaluate the association of de novo mutations (He et al., 2013; Liu et al., 2014; Sanders et al., 2011, 2012). In combination with exome analyses of addi-tional large ASD cohorts (De Rubeis et al., 2014; Liu et al., 2013; Neale et al., 2012), these frameworks have dramatically acceler-ated gene discovery in ASD.
Previous reports of approximately 1,000 SSC families (Levy et al., 2011; Sanders et al., 2011) replicated the association be-tween ASD and de novo CNVs (dnCNVs) (Itsara et al., 2010; Marshall et al., 2008; Sebat et al., 2007) and the role of CNVs at 16p11.2 in ASD (Kumar et al., 2008; Marshall et al., 2008; Weiss et al., 2008). By developing methods to assess the genome-wide significance of recurrent de novo events, we identified novel risk loci, including duplications at 7q11.23 (Sanders et al., 2011). The current study extends these ana-lyses to the entire SSC cohort (N = 10,220 individuals in 2,591 families). We replicate our prior findings in the newly analyzed SSC cohort; refine the estimates of locus heterogene-ity for dnCNVs in ASD to between 93 and 246 distinct loci; confirm the genome-wide significance of four CNV loci (Table 1); and revisit earlier findings of an increased mutation burden in females (Figure 2) and genotype-phenotype correla-tions (Figure 3). In addition, we combine dnCNV findings from the Autism Genome Project (AGP) (Pinto et al., 2014) with the SSC data in an omnibus analysis of large-scale dnCNVs that
yields four additional ASD risk loci with a false discovery rate (FDR)% 0.1 (Table 2).
Recent collaborative efforts have applied exome sequencing technology to the entire SSC cohort (Iossifov et al., 2014) iden-tifying 27 ASD associated genes (FDR of % 0.1). In parallel, 33 ASD risk genes (FDR% 0.1) were identified in the Autism Sequencing Consortium (ASC) cohort (De Rubeis et al., 2014) with 12 genes identified in both analyses (Table S6), in part due to the inclusion of 825 SSC trios in the ASC. Importantly, these approaches to gene discovery that are agnostic to hypothesized biological mechanism have enabled a series of similarly agnostic systems biological analyses of ASD. These have reliably pointed to the contribution of chromatin modifi-cation and synaptic functioning and provided insights into the neuroanatomical and developmental dimensions of ASD pathology, highlighting in particular the contribution of mid-fetal cortical projection neurons and striatal medium spiny neurons (Chang et al., 2015; Cotney et al., 2015; Parikshak et al., 2013; Pinto et al., 2014; Sugathan et al., 2014; Willsey et al., 2013; Xu et al., 2014).
Completion of genotyping and exome sequencing of the SSC now allows for a combined analysis of CNV, indel, and SNV data to assess further the contribution of rare and de novo variation in these simplex families (Figure 2). We find that small de novo deletions often contain a single ASD gene of high effect that overlaps with de novo loss of function (dnLoF; nonsense, canon-ical splice site, and frameshift indels; also called ‘‘likely gene dis-rupting’’ [LGD]) mutations (Figure 5). In contrast, large dnCNVs do not show similar evidence and are likely to contain multiple genes of low effect. Moreover, expanding the TADA methodol-ogy (He et al., 2013), we combine evidence from de novo small deletions, indels, and SNVs to provide a unified statistical quan-tification of ASD association that, in combination with published data from the ASC and AGP, identifies 65 ASD risk genes (FDR% 0.1) (Table 4). These 65 genes form a network of pro-tein-protein interactions composed of two sub-networks that are enriched for genes that encode either chromatin regulators or synaptic proteins (Figure 7). Of note, mutations in male and female probands are randomly distributed in these networks rather than clustering on sex-specific genes.
22Center for Autism and the Developing Brain, Weill Cornell Medical College, White Plains, NY 10605, USA 23Yale Center for Genomic Analysis, Yale University School of Medicine, New Haven, CT 06520, USA 24Departments of Pediatrics and Human Genetics, University of Michigan, Ann Arbor, MI 48109, USA
25Department of Molecular Biology, Cell Biology and Biochemistry and Department of Psychiatry and Human Behavior, Brown University, 70 Ship Street, Box G-E4, Providence, RI 02912, USA
26Center for Human Genetic Research, Departments of Neurology, Psychiatry, and Pathology, Massachusetts General Hospital, Boston, MA 02114, USA
27Department of Molecular Physiology & Biophysics, 6133 MRB III, Center for Molecular Neuroscience, Vanderbilt University, Nashville, TN 37232, USA
28Howard Hughes Medical Institute and Division of Genetics and Genomics, Children’s Hospital Boston, and Neurology and Pediatrics, Harvard Medical School Center for Life Sciences, 3 Blackfan Circle, Boston, MA 02115, USA
29Autism & Developmental Medicine Institute, Geisinger Health System, Danville, PA 17822, USA
30Institute for Juvenile Research, Department of Psychiatry, University of Illinois at Chicago, 1747 W. Roosevelt Road, Room 155, Chicago, IL 60637 USA
31Department of Statistics, Carnegie Mellon University, Pittsburgh, PA 15213, USA *Correspondence:[email protected](S.J.S.),[email protected](M.W.S.) http://dx.doi.org/10.1016/j.neuron.2015.09.016
RESULTS
SNP Genotyping, Sample Selection, and CNV Detection High-quality SNP genotyping data were generated for 10,220 individuals in 2,591 families from the SSC using the Illumina Omni2.5, 1Mv3, or 1Mv1 arrays (Figure 1 and Table S1). Of these, 2,100 families were quartets, consisting of an affected proband, two unaffected parents, and at least one unaffected sibling, whereas 491 families were trios with no unaffected siblings. As described previously, CNVs were predicted using PennCNV (Wang et al., 2007), QuantiSNP (Colella et al., 2007), and GNOSIS and merged with CNVision (Sanders et al., 2011). To improve the specificity of dnCNV predictions, we developed a novel metric to estimate a per CNV p value (pCNV) based on the per SNP variability in Log R Ratio (LRR) and the number of SNPs consistent with a deletion/duplication based on B Allele Frequency (BAF).
This metric outperformed our prior approach of selecting the intersection of PennCNV and QuantiSNP calls (Sanders et al., 2011). Performance was assessed by rediscovery of validated dnCNVs detected on the 1Mv3 array in biological replicates run on the higher-resolution Omni2.5 array. A receiver operating characteristic (ROC) curve was used to compare the two approaches with an area under the curve (AUC) of 0.82 for the prior approach compared to 0.99 for the new pCNV metric (Figure S2). For dnCNVs detectable by microarray, a pCNV threshold of p% 1 3 10 9resulted in 80% sensitivity, similar to that obtained in our prior analysis, and increased specificity from 60% to 100%. We therefore elected to use this threshold, eliminating the need for blinded visual inspection prior to confirmation (Figure S3). Rare variation was defined as a popu-lation frequency% 0.1% in either the Database of Genomic Variation (DGV) (MacDonald et al., 2014) or among all 5,382 SSC parents. This same population frequency threshold was
used in the exome analyses (De Rubeis et al., 2014; Iossifov et al., 2014).
Overall, we detected 180 autosomal dnCNVs, of which 175 were validated by qPCR (97% confirmation rate); all validations were performed blinded to affected status. Nine dnCNVs (5.0%) at six loci were excluded due to germline mosaicism, based on a mosaic CNV in the parent or the same dnCNV in multiple siblings (Table S2). The ensuing analysis was performed on the remaining 166 validated dnCNVs, of which 110 were pre-sent in the probands of 2,100 quartet families, 34 were prepre-sent in the siblings of the same 2,100 families, and 22 were found among 491 trios (Table S2).
De Novo CNVs Are Reproducibly Associated with ASD Risk
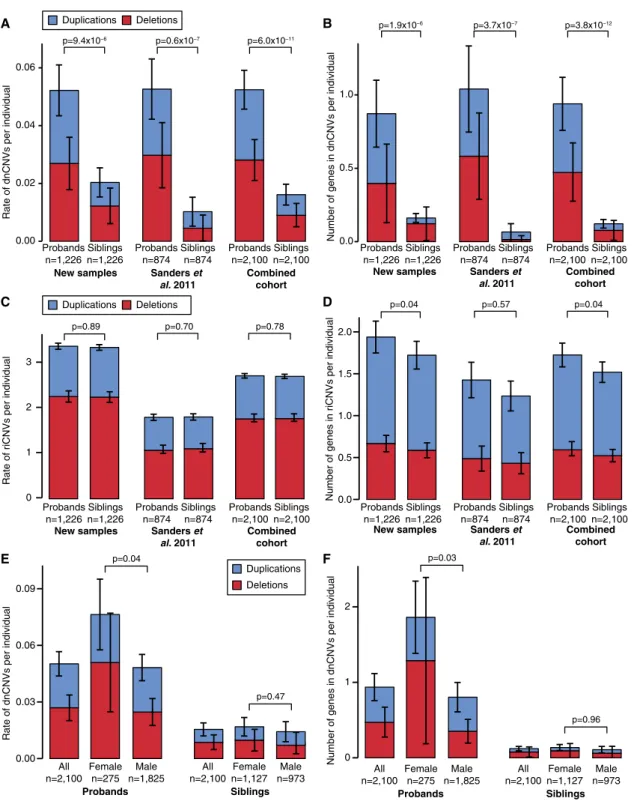
We first assessed whether our new CNV data replicated prior findings (Sanders et al., 2011). As observed previously (Levy et al., 2011; Sanders et al., 2011; Sebat et al., 2007), dnCNVs are more frequent in cases than controls (Figure 2). In the newly analyzed data (n = 1,226 quartets), we observed 64 dnCNVs in probands versus 25 dnCNVs in siblings (0.052 versus 0.020 dnCNVs per individual; ratio: 2.5, 95% CI: 1.6–4.1, p = 9.3 3 10 6, one-sided sign test). This increased burden is observed for both de novo deletions and duplications (p = 0.006 and p = 0.0007 respectively;Table S4). These results are consistent with our prior findings from a cohort of 874 quartet families (Sanders et al., 2011). The combined cohort of 2,100 quartet families shows 0.052 dnCNVs per proband compared to 0.016 dnCNVs per sibling (ratio: 3.1, 95% CI: 2.2–4.7, p = 6.03 10 11, one-sided sign test;Figure 2A).
As before (Sanders et al., 2011), a larger number of genes underlie dnCNVs in probands than siblings. In probands, 0.94 genes per individual were within the boundaries of a dnCNV compared with 0.12 genes per individual in siblings (ratio: 7.7,
Table 1. Regions with Multiple dnCNVs in the SSC (FDR% 0.1)
Band Location (hg19) dnCNVs (del/dup) RefSeq Genes Genesa p Value (Corrected) q Value (FDR) 1q21.1 chr1:146,467,203-147,858,208 5 (0/5) 13 – 0.00008 0.00002 3q29 chr3:195,747,398-197,346,971 3 (3/0) 21 – 0.14 0.05 7q11.23 chr7:72,773,570-74,144,177 4 (0/4) 22 – 0.004 0.001 7q11.23 chr7:73,978,801-74,144,177b 5 (0/5) 2 GTF2I, GTF2IRD1 0.00008 0.00002 7q11.23 chr7:74,455,447-74,488,775 3 (1/2) 1 WBSCR16 0.31 0.06 15q11.2-13.1 chr15:23,683,783-28,471,141 5 (0/5) 13 – 0.00008 0.00002 15q12 chr15:26,971,834-27,548,820c 6 (0/6) 3 GABRB3, GABRA5, GABRG3 13 10 6 63 10 7 15q13.2-13.3 chr15:31,245,880-32,515,849 4 (2/2) 7 – 0.01 0.002 16p11.2 chr16:29,655,864-30,195,048 13 (8/5) 27 – <13 10 10 <13 10 10 16q23.3 chr16:82,660,399-83,830,215d 3 (3/0) 1 CDH13 0.13 0.05 22q11.21 chr22:18,886,915-21,052,014 4 (2/2) 36 – 0.31 0.06
aWhere%3 genes are present, they are listed to clarify the genomic location.
bThis is the region of intersection between an atypical dnCNV and the Williams-Beuren Syndrome locus (seeFigure S5). cThis is the region of intersection between an atypical dnCNV and the 15q11.2-13.1 locus (seeFigure 6F).
95% CI: 4.2–17.1, p = 3.83 10 12, one-sided paired Wilcoxon signed-rank test (WSRT);Figure 2B). The difference between the individual-based and gene-based analyses is due to the larger size of dnCNVs in probands (median size 875 kbp in pro-bands versus 147 kbp in siblings) and higher density of genes in proband dnCNVs (p = 0.04, linear regression; Figure S4). Therefore, dnCNVs in probands are more frequent, larger, and more gene-rich than those observed in siblings.
Previously, we noted that more genes map within dnCNVs in female probands than male probands, consistent with a fe-male protective effect (Sanders et al., 2011). This observation was replicated in an independent cohort of neurodevelopmental disorders (Jacquemont et al., 2014). In the current analysis, 1.9 genes are found within dnCNVs per proband among 275 female probands versus 0.8 genes within dnCNVs per proband among 1,825 male probands (ratio: 2.3, 95% CI: 1.0–4.6, p = 0.01, one-sided unpaired WRST;Figure 2F). We previously noted a trend toward a higher burden of dnCNVs in female probands (Sanders et al., 2011). With the increased power afforded by the current expanded dataset this trend is now significant; dnCNVs are observed at a rate of 0.076 in female probands compared to 0.049 in male probands (ratio: 1.6, 95% CI: 0.9– 2.3, p = 0.04, one-sided Fisher’s exact test; Figure 2E). Of note, these findings are predominantly due to de novo deletions (ratio: 2.0, 95% CI: 1.0–3.5, p = 0.02, Fisher’s exact test; Fig-ure 2E) rather than de novo duplications (ratio: 1.1, 95% CI: 0.3–1.9, p = 0.51, Fisher’s exact test). No difference in burden between the sexes was observed in unaffected siblings ( Fig-ure 2E;Table S4).
Rare Inherited CNVs Show Limited Evidence of ASD Association
We conducted similar analyses evaluating rare inherited auto-somal CNVs (riCNVs) (Table S3). As before (Sanders et al.,
2011), no significant excess of riCNVs was observed in probands with 5,713 riCNVs in 2,100 probands versus 5,687 riCNVs in 2,100 siblings (2.72 versus 2.71 per individual; ratio: 1.00, 95% CI: 0.97–1.04, p = 0.70, one-sided paired WRST;Figure 2C). A slight excess of genes was observed within proband riCNVs compared to sibling riCNVs (1.72 genes per proband versus 1.52 genes per sibling; ratio: 1.13, 95% CI: 1.04–1.24, p = 0.04, one-sided paired WRST;Figure 2D). These results were unchanged considering deletions or duplications separately (Table S4). The findings suggest that, overall, the contribution of riCNVs detectable by microarray must be small in simplex ASD. However, the observation of transmitted CNVs mapping to known ASD risk loci in some affected individuals supports the conclusion that a small subset of riCNVs does confer ASD risk.
Given the very modest risks imparted by riCNVs, we antici-pated little difference in riCNV burden between the sexes, despite strong evidence for a female protective effect for de novo mutations. Accordingly, we observed no excess of riCNVs in female probands versus male probands (2.80 riCNVs/female versus 2.71 riCNVs/male; ratio: 1.03, 95% CI: 0.93–1.15, p = 0.21, one-sided paired WRST). Consistent with prior microarray analyses (Pinto et al., 2014; Sanders et al., 2011), but in contrast to analyses of small CNVs detected in exome data (Krumm et al., 2013; Krumm et al., 2015), we observe no excess of maternally inherited riCNVs in probands, with 2,813 riCNVs inherited from the father compared with 2,680 riCNVs inherited from the mother (p = 0.96, binomial distribution, one-sided). This difference may be the consequence of varying approaches and detection thresh-olds in CNV prediction. Similarly, we observed no increased burden of riCNVs in the mothers of SSC families compared to the fathers (5,350 in mothers versus 5,505 in fathers, p = 0.93, Binomial test, one-sided) using the detection thresholds
Table 2. Regions with Multiple dnCNVs in the SSC and AGP (FDR% 0.1)
Band Location (hg19) dnCNVs (del/dup) RefSeq Genes Genesa p Value (Corrected) q Value (FDR) 1q21.1 chr1:146,467,203-147,801,691 9 (1/8) 13 – 63 10 9 23 10 9 2p16.3 chr2:50,145,643-51,259,674b 8 (7/1) 1 NRXN1 13 10 7 43 10 8 3q29 chr3:195,747,398-196,191,434 4 (4/0) 7 – 0.07 0.02 7q11.23 chr7:72,773,570-74,144,177 5 (1/4) 22 – 0.005 0.0008 7q11.23 chr7:72,773,570-73,158,061c 6 (1/5) 10 – 0.0002 0.00003 7q11.23 chr7:73,978,801-74,144,177c 6 (1/5) 2 GTF2I, GTF2IRD1 0.0002 0.00003 15q11.2-13.1 chr15:23,683,783-28,446,765 10 (0/10) 13 – <13 10 10 <13 10 10 15q12 chr15:26,971,834-27,548,820d 11 (0/11) 3 GABRA5, GABRB3, GABRG3 <13 10 10 <13 10 10 15q13.2-13.3 chr15:30,943,512-32,515,849 5 (3/2) 7 – 0.005 0.0008 16p11.2 chr16:29,655,864-30,195,048 19 (12/7) 27 – <13 10 10 <13 10 10 22q11.21 chr22:18,889,490-21,463,730 8 (4/4) 45 – 13 10 7 43 10 8 22q13.33 chr22:51,123,505-51,174,548 4 (4/0) 1 SHANK3 0.07 0.02
aWhere%3 genes are present they are listed to clarify the genomic location. bEight dnCNVs overlap at least one exon of this gene.
cThese are the regions of intersection between two atypical dnCNVs and the Williams-Beuren Syndrome locus (seeFigure S5). dThis is the region of intersection between an atypical dnCNV and the 15q11.2-13.1 locus (seeFigure 6F).
described in a prior study that reported such a finding (Desachy et al., 2015).
Recurrent De Novo CNVs Identify Six ASD Risk Loci The clustering of dnCNVs at a given locus in unrelated probands can be used to assess association when compared to the null expectation derived from dnCNVs in unaffected siblings (Sanders et al., 2011). Using this approach, we previously iden-tified two loci with genome-wide significance in the SSC and predicted the discovery of two to three additional regions in the entire SSC. As anticipated, in the current study, a total of four loci reach genome-wide significance (p < 0.05; FDR % 0.01): two previously identified (7q11.23 duplications and 16p11.2 [BP4-5] deletions and duplications) and two additional loci (1q21.1 duplications and 15q11.2-13.1 [BP2-3]
duplica-This manuscript CNVs: SNP genotyping of 2,591 SSC families Iossifov et al. 2014 Exome sequencing of 2,508 SSC families SSC CNV burden Levy et al. 2014 CNVs: array CGH of 887 SSC families CNV vs. exome gene overlap Pinto et al. 2014 CNVs: SNP genotyping of 2,096 AGP trios De Rubeis et al. 2014 Exome sequencing of 3,871 ASC cases Dong et al. 2014 Indel discovery in 787 SSC families dnCNV/dnLoF gene discovery Systems Analysis
Figure 4. ASD association across the spectrum of
mutation sizes
Figure 5 and 6. De novo small deletions overlap
with exome mutations
Table 4. 65 ASD genes identified in the combined
dataset (FDR ≤0.1)
Table 3. dnCNVs and dnLoF contribute risk in
10.5% of ASD cases
Figure 7. Protein-protein interaction finds chromatin and synaptic networks SSC
Genotype-Phenotype
Figure 2. ASD association for dnCNVs, riCNVs and
by sex for dnCNVs
Table 1 and 2. 8 ASD loci identified from SSC and
AGP dnCNVs (FDR ≤0.1) dnCNV locus discovery Figure 3. Phenotypic factors associated with a dnCNV or dnLoF SSC CNV and exome burden
Figure 1. Overview of the Analysis This manuscript describes the analysis of CNVs predicted from SNP genotyping data in 2,591 families from the SSC (green). The analysis steps are shown in the middle of the flowchart (purple). Additional datasets from genomic analysis of the SSC (blue) and other ASD cohorts (light blue) are integrated to maximize power. The results of the analysis are shown in the figures (red) and tables (light red), along with the text of the manuscript.
tions). Relaxing the detection threshold to an FDR% 0.1 identifies three further loci: 3q29 deletions, 22q11.2 deletions and duplications, and deletions at
Cad-herin 13 (CDH13) (Table 1). No locus met this threshold in the sibling data.
Integrating the SSC data with previ-ously published dnCNVs identified among 2,096 trios from the AGP (Pinto et al., 2014) identifies two additional intervals reaching genome-wide significance: de-letions at Neurexin 1 (NRXN1) and dele-tions and duplications at 22q11.2 (Table 2). Moreover, at an FDR threshold of% 0.1, two further loci are identified: de-letions at 3q29 and dede-letions at 22q13.33 that include the gene SHANK3. No further dnCNVs were reported in the AGP at the
CDH13 locus, resulting in an FDR q value
of 0.20 for the combined analysis. All eight loci (Table 2) have previously been implicated in ASD (Bucan et al., 2009; Ku-mar et al., 2008; Leblond et al., 2014; Marshall et al., 2008; Mefford et al., 2008; Moreno-De-Luca et al., 2013b; Sanders et al., 2011; Weiss et al., 2008).
More than 200 De Novo CNV Loci Carry ASD Risk
By comparing the burden of dnCNVs in siblings to that of probands, and consid-ering the degree of dnCNV recurrence in probands, we previ-ously estimated a total of 234 distinct dnCNV loci that mediate ASD risk. Repeating this calculation (Supplemental Experimental Procedures) in the entire SSC, we estimate a total of 93 ASD risk loci for dnCNVs, 61 loci for de novo deletions, and 37 loci for de novo duplications. In the combined SSC and AGP cohort, we es-timate 246 total dnCNV risk loci, 181 loci for de novo deletions, and 168 loci de novo duplications.
The Presence of a De Novo Mutation Is Associated with a Reduction in IQ
Previously, we reported that the presence of a dnCNV was asso-ciated with a lower IQ in probands but that IQ was a weak predic-tor of de novo status (Sanders et al., 2011). Recent reports have described a similar reduction in IQ in the presence of a de novo
A Duplications Deletions B p=6.0x10⁻¹¹ p=0.6x10⁻⁷ p=9.4x10⁻⁶ 0.00 0.02 0.04 0.06
Rate of dnCNVs per individual
p=0.78 p=0.70
p=0.89
Rate of riCNVs per individual
p=3.8x10⁻¹² p=3.7x10⁻⁷ p=1.9x10⁻⁶ 0.0 0.5 1.0
Number of genes in dnCNVs per individual
Number of genes in riCNVs per individual
Probands n=1,226 p=0.04 p=0.57 p=0.04 0.00 0.03 0.06 0.09 0 1 2 Combined cohort Sanders et al. 2011 New samples Siblings n=1,226 Probands n=874 Siblings n=874 Probands n=2,100 Siblings n=2,100 Probands n=1,226 Siblings n=1,226 Probands n=874 Siblings n=874 Probands n=2,100 Siblings n=2,100 Combined cohort Sanders et al. 2011 New samples C Duplications Deletions D Probands n=1,226 Combined cohort Sanders et al. 2011 New samples Siblings n=1,226 Probands n=874 Siblings n=874 Probands n=2,100 Siblings n=2,100 Probands n=1,226 Siblings n=1,226 Probands n=874 Siblings n=874 Probands n=2,100 Siblings n=2,100 Combined cohort Sanders et al. 2011 New samples
Rate of dnCNVs per individual
All n=2,100 Female n=275 Male n=1,825 All n=2,100 Female n=1,127 Male n=973 p=0.04 p=0.47 Probands Siblings Duplications Deletions E F All n=2,100 Female n=275 Male n=1,825 All n=2,100 Female n=1,127 Male n=973 Probands Siblings
Number of genes in dnCNVs per individual
p=0.03 p=0.96 0 1 2 3 0.0 0.5 1.0 1.5 2.0
Figure 2. CNV Burden in the SSC
(A) The rate of dnCNVs per individual in probands and family-matched sibling controls for deletions (red) and duplications (blue) are compared for new families (n = 1,226; left), previously published families (n = 874; middle), and the combination of these two cohorts (n = 2,100; right).
(B) The analysis presented in (A) is repeated except the number of genes within dnCNVs per individual is displayed rather than the rate of dnCNVs per individual. (C and D) The analyses presented in (A) and (B) are repeated using riCNVs instead of dnCNVs.
(E) The rate of dnCNVs per individual is shown for probands (left three bars) and siblings (right three bars). Within each group, the rate of dnCNVs is shown for all individuals (left), females (middle), and males (right). No statistical comparison was made between probands and siblings for this analysis.
(F) The analysis in (E) is repeated except the number of genes within dnCNVs per individual is displayed rather than the rate of dnCNVs per individual. Statistical significance was calculated using a one-sided sign test for (A), a one-sided paired Wilcoxon ranked-sum test (WRST) for (B)–(D), and a two-sided unpaired WRST for (E) and (F). Whiskers show the 95% confidence intervals throughout (A)–(F).
LoF (dnLoF) mutation (Iossifov et al., 2014; Robinson et al., 2014; Samocha et al., 2014). Using the combined CNV and exome data in the SSC, we considered how sex and type of de novo mutation interact with non-verbal IQ (NVIQ).
For both males and females, we observe a reduction in NVIQ in the presence of either a dnLoF or dnCNV (8 point decrease in males, p = 43 10 6; 18 point decrease in females, p = 0.006; one-sided WRST;Figure 3A). In males there was no significant difference in the NVIQ between de novo deletions, duplications, or dnLoFs. In females, there was no difference in NVIQ between de novo deletions and duplications (p = 0.61); however, the median decrease in NVIQ was 12.5 points for dnLoF compared to 26 points for a dnCNV (p = 0.01;Figure 3A).
Overall, probands with an NVIQ below the proband median (89) had a 1.7-fold higher rate of de novo mutations compared to those with an NVIQ above the median (95% CI: 1.4–2.1; p = 13 10 7; one-sided WRST) and this effect was more pro-nounced in females (2.2-fold 95% CI: 1.3–3.8; p = 0.001) than males (1.6-fold 95% CI: 1.3–2.0; p = 33 10 5).
While a reduction in NVIQ is clearly associated with a dnCNV or dnLoF, we still observe a robust excess of de novo mutations in both male and female probands with an NVIQ between 91 and 110 compared to de novo mutations in siblings (p = 63 10 6for males; p = 33 10 3for females; WRST;Figure 3B). Furthermore, for the mutations with the highest confidence (FDR% 0.1;Tables 2andTable 4), we observe an excess burden in males even at an IQ above 130 (p = 0.04; WRST;Figure 5C). Therefore, despite the association between NVIQ and de novo status, a low NVIQ does not guarantee detecting a de novo mutation and a high NVIQ does not exclude an ASD-associated de novo mutation.
Phenotypic Features Associated with De Novo Mutations
Using the rich phenotypic data in the SSC, we tested whether other factors, along with sex and NVIQ, were associated with the presence of a dnCNV or dnLoF. The presence of an unaf-fected sibling increased the likelihood of observing a dnCNV or dnLoF (p = 0.001; WRST;Figures 3D and 3E) and this effect was amplified in the presence of multiple unaffected siblings. Similarly a history of seizures was associated with a higher de novo rate (p = 0.0008; WRST;Figures 3D and 3E); of note, this increase was observed equally for febrile and afebrile seizures (Figure S7). Similarly, a head circumference deviation of over 1 SD in either direction (Chaste et al., 2013) was associated with increased mutational burden. In contrast, we observed no difference in de novo burden in the presence of developmental regression or higher paternal or maternal age (Figure S7).
De Novo Mutations Contribute to ASD Risk in over 10% of Simplex Cases
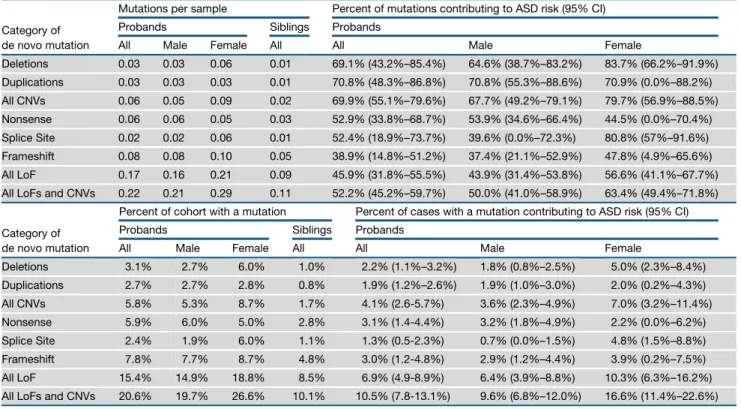
The family structure of the SSC, and the availability of both SNP genotyping and exome data (Iossifov et al., 2014), offer an exceptional opportunity to explore the genomic architecture of ASD risk factors. By subtracting the rate of de novo mutations in siblings from the rate in probands, we can estimate the fraction of observed proband de novo mutations that contribute to ASD risk. In probands, we estimate that 70% (95% CI: 55%–80%)
of dnCNVs and 46% (95% CI: 32%–56%) of dnLoF mutations carry ASD risk (Table 3). Both estimates are higher in females than males (Table 3).
By subtracting the percentage of siblings withR1 de novo mutation from the percentage of probands with R1 de novo mutation we can estimate the percentage of cases in whom a de novo mutation is contributing ASD risk. Based on this calcu-lation, we estimate that 4% (95% CI: 3%–6%) of cases have a dnCNV mediating ASD risk and 7% (95% CI: 5%–9%) of cases have a dnLoF mediating ASD risk. In total, 11% (95% CI: 8%– 13%) of simplex cases have a dnCNV and/or dnLoF mediating ASD risk (Table 3). In females, de novo mutations play a greater role in the ASD phenotype, contributing to ASD risk in 17% (95% CI: 11%–23%) of female probands and 10% (95% CI: 7%–12%) of male probands. Of note, these are conservative estimates for the overall contribution of de novo mutations to simplex ASD since they do not include very small CNVs, balanced structural variation, or variants discovered with sequencing aside from dnLoF.
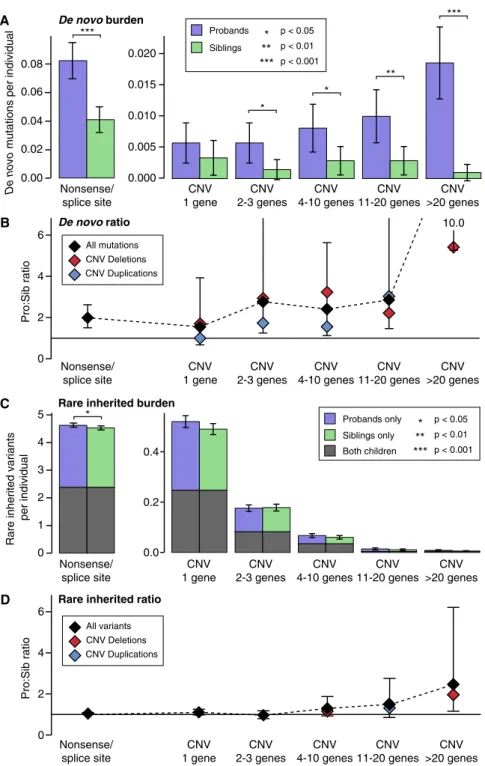
ASD Risk Varies Based on the Size of the Mutation To further understand the genomic architecture of ASD in the SSC, we estimated the burden of both SNVs and CNVs in pro-bands compared to their unaffected siblings divided by variant size and mode of inheritance (Figure 4). Variants were divided into six bins based on size, the first bin was nonsense/splice site SNVs and the remaining five bins were CNVs covering: 1 gene, 2–3 genes, 4–10 genes, 11–20 genes, and >20 genes. For this analysis only, frameshift indels were excluded due to the absence of accurate population frequency data to identify rare in-herited variants. Of note, we previously showed that both the burden and proband:sibling ratio of de novo frameshift indels is similar to that of de novo nonsense/splice site mutations (Dong et al., 2014).
De novo mutations were observed more frequently in pro-bands than siblings across the range of sizes. A similar proband: sibling ratio is observed for de novo nonsense/splice site and small de novo deletions, suggesting a similar fraction of these events mediate ASD risk. A higher ratio is observed for large dnCNVs. In contrast, no significant excess of rare inherited CNVs is observed at any size, though there is a trend toward an excess in probands for larger structural events (Figure 4).
Large De Novo CNVs and De Novo Point Mutations Target Different Genes
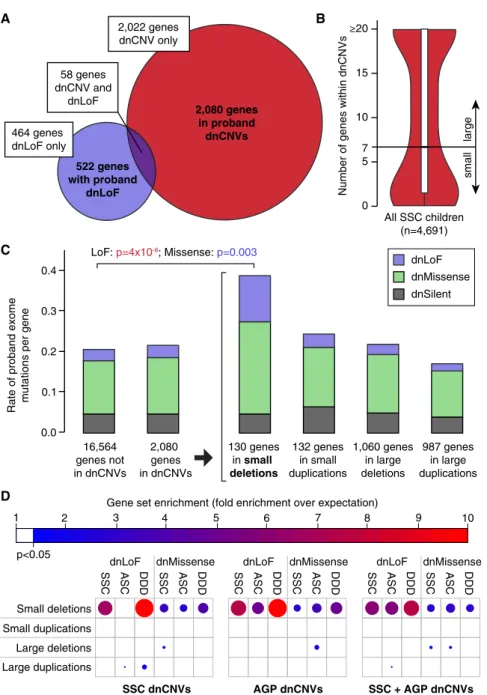
Multiple efforts have been made to fine map large multi-genic dnCNVs in search of one or a small number of risk genes. Using dnCNV data from 4,687 probands in the SSC (this manuscript; Levy et al., 2011; Sanders et al., 2011) and the AGP (Pinto et al., 2014) alongside exome data from 3,982 probands in the SSC (Iossifov et al., 2014) and ASC (De Rubeis et al., 2014), we sought to address the broader question of whether, overall, the overlap between genes within dnCNVs and those altered by dnLoF mutations (Figure 5A) was greater than expected by chance, as would be predicted if large dnCNVs included only a small number of risk genes.
To address this question, we asked whether there was an over-all excess of proband dnLoF, de novo missense (dnMissense),
A
B C
Male probands Female probands
40 80 120 160 Non-verbal IQ (NVIQ) No de novo n=227 de novo deletion n=16 de novo duplication n=12 dnLoF n=64 No de novo n=1,650 de novo deletion n=66 de novo duplication n=56 dnLoF n=293 0% 20% 40% 60%
Percent of probands with a dnLoF or dnCNV
0% 10% 20% ≤50 51-70 71-90 91-110 111-130 >130 Non-verbal IQ (NVIQ) Sibling mean ≤50 51-70 71-90 91-110 111-130 >130 Non-verbal IQ (NVIQ)
Percent of probands with a
dnLoF (FDR ≤ 0.1) or dnCNV (FDR ≤ 0.1) * p < 0.05 ** p < 0.01 *** p < 0.001 Female probands Male probands * p < 0.05 ** p < 0.01 *** p < 0.001 Female probands Male probands *** *** *** *** *** *** *** *** *** *** *** *** *** *** *** *** *** * Sibling mean 0% 10% 20% 30% 0% 5% 10% 15%
Percent of probands with a dnLoF or dnCNV
Percent of probands with a
dnLoF (FDR ≤ 0.1) or dnCNV (FDR ≤ 0.1) D E 0 1 ≥2 Number of siblings No Yes History of seizures Sibling mean Sibling mean Head size (z-score) 0-1 >1 0 1 ≥2 Number of siblings No Yes History of seizures Head size (z-score) 0-1 >1 p=0.001 p=0.001 p=0.14 p=0.0008 p=0.07 p=0.04 p=0.33 p=0.04 p=0.0005 p=0.01 p=0.14 (Del vs. Dup) p=0.24 (CNV vs. LoF) p=4x10⁻⁶ (None vs. CNV/LoF) p=0.61 (Del vs. Dup) p=0.01 (CNV vs. LoF) p=0.006 (None vs. CNV/LoF)
and de novo silent (dnSilent) mutations in the 1,794 unique genes within 119 large dnCNVs in probands. As there are very few large dnCNVs in siblings, we elected to use the number of proband dnLoF, dnMissense, and dnSilent mutations in the 16,564 genes not within any proband dnCNVs to calculate the null distribution. We observed no evidence of an excess of mutations from exome data in the genes within large dnCNVs, with 0.024 dnLoFs per gene within large dnCNVs compared with 0.031 dnLoFs per gene outside of dnCNVs (OR: 0.8; 95% CI: 0.5–1.0; p = 0.10, two-sided Fisher’s exact test; estimates corrected for gene mutability based on size and GC content;Figure 5C). Similarly, no difference was observed when we restricted the analysis of point mutations to dnMissense or dnSilent separately, when we considered various types of dnCNVs including large deletions,
large duplications, and large dnCNVs with the strongest evi-dence of association with ASD based on recurrence (FDR% 0.1), or when we considered the SSC cohort independently (Figures 5C andS8).
Small De Novo Deletions and De Novo LoFs Target a Common Set of Genes
In contrast to large dnCNVs, a similar analysis considering only small dnCNVs (N% 7 genes) (Figure 5C) showed an excess of dnLoF and dnMissense mutations. The 130 unique genes within 73 small de novo deletions in probands contained 0.127 dnLoF per gene compared with 0.031 dnLoFs per gene outside of dnCNVs (OR: 4.4; 95% CI: 2.4–17.5; p = 3.83 10 6, two-sided Fisher’s exact test; estimates corrected for gene mutability; Figure 5C). A modest excess of dnMissense
Figure 3. Genotype-Phenotype Correlations in the SSC
(A) The violin plot shows the distribution of non-verbal IQ (NVIQ) in male probands (left four violins) and female probands (right four violins). Each sex is split into four sets: probands with no dnCNVs or dnLoF mutations (gray), probands with a de novo deletion (red), probands with a de novo duplication (blue), and probands with a dnLoF (purple). Individuals with multiple de novo events in more than one category were included in all of the corresponding distributions. The overlaid boxplot shows the median and interquartile range (IQR). The horizontal black lines show the median for the probands with no dnCNVs or dnLoFs in each sex; the dashed line extends this estimate for females to the y axis. Statistical significance was calculated using a one-sided WRST; violin plots of deletions and du-plications together and deletions, dudu-plications, and LoF together are not shown.
(B) The percent of probands with a dnLoF or dnCNV (y axis) is shown for male (green) and female (pink) probands binned by NVIQ (x axis). p values reflect the difference in de novo rate compared with siblings (horizontal dashed line at 10.7%) using a one-sided Fisher’s exact test; the whiskers show the 95% confidence intervals. The size of the circles represents the number of individuals in each group ranging from 4 to 694.
(C) The analysis in (B) is repeated considering only de novo mutations at loci with an FDR% 0.1.
(D) The percent of probands with a dnLoF or dnCNV (y axis) is shown for three phenotypic factors. p values reflect the difference in de novo rate between groups of probands using a one-sided Fisher’s exact test; the whiskers show the 95% confidence intervals. The size of the circles represents the number of individuals in each group ranging from 170 to 2,177. The head size Z score is for the genetic deviation (Chaste et al., 2013).
(E) The analysis in (D) is repeated considering only de novo mutations at loci with an FDR% 0.1. Table 3. Contribution of De Novo Mutations to ASD Risk
Category of de novo mutation
Mutations per sample Percent of mutations contributing to ASD risk (95% CI)
Probands Siblings Probands
All Male Female All All Male Female
Deletions 0.03 0.03 0.06 0.01 69.1% (43.2%–85.4%) 64.6% (38.7%–83.2%) 83.7% (66.2%–91.9%) Duplications 0.03 0.03 0.03 0.01 70.8% (48.3%–86.8%) 70.8% (55.3%–88.6%) 70.9% (0.0%–88.2%) All CNVs 0.06 0.05 0.09 0.02 69.9% (55.1%–79.6%) 67.7% (49.2%–79.1%) 79.7% (56.9%–88.5%) Nonsense 0.06 0.06 0.05 0.03 52.9% (33.8%–68.7%) 53.9% (34.6%–66.4%) 44.5% (0.0%–70.4%) Splice Site 0.02 0.02 0.06 0.01 52.4% (18.9%–73.7%) 39.6% (0.0%–72.3%) 80.8% (57%–91.6%) Frameshift 0.08 0.08 0.10 0.05 38.9% (14.8%–51.2%) 37.4% (21.1%–52.9%) 47.8% (4.9%–65.6%) All LoF 0.17 0.16 0.21 0.09 45.9% (31.8%–55.5%) 43.9% (31.4%–53.8%) 56.6% (41.1%–67.7%)
All LoFs and CNVs 0.22 0.21 0.29 0.11 52.2% (45.2%–59.7%) 50.0% (41.0%–58.9%) 63.4% (49.4%–71.8%)
Category of de novo mutation
Percent of cohort with a mutation Percent of cases with a mutation contributing to ASD risk (95% CI)
Probands Siblings Probands
All Male Female All All Male Female
Deletions 3.1% 2.7% 6.0% 1.0% 2.2% (1.1%–3.2%) 1.8% (0.8%–2.5%) 5.0% (2.3%–8.4%) Duplications 2.7% 2.7% 2.8% 0.8% 1.9% (1.2%–2.6%) 1.9% (1.0%–3.0%) 2.0% (0.2%–4.3%) All CNVs 5.8% 5.3% 8.7% 1.7% 4.1% (2.6-5.7%) 3.6% (2.3%–4.9%) 7.0% (3.2%–11.4%) Nonsense 5.9% 6.0% 5.0% 2.8% 3.1% (1.4-4.4%) 3.2% (1.8%–4.9%) 2.2% (0.0%–6.2%) Splice Site 2.4% 1.9% 6.0% 1.1% 1.3% (0.5-2.3%) 0.7% (0.0%–1.5%) 4.8% (1.5%–8.8%) Frameshift 7.8% 7.7% 8.7% 4.8% 3.0% (1.2-4.8%) 2.9% (1.2%–4.4%) 3.9% (0.2%–7.5%) All LoF 15.4% 14.9% 18.8% 8.5% 6.9% (4.9-8.9%) 6.4% (3.9%–8.8%) 10.3% (6.3%–16.2%)
mutations (OR: 1.9; 95% CI: 1.2–2.9; p = 0.003), but not dnSilent mutations, was also observed (Figure 5C).
To demonstrate that this result was driven by ASD association, we repeated the analysis substituting in the sibling data. These were not used for the primary analysis due to the sparseness of de novo events in the siblings and the consequent reduction in power. There was no evidence of enrichment of sibling dnLoFs within proband small de novo deletions (p = 0.71, two-sided Fisher’s exact test), proband dnLoFs within sibling small de novo deletions (p = 0.24, two-sided Fisher’s exact test),
A B All variants CNV Deletions CNV Duplications Pro:Sib ratio Probands Siblings * p < 0.05 ** p < 0.01 *** p < 0.001 De novo
mutations per individual
Rare inherited variants
per individual Pro:Sib ratio C D De novo burden De novo ratio
Rare inherited burden
Rare inherited ratio
0.000 0.005 0.010 0.015 0.020 0 1 2 3 4 5 Nonsense/ splice site CNV 1 gene CNV 2-3 genes CNV 4-10 genes CNV 11-20 genes CNV >20 genes * * ** *** *** Probands only Siblings only * p < 0.05 ** p < 0.01 *** p < 0.001 0 2 4 6 Nonsense/ splice site CNV 1 gene CNV 2-3 genes CNV 4-10 genes CNV 11-20 genes CNV >20 genes 10.0 All mutations CNV Deletions CNV Duplications 0 2 4 6 Both children Nonsense/ splice site CNV 1 gene CNV 2-3 genes CNV 4-10 genes CNV 11-20 genes CNV >20 genes Nonsense/ splice site CNV 1 gene CNV 2-3 genes CNV 4-10 genes CNV 11-20 genes CNV >20 genes 0.00 0.02 0.04 0.06 0.08 0.0 0.2 0.4 *
Figure 4. Association of Genetic Factors with ASD across the Size Spectrum (A) The number of rare autosomal de novo muta-tions per individual are shown for dnLoF (nonsense and splice site only) in 1,911 SSC probands (pur-ple) and 1,911 family-matched sibling controls (green) and for dnCNVs binned into five sizes by gene content in 2,100 SSC probands (purple) and 2,100 family-matched sibling controls (green). A significantly higher burden of de novo mutation is observed across the size range with the exception of ‘‘1 gene’’; one-sided sign test; whiskers repre-sent 95% confidence intervals.
(B) The proband:sibling ratio for each size of de novo mutation is shown by the black diamonds and the black dashed line; whiskers represent the 95% confidence interval estimated by boot-strapping. The ratio is also shown for deletions (red) and duplications (blue).
(C) The analysis shown in (A) is repeated for rare inherited variants in the same individuals. Signifi-cance was estimated using a one-sided paired Wilcoxon ranked-sum test with only rare inherited nonsense/splice site variants reaching nominal significance.
(D) The analysis in (C) is repeated for rare inherited variants in the same individuals.
or sibling dnLoFs within sibling small de novo deletions (p = 1.00, two-sided Fisher’s exact test).
To ensure that the overlap between exome mutations and small de novo dele-tions was not driven by a single dataset, we next divided the exome data by cohort (SSC versus ASC) and also considered de novo mutations identified by exome sequencing in the Deciphering Develop-mental Disorders study (Deciphering Developmental Disorders Study, 2015), an independent cohort of individuals with developmental disability. Similarly, we split the dnCNVs by cohort (SSC, AGP, and the combination of SSC and AGP). Enrichment of de novo point mutations was consistently observed within small de novo deletions, but not for the other three categories of dnCNV (Figure 5D). Of note, these analyses are robust to variation of the number of genes used to define small versus large dnCNVs between three and ten (Figure S9).
We also compared the genes within small de novo deletions to five datasets previously reported to intersect with ASD-asso-ciated genes. All five datasets showed enrichment in genes in small de novo deletions in probands, specifically: two datasets of genes that show evolutionary constraint (p = 0.04, p = 13 10 5, logistic regression) (Petrovski et al., 2013; Samocha et al., 2014), one dataset of genes that are targeted by the Fragile X protein FMRP in mouse brain (p = 43 10 8, logistic
regression) (Darnell et al., 2011), and two datasets of genes that are bound by CHD8 using ChIP-seq (p = 0.04, p = 0.03, logistic regression) (Cotney et al., 2015; Sugathan et al., 2014). In contrast, none of these datasets were enriched in genes in small de novo deletions from the SSC siblings (p = 0.99, p = 0.46, p = 0.99, p = 0.99, p = 0.97, respectively; logistic regression).
The consistently strong enrichment of dnLoF mutations in small de novo deletions raises the possibility that these two clas-ses of mutation target a common set of genes that mediate ASD risk. Based on this hypothesis, we would expect this enrichment to be the most dramatic for the genes with the strongest evi-dence of ASD association in the exome data. To test this hypoth-esis, we used the transmitted and de novo association (TADA)
2 4 6 8
Gene set enrichment (fold enrichment over expectation)
Number of genes within dnCNVs
A B All SSC children (n=4,691) C D LoF: p=4x10⁻⁶; Missense: p=0.003 10 dnLoF dnMissense dnSilent 130 genes in small deletions 132 genes in small duplications 2,080 genes in dnCNVs 16,564 genes not in dnCNVs
Rate of proband exome
mutations per gene
1,060 genes in large deletions 987 genes in large duplications 0 5 10 15 ≥20 522 genes with proband dnLoF 2,080 genes in proband dnCNVs 58 genes dnCNV and dnLoF 0.0 0.1 0.2 0.3 0.4 7 2,022 genes dnCNV only 464 genes
dnLoF only large
small
SSC dnCNVs AGP dnCNVs SSC + AGP dnCNVs
dnLoF dnMissense
SSC ASC DDD SSC ASC DDD
dnLoF dnMissense
SSC ASC DDD SSC ASC DDD SSC dnLoFASC DDD dnMissenseSSC ASC DDD
Large deletions Large duplications Small deletions Small duplications 1 3 5 7 9 p<0.05
Figure 5. Small De Novo Deletions Are Enriched for Exome Mutations
(A) 2,080 unique genes are identified within pro-band dnCNVs (red) and 522 unique genes have dnLoFs in probands (purple); 58 unique genes are observed in both these datasets.
(B) The median number of genes within validated dnCNVs in the SSC is seven; this threshold is used to distinguish small and large dnCNVs.
(C) The number of de novo mutations per gene observed with exome sequencing of the SSC and ASC are shown in different groups of genes based on dnCNV overlap. Mutation rates are normalized for gene mutability based on gene size and GC content. Exome mutations are divided into silent (gray), missense (green), and LoF (purple). No excess of exome mutations is observed in the 2,080 genes within dnCNV regions compared to the 16,564 genes outside of dnCNVs. Dividing the dnCNV regions by size (%7 genes versus >7 genes) and type (deletion versus duplication) reveals strong enrichment for dnLoF (p = 43 10 6
, Fisher Exact Test) and dnMissense (p = 0.003) in small de novo deletions only.
(D) The enrichment of genes within dnCNVs is shown by the size and shade of the circle (red and large = high degree of enrichment; blue and small = modest degree of enrichment); only results reaching nominal significance (hypergeometric test) are shown. Small de novo deletions show consistent enrichment for dnLoF and dnMissense mutations across three cohorts: SSC, Autism Sequencing Consortium (ASC), and Deciphering Developmental Disorders (DDD). This result is observed for dnCNVs detected in the SSC and Autism Genome Project (AGP) independently and in combination.
test to combine exome data from the SSC and ASC (Table S5). The model was built on the background of the pub-lished TADA analysis from the ASC, including the ASC rare inherited exome variants (De Rubeis et al., 2014). We elec-ted not to include the rare inherielec-ted exome variants from the SSC, since these were not analyzed in a consistent manner to the ASC, their confirmation rate was not known, and their contribution to the TADA score is minimal. The TADA test gener-ates an FDR q value for every gene based on the evidence from exome sequencing and the per gene mutability (He et al., 2013). A low q value represents strong evidence for ASD association, therefore if dnLoF and de novo small deletions target a common set of genes we would expect specific genes within the deletions to have lower than expected TADA scores.
To assess the distribution of TADA q values in small de novo deletions, it was necessary to determine the expected q values under the null hypothesis (i.e., that small de novo deletions and exome variants do not target a common set of genes). A permutation test was used based on the mutability of genes within a dnCNV and the ability to detect these dnCNVs on a
microarray (a factor of gene size including introns, number of SNPs, and the interaction of these two terms; Figures S10–S12). Comparing the expected TADA q values from per-mutated genes (median q value of 100 permutations) with the observed TADA q values showed that over half the genes within small de novo deletions showed evidence of overlap with the exome data (Figure 6A). In contrast, like the large dnCNVs, the q values of de novo small duplications match expectation closely (Figure 6A). Therefore, after correcting for the number of genes within a CNV, small de novo deletions are enriched for ASD risk genes identified by exome data, while small de novo duplications (Figure 6A) and large dnCNVs (Figure 6B) are not.
A B C D 0.1 1 10 0.1 1 10 0.1 1 10 0.1 1 10
Observed TADA -log(q) per gene Observed TADA -log(q) per gene
Expected TADA -log(q) per gene Expected TADA -log(q) per gene SYNGAP1 ARID1B CHD2 TCF7L2 Deletions (130 genes) Duplications (132 genes) Deletions (1,060 genes) Duplications (987 genes) Small dnCNVs Large dnCNVs Highest -log(q) in large dnCNVs 14414_5230 12867.p1 230,700,000 230,800,000 3174_3 11592.p1 20,000,000 20,100,000 EFHB RAB5A PP2D1 KAT2B TRIP12 FBXO36 14609.p1 5386_3 AU144A NDAR_INVPC670BF4 14393.p1 10C106241 13447.p1 157,000,000 158,000,000 ARID1B TMEM242 SNX9 SYNJ2 SERAC1 GTF2H5 6325_3 6319_3 5237_3 12380.p1 70,400,000 70,600,000 70,800,000 SHANK2
Deletions and sample ID dnLoF and sample ID
E chr3: chr2: chr11: chr6: 15q11.2-13 3q29 7q11.23 16p11.2 22q11.2 1q21.1 15q11.1 15q11.2 15q12 15q13.1 q13.2 15q13.3
CYFIP1 UBE3A GABRB3 CHRNA7
BP1 BP2 BP3 BP4 BP5 14687.p1 12007.p1 20187_1464001 8630_201 20069_1328001 14550.p1 17035_1 14634.p1 13050_593 14159.p1 13355.p1 16040_1571029001 13301.p1 13647.p1 11928.p1 DEASD_0083_001 20,000,000 25,000,000 30,000,000 F chr15:
Deletions and sample ID dnLoF and sample ID Duplications and sample ID Segmental duplications
44 genes:
Figure 6. Small De Novo Deletions Intersect with ASD Genes
(A) The TADA FDR q value is an assessment of ASD association based on de novo and inherited variants identified by exome sequencing in the context of estimates of gene mutability. A low TADA FDR q value (high –log(q)) represents stronger ASD association. Observed TADA –log(q) values are shown against expected TADA –log(q) values derived from permutation testing. Each point represents one gene within a proband dnCNV. The black line represents random sam-pling of the genome, with no increased overlap between genes in dnCNVs and the genes identified by exome sequencing in ASD. Small de novo de-letions (red, on the left) deviate dramatically from this expectation while the other three categories show expected or slightly less than expected enrichment for ASD genes. The four genes with the strongest evidence for ASD association are labeled for the small de novo deletions (left). The individual genes with the highest -log(q) value (Table S6) within each of six large dnCNV loci with the strongest evidence for ASD association (Table 2) are indicated by the locus name (right). (B) Three small de novo deletions and one dnLoF are observed in SHANK2.
(C) Two small de novo deletions and five dnLoF are observed in ARID1B.
(D) One small de novo deletion and one dnLoF are observed in KATB2.
(E) One small de novo deletion and one dnLoF are observed in TRIP12.
(F) Of the six large dnCNV loci with the strongest evidence for ASD association (Table 2) the 15q11.2-13 contains the gene with the lowest -log(q) value from the exome data: GABRB3.
The observed distribution of TADA q values would be consistent with a model in which a single gene within each de novo small deletion is respon-sible for all of the ASD risk from the dnCNV. In keeping with this model there are no examples of a small de novo dele-tion in which a dnLoF is observed in more than one gene, There are, in contrast, several examples of multiple small de novo deletions in unrelated individuals targeting the same gene (e.g., NRXN1) or multiple dnLoFs targeting the same gene (e.g., SYNGAP1, ARID1B;Figure 6C).
Integrating Small De Novo Deletions with Exome Data Reveals 65 ASD Risk Genes
Because small de novo deletions and exome mutations appear to target a common set of ASD risk genes, we integrated the evidence from the small de novo deletions into the TADA model to enhance gene discovery (Supplemental Experimental Proce-dures). Applying this model to the entire SSC cohort identified eight ASD genes (Table S6) in addition to the 27 identified previ-ously at an FDR of% 0.1 (Iossifov et al., 2014). Integrating the
data from the recent ASC exome analysis (De Rubeis et al., 2014) and small de novo deletions from the AGP (Pinto et al., 2014) and a separate analysis of the SSC (Levy et al., 2011) identified 65 ASD genes (FDR% 0.1;Table 4;Table S6). Of these, 27 had not previously met this threshold in the independent datasets (21 added by the combined TADA analysis, 6 by the inclusion of small de novo deletions).
At the more conservative threshold of FDR% 0.01, we identify 28 ASD genes. Of these, 12 genes (ASH1L, KMT2C, NCKAP1,
NRXN1, PTEN, SETD5, SHANK2, SHANK3, TCF7L2, TNRC6B, TRIP12, and WAC) had not previously met this threshold in
inde-pendent genome-wide datasets (4 added by the combined TADA analysis, 8 by the inclusion of dnCNVs).
Several of the 65 ASD risk genes were previously described in the literature but had not met detection thresholds in the exome data. These include NRXN1, SHANK2 (Figure 6B), and SHANK3. While these genes have been previously considered definitive ASD risk loci (Berkel et al., 2010; Durand et al., 2007; Leblond et al., 2014; Pinto et al., 2010; Sanders et al., 2011), the current analysis allows a side-by-side comparison of the evidence in favor of association of these loci with the other genes identified in recent studies.
Many of the novel ASD risk genes were identified through the integration of the SSC and ASC datasets using the TADA meth-odology. This set of genes includes the ATPase gene Spastin (SPAST) that is associated with autosomal-dominant spastic paraplegia (Hazan et al., 1999) but was predicted to be associ-ated with ASD by virtue of its relationship to other ASD genes in gene co-expression using the DAWN framework (Liu et al., 2014). The gene DNA-methyltransferase 3 alpha (DNMT3A), a key gene in the establishment of genomic imprinting in the em-bryo (Kaneda et al., 2004), is also identified by combining the SSC and ASC data. De novo heterozygous missense mutations in this gene have recently been associated with an overgrowth syndrome characterized by tall stature, distinctive facial appear-ance, and intellectual disability (Tatton-Brown et al., 2014). Three individuals in the SSC had a non-synonymous de novo mutation in DNTM3A: a boy with a NVIQ of 71 had a de novo frameshift mutation; a boy with an NVIQ of 82 had a de novo missense mu-tation (V665L); and a girl with an NVIQ of 49 also had a de novo missense mutation (P904L). Consistent with an overgrowth syn-drome, all three individuals had heights and weights above the 95thpercentile despite normal body mass index (BMI).
Finally, several novel genes are added to the list through the combination of small de novo deletions and dnLoFs. These include the p300/CBP-associated transcriptional regulator
K(lysine) acetyltransferase 2B (KAT2B;Figure 6D) that has not previously been associated with neurodevelopmental abnormal-ities, the E3 ubiquitin ligase Thyroid hormone receptor interactor
12 (TRIP12;Figure 6E) in which a further dnLoF has been identi-fied through targeted sequencing (O’Roak et al., 2014), and
Methyl-CpG binding domain protein 5 (MBD5) that has
previ-ously been identified as the critical gene at the 2q23.1 locus through the observation of small de novo deletions and is asso-ciated with microcephaly, intellectual disability, neurodevelop-mental abnormalities, and autistic features (Hodge et al., 2014; Talkowski et al., 2012).
ASD-Associated Genes Form a Protein-Protein
Interaction Network with Two Subnetworks Enriched for Chromatin Regulating and Synaptic Genes
The integration of the small de novo deletions and exome data using the TADA metric resulted in a considerably expanded set of high confidence ASD genes. We therefore considered how this list of genes could inform our view of the etiology of ASD. Gene ontology analysis of the 65 genes with an FDR% 0.1 using DAVID (Dennis et al., 2003) showed strong enrichment for chro-matin regulation (3.2-fold over expectation; Benjamini Hochberg corrected (BHC) p = 0.0004), with eight genes contributing to this process (ARID1B, ASH1l, CHD8, DNMT3A, KMT2C, KMT2E,
KDM5B, and SUV420H1); no other distinct processes showed
significant enrichment.
We next considered whether there was evidence of protein-protein interaction (PPI) using DAPPLE (Rossin et al., 2011). A single network was derived from the 28 genes with an FDR% 0.01 (p = 0.05 for direct interactions; p = 0.02 for indirect interactions). The resulting network shows a clear distinction into two subnetworks (Figure 7A); using DAVID, one subnetwork is enriched for synaptic/neuronal genes (9.5-fold enrichment; BHC p = 13 10 14), while the other subnetwork is enriched for chromatin regulator/transcription genes (6.6-fold enrichment; BHC p = 83 10 8). Of note, the gene Branched Chain Ketoacid
Dehydrogenase Kinase (BCKDK) is drawn into the chromatin
subnetwork by virtue of its interactions with both CHD8 and
CHD2. This gene was previously associated with ASD through
the observation of homozygous variants that disrupt BCKDK
Table 4. Integrating Small De Novo Deletions in TADA Identified 65 ASD Genes
dnLoF Count FDR% 0.01 0.01 < FDR% 0.05 0.05 < FDR% 0.1
R2 ADNP, ANK2,ARID1B, ASH1L, CHD2,
CHD8, CUL3, DSCAM, DYRK1A, GRIN2B,
KATNAL2, KDM5B,KMT2C, NCKAP1,
POGZ, SCN2A, SUV420H1,SYNGAP1,
TBR1,TCF7L2, TNRC6B, WAC
BCL11A, FOXP1, GIGYF1, ILF2, KDM6B, PHF2, RANBP17, SPAST, WDFY3
DIP2A, KMT2E
1 NRXN1, PTEN, SETD5, SHANK2,
SHANK3, TRIP12
DNMT3A, GABRB3,KAT2B,
MFRP, MYT1L, P2RX5
AKAP9, APH1A, CTTNBP2, ERBB2IP,
ETFB, INTS6, IRF2BPL,MBD5, NAA15,
NINL, OR52M1, PTK7, TRIO, USP45
0 – MIB1, SLC6A1, ZNF559 ACHE, CAPN12,NLGN3
NCKAP1 SHANK3 AKAP9 ARID1B GRIN2B ADNP CHD2 CHD8 ANK2 NLGN3 NRXN1 APH1A KDM6B KMT2C BCL11A TBR1 KAT2B TCF7L2 PTEN FOXP1 CTTNBP2 CUL3 DIP2A MYT1L TRIO SHANK2 DNMT3A DYRK1A INTS6 ERBB2IP ILF2 NINL GIGYF1 GABRB3 KDM5B ETFB TRIP12 MIB1 DSCAM ASH1L SPAST SUV420H1 SYNGAP1 USP45 NCKAP1 SHANK3 ARID1B GRIN2B ADNP CHD2 CHD8 ANK2 KMT2C TBR1 PTEN TCF7L2 CUL3 SHANK2 DSCAM NRXN1 TRIP12 SUV420H1 SYNGAP1 DYRK1A Chromatin organization Transcription (Pol II) Zinc finger SWI/SNF complex Bromodomain SMAD domain Synapse p = 6x10-18 Neuron projection p = 3x10-16 Long-term potentiation p = 2x10-14 Src homology domain (SH3) p = 6x10-13 Postsynaptic density p = 2x10-12 Cytoskeleton p = 2x10-11 Src homology domain (SH3) Synapse Postsynaptic density Cell morphogenesis Neuron projection development Adherens junction Transcription Zinc finger Chromatin regulation p = 1x10-14 p = 2x10-18 p = 3x10⁻⁷ p = 6x10⁻⁷ p = 1x10⁻⁶ p = 3x10⁻⁵ p = 4x10-15 p = 1x10-14 p = 5x10⁻¹⁰ p = 1x10⁻⁵ p = 5x10⁻⁵ p = 3x10⁻⁵ p = 8x10⁻⁸ p = 2x10⁻⁵ p = 8x10⁻⁴ A B 65 ASD genes, FDR ≤0.1 28 ASD genes, FDR ≤0.01
Mutations observed in: Both sexes Females only Males only Mutations observed in:
Both sexes Females only Males only
function in three consanguineous families (Novarino et al., 2012) resulting in markedly reduced plasma levels of branched chain amino acids. This result may indicate a functional relationship between ASD-associated chromatin regulators and a metabolic cause of ASD.
Repeating the DAPPLE analysis with all 65 genes (FDR% 0.1) resulted in one large network (p = 0.02 for indirect interactions). The distinct divide between synaptic/neuronal and chromatin regulator/transcription subnetworks also persists (10.5-fold enrichment, BHC p = 6 3 10 18 and 14.5-fold enrichment, BHC p = 13 10 14, respectively;Figure 7B).
Mutations in Male and Female Cases Target a Common Set of Genes
One possible explanation for the increased male prevalence in ASD would be a set of genes in which mutations contribute ASD risk in males only. Our data do not support this hypothesis. In the 65 ASD genes (FDR% 0.1), there were 109 dnLoF muta-tions or small de novo delemuta-tions in male probands compared to 33 in female probands. If the mutations targeted a common set of genes, irrespective of sex, we would expect 19 genes to include mutations from both sexes. The presence of male-spe-cific risk genes would result in fewer than 19 genes. In contrast, we observed 20 genes with a mutation from both sexes (p = 0.97; permutation analysis). This result was not altered by restricting to genes in the chromatin PPI subnetwork (9 expected, 10 observed; p = 0.73) or in the synaptic PPI subnetwork (6 ex-pected, 7 observed; p = 0.76;Figure 7B).
DISCUSSION
Analysis of CNVs detected in 2,591 families from the SSC high-lights the key role of de novo mutations in the etiology of ASD. We replicate prior findings that dnCNVs are associated with ASD through the observation of an increased burden in pro-bands compared to unaffected sibling controls. Using the sibling distribution of dnCNVs to establish rigorous statistical thresh-olds, we previously identified two loci at genome-wide signifi-cance (deletions and duplications at 16p11.2 and duplications at 7q11.23) and, as predicted (Sanders et al., 2011), identified two further loci: 1q21.1 duplications and 15q11.2-13.1 duplica-tions (Table 1). Including additional dnCNV data (Levy et al., 2011; Pinto et al., 2014) identifies an additional two loci: deletions at NRXN1 and deletions and duplications at 22q11.2. Relaxing the threshold to an FDR% 0.1 identifies two more: 3q29 dele-tions and SHANK3 deledele-tions, leading to a total of eight ASD risk loci from dnCNVs (Table 2); however, two of these loci involve only a single gene (NRXN1 and SHANK3) and conse-quently were included in the list of ASD risk genes, leading to a total of 6 loci and 65 genes.
The majority of these CNV loci are also associated with devel-opmental delay (Coe et al., 2014) and, to a lesser extent, schizo-phrenia. The overlap with schizophrenia loci appears to be more selective; for example, 16p11.2 duplications are associated with schizophrenia, while 16p11.2 deletions are not (Szatkiewicz et al., 2014). These observations are consistent with a model in which CNVs contribute risk to a number of neuropsychiatric dis-orders (Moreno-De-Luca et al., 2013a; Stefansson et al., 2014); however, the extent of this risk varies between phenotypes for each locus (Moreno-De-Luca et al., 2014).
Our prior exome analysis demonstrated that the observation of even a small number of dnLoF mutations in the same gene among unrelated individuals could provide considerable statisti-cal power to establish association (Sanders et al., 2012). The TADA test has extended this approach further and provides a framework to incorporate case-control data, transmitted vari-ants, and missense mutations alongside dnLoF, resulting in a single metric of genome-wide association (He et al., 2013). Applying this model to 3,871 ASD cases and 9,937 controls in the ASC yielded 33 ASD risk genes (FDR% 0.1) (De Rubeis et al., 2014). Here we present the latest iteration of this approach that incorporates structural variation. We use the TADA model to integrate data from small de novo deletions in 4,687 ASD cases and 2,100 matched sibling controls from the SSC and AGP (Pinto et al., 2014) alongside exome data of 5,563 ASD cases and 13,321 controls in the combination of the SSC (Iossifov et al., 2014) and ASC (De Rubeis et al., 2014) datasets. This compre-hensive analysis identifies 65 ASD genes (FDR% 0.1), including 28 at the more stringent threshold of FDR% 0.01 (Table 4). The TADA framework provides a common standard of association that enables researchers to choose an association threshold tailored to their needs (Table S6).
These 65 ASD risk genes show enrichment for protein-protein interactions (PPIs) and coalesce into a PPI network with two distinct sub-networks corresponding to genes involved in chro-matin regulation and the synapse (Figure 7), consistent with pre-vious analyses (Chang et al., 2015; Li et al., 2014; Parikshak et al., 2013; Pinto et al., 2014). One explanation for how these two sets of genes both contribute to the ASD phenotype is that the genes involved in chromatin regulation may regulate the expression of the synaptic genes, a hypothesis supported by recent analyses of the regulatory targets of CHD8, an ASD gene and chromatin regulator, though these data do not estab-lish clear directionality in this relationship (Cotney et al., 2015; Sugathan et al., 2014).
Our data also lend support to the female protective effect (FPE) hypothesis as a mechanism for the increased male preva-lence in ASD through the observation of an increased burden of de novo mutations in female probands than male probands ( Fig-ures 2E and 2F). Further support of the FPE hypothesis comes
Figure 7. Protein-Protein Interaction Networks in ASD
(A) 28 ASD genes identified with a TADA FDR% 0.01 were submitted as seeds to form a DAPPLE PPI network (Rossin et al., 2011). The seed genes are shown as circles in red and/or blue based on the sex of the ASD cases in whom the mutations were identified; the distribution of male and female mutations in the network does not differ from expectation (p = 0.97). Protein-protein interactions are shown as gray lines (edges) and additional genes are pulled into the network to form indirect connections. The network has a clear distinction into two halves (shown by the large ovals). All seed and network genes in each oval were submitted to DAVID (Dennis et al., 2003) and the top gene ontology terms are shown with Benjamini Hochberg corrected p values.