GROWTH STAGNATES IN THE LAST QUARTER
Zümrüt İmamoğlu* and Barış Soybilgen†Executive Summary
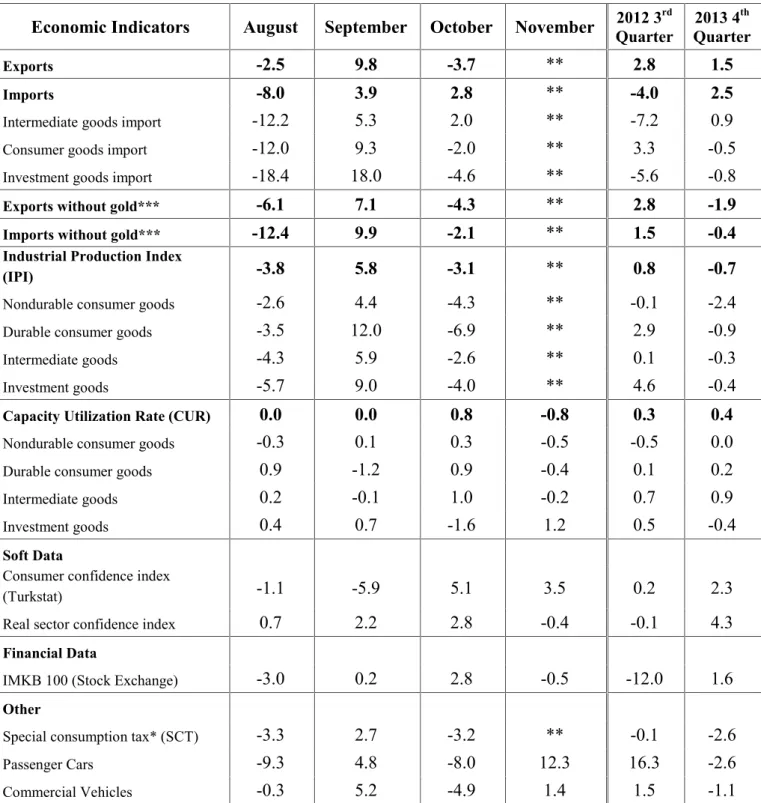
In October, the Industrial Production Index (IPI) decreased by 3.1 percent from September. Export volume index declined by 3.7 percent, whereas the import volume index increased by 2.8 percent. In October, IPI fell mainly due to the holiday effect and we expect it to recover in November. Betam's first forecast for the last quarter indicates a stagnation in real GDP growth. We predict that the mild increase in private consumption will continue and private investment will stagnate. Moreover, net exports might contribute negatively once again due to the increase in imports.
Betam’s quarter on quarter forecast for the last quarter is 0.1 percent. The corresponding year on year (YoY) growth rate forecast is 4.5 percent. Our annual growth forecast for 2013 is 4.1 percent.
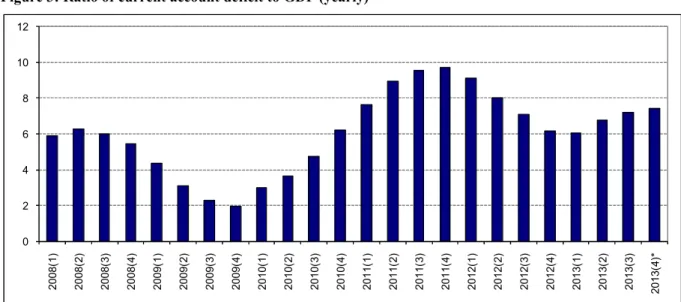
In October, the current account deficit (CAD) was $2.9 billion, and 12-month total CAD increased to $60.9 billion. Betam expects the current account deficit to GDP ratio, which was 7.2 percent at the end of third quarter, to increase to 7.4 percent at the end of the year.
* Dr. Zümrüt İmamoğlu, Betam, Research Associate. [email protected]
†Barış Soybilgen, Betam, Research Assistant, [email protected]
Table 1: Betam’s quarterly and annual growth rate forecasts
Source: Betam. *sa: seasonally and calendar day adjusted **ca: calendar day adjusted.
Third quarter growth was strong Third quarter growth which was announced as 4.4 percent on 10th of December was below Betam's
forecast of 5.1 percent and above market expectation of 4.1 percent. The difference between our forecast and the realized GDP growth rate was caused by the unexpected fall in government expenditures. Government expenditures decreased by 6.6 percent, and subtracted 1.0 percentage point from the real GDP growth in the third quarter. Contributions of net exports and private consumption was positive as we expected. The
2013 4thQuarter
Forecast Real GDP growth, %
(quarter on quarter, sa*) 0.1
Real GDP growth, %
(year on year, ca**) 4.5
Current account deficit
(% of GDP, annual) 7.4
2013 Annual Forecast Real GDP growth, real (annual) 4.1
Economic Outlook and Forecasts:
December 2013
mild increase in private investment continued. In line with our prediction, the current account deficit to GDP ratio realized as 7.2 percent.
October data sent out conflicting signals about last quarter growth. Even though the IPI decreased in October, we think that the fall is caused by the bridge day effect during the holidays as in August, and expect the IPI to recover in November.1 The
decrease in exports affects the economic outlook negatively but the increase in imports was mostly caused by the increase in intermediate goods imports, implying future increases in the IPI. Increases in Capacity Utilization Rate (CUR) and real sector confidence index in October are encouraging.
The quarter on quarter growth in the third quarter declined to 0.9 percent from 2.0 percent in the second quarter. We predict that the growth rate may further decline in the last quarter. However, annual growth might remain over the medium term program's target of 3.6 percent and even exceed 4 percent as long as the quarterly rate remains positive.
Betam’s first quarter on quarter forecast for the last quarter of 2013 is 0.1 percent. The corresponding year on year (YoY) growth rate forecast is 4.5 percent. Our annual growth forecast for 2013 is 4.1 percent. Betam expects the current account deficit to GDP ratio to increase to 7.4 percent at the end of the year.
1 See. The Central Bank inflation report October 2013,
box 4.1, page 59, " Impact of Bridge Days on the Industrial Production Index".
Data is noisy in October
Consumption indicators in October are mostly negative. Consumer goods imports decreased by 2.0 percent in October from the previous month. In the same period, durable and non-durable goods declined by 6.9 percent and 4,3 percent respectively. Therefore, special consumer tax income fell by 3.2 percent. The only good news this month was the increase in the consumer confidence index. Following the 5.1 percent increase in October, consumer confidence index increased again, by 3.5 percent, in November. As Erdem Başçı pointed out seasonally adjusted data2
in October is "noisy" because of the bridge day effect in the holiday. Therefore, we need the data for November to have a better picture of the last quarter.
IPI declined due to holiday effect
Investment indicators also include "noise" due to impact of bridge days. Therefore, they are mostly negative. In October, intermediate goods imports increased by 2.0 percent from the previous month, whereas investment goods imports declined by 4.6 percent. In the same period, the IPI, passenger cars and commercial cars production decreased by 3.1 percent, 8.0 percent and 4.9 percent, respectively. Following increases in October, the capacity utilization rate and the real sector confidence index declined by 0.8 percentage points and 0.4 percent, respectively, in November.
2Erdem Başçı mentioned this issue for IPI, but other
seasonally adjusted data that doesn't take into account of bridge days also suffers from the same problem.
Exports declined in October
Figure 2 shows monthly changes of seasonally adjusted import and export volume indices. In October from the previous month, export volume index decreased by 3.7 percent, whereas import volume index increased 2.8 percent. In the same period, gold excluded exports and imports declined by 4.3 percent and 2.1 percent, respectively.
Gold excluded current account deficit steady In October, the current account deficit increased by $1.7 billion compared to the same month of the previous year and reached $2.9 billion. On the other hand, gold excluded current account remained at $2.2 billion.
At the end of third quarter, 12-month current account was $59.1 billion and the current account deficit to GDP ratio reached 7.2 percent. However, the gold excluded current account deficit to GDP ratio was 6.3 percent. We expect a limited increase in the fourth quarter. At the end of the year, we expect the current account deficit to GDP ratio to reach 7.4 percent.
Economic growth in 2014
It seems that annual growth for 2013 will be around 4 percent. This mild growth did not cause a significant increase in the current account, in fact the gold excluded current account deficit
decreased.3In 2013, global conditions did not give
much support to the Turkish economy. Mild revival in Germany and England at the end of year did not make significant contribution to Turkey's exports. Furthermore, the uncertainty caused by the FED in the second half of the year caused interest rates to increase and investment climate to worsen.
If global conditions do not change in 2014, a mild and balanced growth of 4 percent might be achieved. However, newly arisen uncertainties and volatility in financial markets adversely affect domestic demand. On the other hand, ongoing improvement in the US economy and recovery in Europe could support the exporting sector.
Labor market rigidities and high labor costs are restrictive factors for economic growth in Turkey. Reforms to change these have been on the agenda of the government for quite a while now, however, the upcoming elections and the newly arisen political risks cloud the reform perspective. Economic reforms will probably be left beyond 2015. Hence, 2014 growth will depend on weak domestic demand and weak recovery in export markets.
3 İmamoglu and Soybilgen, 2013. "Gold-Excluded
Current Account Deficit is Declining", Betam Research Note 13/156.
Table 2: Monthly and quarterly changes of Betam’s selected indicators (real and sa)
Economic Indicators
August
September October November
Quarter2012 3rd Quarter2013 4thExports
-2.5
9.8
-3.7
**
2.8
1.5
Imports
-8.0
3.9
2.8
**
-4.0
2.5
Intermediate goods import
-12.2
5.3
2.0
**
-7.2
0.9
Consumer goods import
-12.0
9.3
-2.0
**
3.3
-0.5
Investment goods import
-18.4
18.0
-4.6
**
-5.6
-0.8
Exports without gold***
-6.1
7.1
-4.3
**
2.8
-1.9
Imports without gold***
-12.4
9.9
-2.1
**
1.5
-0.4
Industrial Production Index
(IPI)
-3.8
5.8
-3.1
**
0.8
-0.7
Nondurable consumer goods
-2.6
4.4
-4.3
**
-0.1
-2.4
Durable consumer goods
-3.5
12.0
-6.9
**
2.9
-0.9
Intermediate goods
-4.3
5.9
-2.6
**
0.1
-0.3
Investment goods
-5.7
9.0
-4.0
**
4.6
-0.4
Capacity Utilization Rate (CUR)
0.0
0.0
0.8
-0.8
0.3
0.4
Nondurable consumer goods
-0.3
0.1
0.3
-0.5
-0.5
0.0
Durable consumer goods
0.9
-1.2
0.9
-0.4
0.1
0.2
Intermediate goods
0.2
-0.1
1.0
-0.2
0.7
0.9
Investment goods
0.4
0.7
-1.6
1.2
0.5
-0.4
Soft Data
Consumer confidence index
(Turkstat)
-1.1
-5.9
5.1
3.5
0.2
2.3
Real sector confidence index
0.7
2.2
2.8
-0.4
-0.1
4.3
Financial Data
IMKB 100 (Stock Exchange)
-3.0
0.2
2.8
-0.5
-12.0
1.6
Other
Special consumption tax* (SCT)
-3.3
2.7
-3.2
**
-0.1
-2.6
Passenger Cars
-9.3
4.8
-8.0
12.3
16.3
-2.6
Commercial Vehicles
-0.3
5.2
-4.9
1.4
1.5
-1.1
Source: TurkStat.CBRT.Treasury.ISE.Betam. All series are real (or inflation adjusted) wherever necessary and seasonally adjusted. *This tax is collected on sales of goods such as gas. fuel oils. alcohol. tobacco products and automobiles.
**Data not yet released.
Figure 1: Capacity utilization rate and industrial production index (sa. left axis for CUR and right axis for IPI)
Source: TurkStat. Betam.
Figure 2: Volume indices of exports and imports (sa)
Source: Turkstat. Betam.
Figure 3: Ratio of current account deficit to GDP (yearly)
Source: CBRT. TurkStat. Betam.
75 80 85 90 95 100 105 110 115 120 55 60 65 70 75 80 85 Ja n-07 M ay -0 7 Se p-07 Ja n-08 M ay -0 8 Se p-08 Ja n-09 M ay -0 9 Se p-09 Ja n-10 M ay -1 0 Se p-10 Ja n-11 M ay -1 1 Se p-11 Ja n-12 M ay -1 2 Se p-12 Ja n-13 M ay -1 3 Se p-13 CUR IPI 70 80 90 100 110 120 130 140 Ja n-07 M ay -0 7 Se p-07 Ja n-08 M ay -0 8 Se p-08 Ja n-09 M ay -0 9 Se p-09 Ja n-10 M ay -1 0 Se p-10 Ja n-11 M ay -1 1 Se p-11 Ja n-12 M ay -1 2 Se p-12 Ja n-13 M ay -1 3 Se p-13 Export Import 0 2 4 6 8 10 12 20 08 (1 ) 20 08 (2 ) 20 08 (3 ) 20 08 (4 ) 20 09 (1 ) 20 09 (2 ) 20 09 (3 ) 20 09 (4 ) 20 10 (1 ) 20 10 (2 ) 20 10 (3 ) 20 10 (4 ) 20 11 (1 ) 20 11 (2 ) 20 11 (3 ) 20 11 (4 ) 20 12 (1 ) 20 12 (2 ) 20 12 (3 ) 20 12 (4 ) 20 13 (1 ) 20 13 (2 ) 20 13 (3 ) 20 13 (4 )*
Figure 4: Weighted Average Interest Rates for Turkish Lira Banks' Loans (%)
Source: CBRT.
Figure 5: YoY increase in IPI in 2012 and 2013 (calendar day adjusted)
. Source: Turkstat. 5 7 9 11 13 15 17 19 21 Ja n-10 M ar -1 0 M ay -1 0 Ju l-1 0 Se p-10 No v-10 Ja n-11 M ar -1 1 M ay -1 1 Ju l-1 1 Se p-11 No v-11 Ja n-12 M ar -1 2 M ay -1 2 Ju l-1 2 Se p-12 No v-12 Ja n-13 M ar -1 3 M ay -1 3 Ju l-1 3 Se p-13 No v-13 Cash Vehicle Housing Commercial -3 -2 -1 0 1 2 3 4 5 6 7 Jan ua ry Fe br ua ry M arc h Ap ril May June July Augu st Se pte m be r O cto be r No ve m be r De ce m be r 2012 2013