121
Background and Purpose—Blend, black hole, island signs, and hypodensities are reported to predict hematoma expansion in acute intracerebral hemorrhage. We explored the value of these noncontrast computed tomography signs in predicting hematoma expansion and functional outcome in our cohort of intracerebral hemorrhage.
Methods—The TICH-2 (Tranexamic acid for IntraCerebral Hemorrhage-2) was a prospective randomized controlled trial exploring the efficacy and safety of tranexamic acid in acute intracerebral hemorrhage. Baseline and 24-hour computed tomography scans of trial participants were analyzed. Hematoma expansion was defined as an increase in hematoma volume of >33% or >6 mL on 24-hour computed tomography. Poor functional outcome was defined as modified Rankin Scale of 4 to 6 at day 90. Multivariable logistic regression was performed to identify predictors of hematoma expansion and poor functional outcome.
Results—Of 2325 patients recruited, 2077 (89.3%) had valid baseline and 24-hour scans. Five hundred seventy patients (27.4%) had hematoma expansion while 1259 patients (54.6%) had poor functional outcome. The prevalence of noncontrast computed tomography signs was blend sign, 366 (16.1%); black hole sign, 414 (18.2%); island sign, 200 (8.8%); and hypodensities, 701 (30.2%). Blend sign (adjusted odds ratio [aOR] 1.53 [95% CI, 1.16–2.03];
P=0.003), black hole (aOR, 2.03 [1.34–3.08]; P=0.001), and hypodensities (aOR, 2.06 [1.48–2.89]; P<0.001) were independent predictors of hematoma expansion on multivariable analysis with adjustment for covariates. Black hole sign (aOR, 1.52 [1.10–2.11]; P=0.012), hypodensities (aOR, 1.37 [1.05–1.78]; P=0.019), and island sign (aOR, 2.59 [1.21–5.55]; P=0.014) were significant predictors of poor functional outcome. Tranexamic acid reduced the risk of hematoma expansion (aOR, 0.77 [0.63–0.94]; P=0.010), but there was no significant interaction between the presence of noncontrast computed tomography signs and benefit of tranexamic acid on hematoma expansion and functional outcome (P interaction all >0.05).
Conclusions—Blend sign, black hole sign, and hypodensities predict hematoma expansion while black hole sign, hypodensities, and island signs predict poor functional outcome. Noncontrast computed tomography signs did not predict a better response to tranexamic acid.
Clinical Trial Registration—URL: https://www.isrctn.com. Unique identifier: ISRCTN93732214. (Stroke. 2020;51:121-128. DOI: 10.1161/STROKEAHA.119.026128.)
Key Words: cerebral hemorrhage ◼ hematoma ◼ odds ratio ◼ prevalence ◼ probability ◼ tranexamic acid
Received July 12, 2019; final revision received August 28, 2019; accepted September 20, 2019.
From the Stroke Trials Unit, Division of Clinical Neuroscience (Z.K.L., A.A., A.B., J.P.A., P.S., L.W., S.P., T.J.E., N.S., P.M.B), Radiological Sciences (S.P., R.A.D.), NIHR Nottingham Biomedical Research Centre (RD) and Vascular Medicine, Division of Medical Sciences and GEM (T.J.E.), University of Nottingham, United Kingdom; Department of Medicine, National University of Malaysia, Kuala Lumpur, Malaysia (Z.K.L); Department of Stroke, Nottingham University Hospitals NHS Trust, United Kingdom (K.K., N.S., P.M.B); School of Medicine, University of Western Australia, Perth, Australia (L.A.C.); Department of Neurology, Selcuk University Medical Faculty, Konya, Turkey (S.O.); Institute for Applied Clinical Studies, Keele University, Staffordshire, Stoke-on-Trent, United Kingdom (C.R.); Department of Neurology, Semmelweis University, Budapest, Hungary (D.B.); Neurology Unit, Azienda Socio Sanitaria Territoriale di Mantova, Mantua, Italy (A.C.); Department of Neurology, Bispebjerg and Frederiksberg Hospital, University of Copenhagen (C.O., H.C.); and Copenhagen Trial Unit, Centre for Clinical Intervention Research, Rigshospitalet, Copenhagen University Hospital, Denmark (C.O.).
The online-only Data Supplement is available with this article at https://www.ahajournals.org/doi/suppl/10.1161/STROKEAHA.119.026128. Correspondence to Nikola Sprigg, DM, Stroke Trials Unit, Division of Clinical Neuroscience, University of Nottingham, NG5 1PB Nottingham, United Kingdom. Email [email protected]
© 2019 The Authors. Stroke is published on behalf of the American Heart Association, Inc., by Wolters Kluwer Health, Inc. This is an open access article under the terms of the Creative Commons Attribution License, which permits use, distribution, and reproduction in any medium, provided that the original work is properly cited.
Hematoma Expansion, Clinical Outcome, and Response to
Tranexamic Acid in Acute Intracerebral Hemorrhage
Zhe Kang Law, MRCP; Azlinawati Ali, MSc; Kailash Krishnan, PhD; Adam Bischoff, BMedSci;
Jason P. Appleton, PhD; Polly Scutt, MSc; Lisa Woodhouse, MSc; Stefan Pszczolkowski, PhD;
Lesley A. Cala, FRCR; Robert A. Dineen, FRCR; Timothy J. England, PhD; Serefnur Ozturk, MD;
Christine Roffe, MD; Daniel Bereczki, MD; Alfonso Ciccone, MD;
Hanne Christensen, DMSci; Christian Ovesen, MD; Philip M. Bath, FMedSci; Nikola Sprigg, DM;
on behalf of TICH-2 Investigators
DOI: 10.1161/STROKEAHA.119.026128 Stroke is available at https://www.ahajournals.org/journal/str
122 Stroke January 2020
H
ematoma expansion complicates up to 38% of patients with acute intracerebral hemorrhage (ICH) within the first few hours of onset and leads to higher mortality and mor-bidity.1 However, given that the majority of patients with ICHdo not have hematoma expansion, identifying patients at risk of hematoma expansion may be important in clinical trials testing hemostatic therapies to selectively target patients who are most likely to benefit.
Shorter onset-to-computed tomography (CT) time, larger baseline hematoma volume, prior antiplatelet and anticoagu-lant therapy were identified as independent predictors of he-matoma expansion with C-index of 0.78 (95% CI, 0.75–0.82) in a large patient level meta-analysis of data from cohort stud-ies and randomized trials.2 The predicted probability of
he-matoma expansion increased with larger bleeds and peaked at ≈75 mL before declining while the probability of hematoma expansion was the highest in patients with onset-to-CT time of <3 hours.2 CT angiography (CTA) spot sign was reported to
have a sensitivity of ≈60% and specificity of 90% in predict-ing hematoma expansion but the addition of spot sign only increased the C-index by 0.05.2,3 Furthermore, CTA is not
routinely performed in patients with ICH. In the TICH-2 trial (Tranexamic acid for IntraCerebral Hemorrhage-2), only 10% of patients had a baseline CTA.4
Several noncontrast CT (NCCT) signs of heterogeneous density and irregular shape have been identified as predic-tors of hematoma expansion in ICH. The blend sign, black hole sign, swirl sign, fluid level, and hypodensities are signs of heterogeneous density; another, the island sign, reflects ir-regular shape.5–10 Heterogeneous density represents areas of
hyperdense mature blood and hypodense fresh blood indicat-ing ongoindicat-ing bleedindicat-ing,10 while island sign may represent
mul-tifocal bleeding points.7 The universal availability of NCCT
in patients with ICH and the reportedly excellent interrater reliability amongst trained assessors (κ, 0.806–0.957) makes these signs an attractive alternative to CTA spot sign.5–8 These
signs have a sensitivity of 31.9% to 44.7% and specificity of 94.7% to 98.2% for prediction of hematoma expansion.5–8
However, many source studies were small single-center stud-ies.5–8 One exception was the Antihypertensive Treatment of
Acute Cerebral Hemorrhage II, which found NCCT signs to be useful predictors of hematoma expansion.11 Several
meta-analyses have found substantial heterogeneity between the studies.12,13 Therefore, further studies are needed to evaluate
the value of NCCT signs.
In the TICH-2 trial, there was no significant difference in shift of functional outcome between the tranexamic acid and placebo group despite a significant reduction in risk of hema-toma expansion in the tranexamic acid group.4 In the current
analysis, we explore the role of some of the NCCT signs as predictors of hematoma expansion and poor functional out-come, and if a subgroup of patients with 1 or more of these signs benefited from tranexamic acid.
Methods
The TICH-2 trial was a prospective randomized placebo controlled trial testing the efficacy and safety of intravenous tranexamic acid in patients with acute spontaneous ICH presenting within 8 hours of symptom onset. Details of the trial were previously published.4,14
Ethics approval was obtained from the local institutional review board. Written informed consent was obtained from patients or rela-tives before enrolment. After publication of the planned primary and secondary analyses, the trial data can be shared on reasonable request to the corresponding author and trial steering committee.
Image Acquisition
An NCCT was required for the diagnosis of spontaneous ICH before recruitment and randomization. All CT brain scans were performed as per local protocol. CT scans obtained from any scanner of any man-ufacturer; any slice thickness with a minimum of an axial view was accepted. CT scans with incomplete or missing slices were excluded. Baseline scans were performed before randomization. Follow-up CT scans were performed at 24±12 hours after the baseline scans.14
When multiple scans were available, the scan closest to 24 hours after randomization was used to determine hematoma expansion. The exception was if the 24-hour CT was performed after neurosurgery, when a preoperative CT scan was used instead. A participant would be excluded from analysis for hematoma expansion if no follow-up scans or only postsurgery scans were available.
Image Analysis
Three independent raters blinded to clinical data (Z.K. Law, neu-rologist; A. Ali, CT radiographer; K. Krishnan, stroke physician) performed volumetric measurements using the ITK-SNAP soft-ware version 3.6.0.15 Intraparenchymal and intraventricular
hema-toma volumes were computed independently using an active contour semiautomated segmentation algorithm,15 followed by manual
ed-iting if necessary.
Evaluation of intra- and interrater reliability of hematoma volume measurement was performed. Each rater performed 2 measurements on the same CT scan at least 1 day apart. In addition, to assess intra-class correlation, measurements were performed on 50 CT scans by all raters blinded to each other’s measurements.
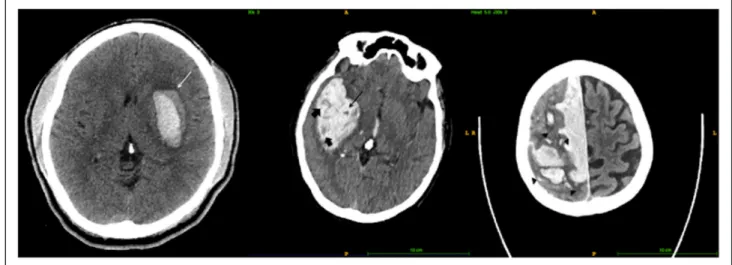
Blend sign is defined as an area of hypodensity adjacent to the hyperdense area of hematoma. The margin should be well-defined with a difference of at least 18 Hounsfield units between the 2 areas (Figure 1).5 Black hole sign is an area of hypodensity that is
completely encapsulated by an adjacent hyperdense area within a hematoma. The difference between the 2 areas should be at least 28 Hounsfield units.6 Black hole sign is a subset of hypodensities,
which can be of any Hounsfield unit and have distinct or indistinct border, as long as it is completed encapsulated by hyperdense area.8
The island sign is characterized by presence of ≥3 separate small hematomas adjacent to the main hematoma or ≥4 small bubble- or sprout-like hematomas that are partially connected to the main he-matoma.7 The signs were assessed by 4 independent raters (Z.K.
Law, A. Ali, K. Krishnan, and A. Bischoff, medical student). All rat-ers were trained and interrater reliability assessed using 70 scans, with raters blinded to each other’s ratings of signs.
Outcomes and Statistical Analysis
For this analysis, the outcomes were based on the TICH-2 CTA statis-tical analysis plan16 as below.
Radiological Outcomes
Hematoma expansion is defined as increase in intraparenchymal he-matoma volume on follow-up scan of >33% or > 6 mL from baseline hematoma. Total ICH expansion, defined as expansion of combined intraparenchymal and intraventricular hematoma volume of >33% or > 6 mL were analyzed as an outcome as well, as hematoma may have extended into intraventricular hemorrhage with a preserved intrapa-renchymal hematoma volume.
In addition, we explored a composite outcome of hematoma progression, which was defined as intraparenchymal hematoma ex-pansion or delayed intraventricular or subarachnoid extension or an absolute intraventricular hematoma expansion of ≥2 mL. When fol-low-up scans were not available, early neurological deterioration (≥4 points increase in National Institutes of Health Stroke Scale or drop
in Glasgow Coma Scale score of ≥ 2) or death before day-2 clinical assessment was considered hematoma progression. The rationale of including neurological deterioration or death is to avoid excluding patients who were unfit to have a follow-up scan.
Clinical Outcome
Unfavourable functional outcome, defined as a dichotomized modi-fied Rankin Scale of 4 to 6, was the clinical outcome of interest.
Statistical Analysis
The sensitivity, specificity, positive and negative predictive values of each NCCT sign were analyzed individually. Fleiss kappa was used to measure interrater reliability as there were >2 independent raters. Descriptive analyses used Student t test, Mann-Whitney U test, and χ2 tests as appropriate. Multivariable logistic regression analyses were
used to identify predictors of hematoma expansion and unfavourable functional outcome. The multivariable model included minimization factors as a priori variables and variables that were significant confound-ers on univariate analysis (resulting in change of odds ratio ≥0.1 when included). We also performed sensitivity analyses using hematoma pro-gression and total ICH expansion as outcomes. Ordinal logistic regres-sion was performed as a sensitivity analysis to explore if presence of NCCT signs leads to a shift in modified Rankin Scale. To explore the diagnostic yield of NCCT signs in addition to known predictors, we per-formed receiver operating characteristics analysis for known predictors of hematoma expansion (prior antiplatelet, baseline hematoma volume, and onset-to-CT time) and known predictors plus NCCT signs.
In addition, to explore the effect of tranexamic acid in patients with NCCT signs, a logistic regression model was constructed strat-ified by status of NCCT signs. Ninety-five percent CIs are given and
P of <0.05 were considered statistically significant. All analyses were performed using SPSS version 24 (IBM, Armonk, NY).
Results
Two thousand three hundred twenty-five participants were recruited into the trial from 124 centers in 12 countries. Baseline scans were available in 2273 patients (97.8%). Of these, 2077 (89.3%) participants also had follow-up CT scans and were included in the analysis of hematoma expansion (Figure I in the online-only Data Supplement). In addition, 236 participants without follow-up scans had available neu-rological deterioration or death status at 48 hours, and 2313 patients (99.5%) were included in analysis of hematoma pro-gression. Day 90 modified Rankin Scale was available in 2307 patients (99.2%).
Five hundred seventy participants (27.4%) had hematoma expansion while 1259 patients (54.6%) had poor functional outcome. Participants with hematoma expansion had higher National Institutes of Health Stroke Scale, lower Glasgow Coma Scale, larger baseline hematoma volumes, more lobar location, more likely to have had antiplatelet therapy before ICH, a shorter onset-to-CT time, and less intraventricular hemorrhage (Table 1). Participants with hematoma expansion were more likely to have blend sign, black hole sign, island sign, and hypodensities on baseline imaging (Table 1).
The intraclass correlation for intraparenchymal hematoma volume was 0.94 (95% CI, 0.86–0.97). Intrarater Cohen κ for blend sign was 0.93 (95% CI, 0.79–1.00); black hole was 0.73 (95% CI, 0.45–1.00); island sign 0.85 (95% CI, 0.57–1.00); and hypodensities 0.66 (95% CI, 0.43–0.90). The interrater Fleiss κ for blend signs was 0.60 (95% CI, 0.47–0.74); black hole sign 0.53 (95% CI, 0.41–0.64); island sign 0.64 (95% CI, 0.53–0.75); and hypodensities 0.63 (95% CI, 0.39–0.86).
The prevalence of NCCT signs was: blend sign, 366 (16.1%); black hole sign, 414 (18.2%); island sign, 200 (8.8%); and hypodensities, 701 (30.2%). NCCT signs had low sensitivity (11.4%–39.5%) and high specificity (76%–93%) for hematoma expansion with island sign having the highest specificity but lowest sensitivity (Table I in the online-only Data Supplement). Similarly, NCCT signs had low sensi-tivity (14%–39%) and high specificity (79.5%–97.6%) for poor functional outcome (Table I in the online-only Data Supplement). Baseline hematoma volumes were significantly larger in all NCCT signs; patients with black hole sign and hypodensities had shorter onset-to-CT time while a larger pro-portion of patients with island signs were taking antiplatelet therapy (Table II in the online-only Data Supplement).
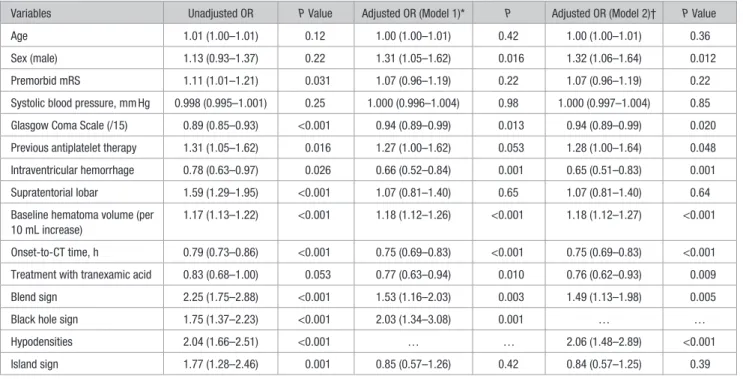
Univariate logistic regression showed that higher pre-morbid modified Rankin Scale, prior antiplatelet therapy, lower Glasgow Coma Scale, lobar location, larger baseline hema-toma volume, shorter onset-to-CT time as well as the presence of blend sign, black hole sign, island sign, and hypodensities increased the odds of hematoma expansion (Table 2). As there was significant overlap between black hole sign and hypoden-sities, 2 different multivariable logistic regression models
Figure 1. Shows the blend sign (left, white arrow), black hole sign (middle, black arrow), hypodensities (thick arrows), and island sign (right, black arrow heads showing multiple small islands).
124 Stroke January 2020
were constructed to predict hematoma expansion with model 1 including black hole sign and model 2 including hypodensi-ties (Table 2). Baseline hematoma volume, onset-to-CT time, and prior antiplatelet therapy were significant predictors of hematoma expansion. Of the NCCT signs, blend sign, black hole, and hypodensities were significant independent predic-tors of hematoma expansion (Table 2). The island sign was no longer a significant predictor after adjusting for baseline hematoma volume. A combination of 1 or more NCCT signs did not improve the predictive probability of hematoma ex-pansion (adjusted odds ratio [aOR], 1.57 [95% CI, 1.24–1.98]; P<0.001; not shown in table).
In the receiver operating characteristic analysis for he-matoma expansion, the area under the curve for 3 predictors (hematoma volume, onset-to-CT time, and prior antiplatelet agent) was 0.654. Addition of blend and black hole signs, and
blend sign and hypodensities improved the area under the curve minimally to 0.664 and 0.667, respectively.
As sensitivity analysis, we analyzed hematoma progression and total ICH volume expansion as outcomes. Multivariable logistic regression adjusting for variables used in the analysis for hematoma expansion showed that blend sign, black hole sign, and hypodensities were significant predictors of hema-toma progression and total ICH expansion (Table III in the
online-only Data Supplement).
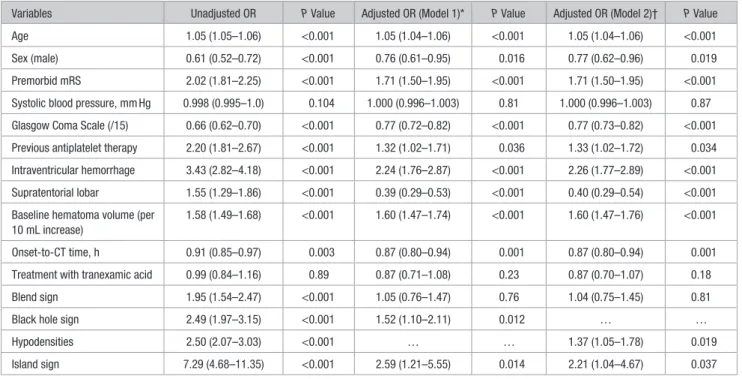
Black hole sign, hypodensities, and island sign were sig-nificant predictors of poor functional outcome after adjust-ment of prognostic covariates (Table 3). A combination of 1 or more NCCT signs did not improve the predictive probability of poor functional outcome (aOR, 1.30 [1.01–1.66]; P=0.039; not shown in table). In the ordinal regression model, only the pres-ence of black hole sign (aOR, 1.25 [1.01–1.56]; P=0.045) and
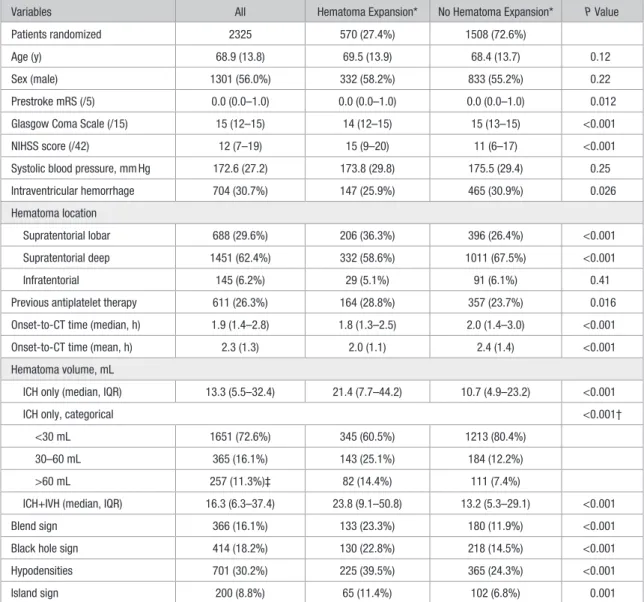
Table 1. Baseline Characteristics in Patients With and Without Hematoma Expansion
Variables All Hematoma Expansion* No Hematoma Expansion* P Value
Patients randomized 2325 570 (27.4%) 1508 (72.6%)
Age (y) 68.9 (13.8) 69.5 (13.9) 68.4 (13.7) 0.12
Sex (male) 1301 (56.0%) 332 (58.2%) 833 (55.2%) 0.22 Prestroke mRS (/5) 0.0 (0.0–1.0) 0.0 (0.0–1.0) 0.0 (0.0–1.0) 0.012 Glasgow Coma Scale (/15) 15 (12–15) 14 (12–15) 15 (13–15) <0.001 NIHSS score (/42) 12 (7–19) 15 (9–20) 11 (6–17) <0.001 Systolic blood pressure, mm Hg 172.6 (27.2) 173.8 (29.8) 175.5 (29.4) 0.25 Intraventricular hemorrhage 704 (30.7%) 147 (25.9%) 465 (30.9%) 0.026 Hematoma location
Supratentorial lobar 688 (29.6%) 206 (36.3%) 396 (26.4%) <0.001 Supratentorial deep 1451 (62.4%) 332 (58.6%) 1011 (67.5%) <0.001 Infratentorial 145 (6.2%) 29 (5.1%) 91 (6.1%) 0.41 Previous antiplatelet therapy 611 (26.3%) 164 (28.8%) 357 (23.7%) 0.016 Onset-to-CT time (median, h) 1.9 (1.4–2.8) 1.8 (1.3–2.5) 2.0 (1.4–3.0) <0.001 Onset-to-CT time (mean, h) 2.3 (1.3) 2.0 (1.1) 2.4 (1.4) <0.001 Hematoma volume, mL
ICH only (median, IQR) 13.3 (5.5–32.4) 21.4 (7.7–44.2) 10.7 (4.9–23.2) <0.001
ICH only, categorical <0.001†
<30 mL 1651 (72.6%) 345 (60.5%) 1213 (80.4%) 30–60 mL 365 (16.1%) 143 (25.1%) 184 (12.2%) >60 mL 257 (11.3%)‡ 82 (14.4%) 111 (7.4%)
ICH+IVH (median, IQR) 16.3 (6.3–37.4) 23.8 (9.1–50.8) 13.2 (5.3–29.1) <0.001 Blend sign 366 (16.1%) 133 (23.3%) 180 (11.9%) <0.001 Black hole sign 414 (18.2%) 130 (22.8%) 218 (14.5%) <0.001 Hypodensities 701 (30.2%) 225 (39.5%) 365 (24.3%) <0.001
Island sign 200 (8.8%) 65 (11.4%) 102 (6.8%) 0.001
Data are mean (SD), median (IQR), or number (%). Statistics are χ2 test, Mann-Whitney U test, Student t test, and Mantel-Haenszel test of
trend. ICH indicates intracerebral hemorrhage; IQR, interquartile range; IVH, intraventricular hemorrhage; mRS, modified Rankin Scale; and NIHSS, National Institutes of Health Stroke Scale.
*Assessments of hematoma expansion for 2077 patients with valid baseline and follow-up CT scans. †Both χ2 and Mantel-Haenszel test of trend’s P<0.001.
‡The largest baseline hematoma volume is 206.8 mL; 161 (7.1%) of patients had baseline hematoma volume >75 mL.
hypodensities (aOR, 1.33 [1.10–1.61]; P=0.003) resulted in sig-nificant shift toward worse modified Rankin Scale (goodness-of-fit test, P=0.92; proportional odds assumption not violated).
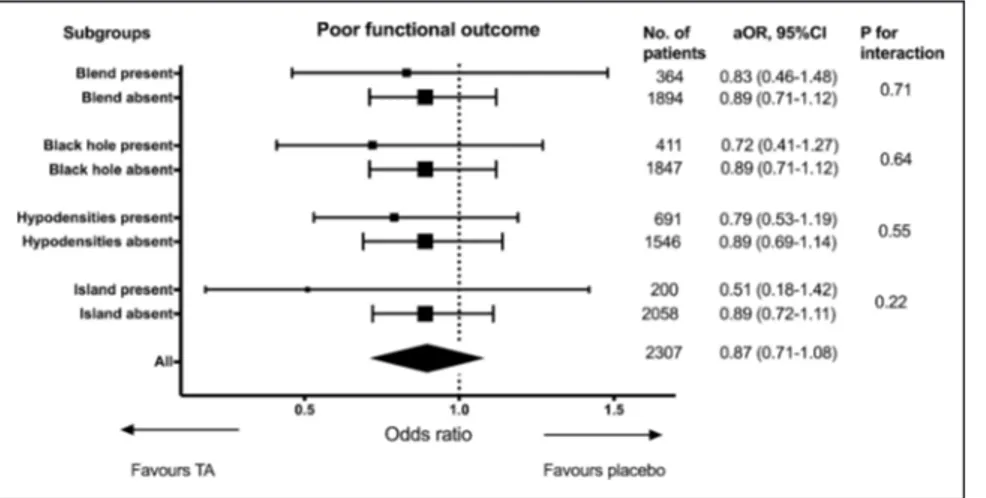
Overall, tranexamic acid reduced the risk of hematoma expansion (aOR, 0.77 [0.63–0.94]; P=0.01). Similarly, there was significant reduction in hematoma progression (aOR, 0.71 [0.59–0.86]; P<0.001) and total ICH expansion (aOR, 0.82 [0.67–0.99]; P=0.047). Logistic regression model strati-fied by presence of NCCT signs did not show any significant interactions between the presence of signs and the benefit of tranexamic acid in reducing hematoma expansion (Figure 2). The effect of tranexamic acid on functional outcome, stratified by presence of NCCT signs is shown in Figure 3. Tranexamic acid did not significantly improve functional outcome regard-less of the status of NCCT signs.
Discussion
In the largest randomized controlled trial of hemostatic therapy in ICH, we found that blend sign, black hole sign, and hypodensities were independent predictors of hematoma expansion. Nevertheless, addition of these signs to more es-tablished predictors of onset-to-CT time, baseline hematoma volume, and antiplatelet therapy only marginally improved the area under the curve. The island sign was not a significant in-dependent predictor of hematoma expansion.
Apart from Li et al who first described the blend and black hole signs, 2 large studies, Boulouis et al8 (n=1029) and
Morotti et al11 (n=989) found them to be independent
predic-tors of hematoma expansion. A recent meta-analysis of 5 stud-ies (2248 patients) found the pooled sensitivity and specificity of blend sign to be 0.28 (0.16–0.46) and 0.92 (0.88–0.95), respectively.17 A second meta-analysis of 5 studies (1495
patients) reported a pooled sensitivity and specificity of 0.30 (0.20–0.41) and 0.91 (0.87–0.94), respectively for black hole sign.18 Our study similarly found blend and black hole signs
to be highly specific but not sensitive for prediction of hema-toma expansion.
Hypodensities had been found to be a useful predictor of hematoma expansion and poor functional outcome as well.8,11
There is significant overlap between black hole sign and hypodensities where black hole sign is a subset of hypoden-sities. We found hypodensities to be more sensitive but less specific than black hole. The adjusted odd ratio in predicting hematoma expansion of hypodensities was similar to that for the black hole sign (aOR, 2.06 versus 2.01).
On the contrary, we did not find the island sign to be an independent predictor of hematoma expansion. The island sign was of particular interest as it was reported to be very specific, albeit less sensitive, than the other NCCT signs. The island sign was first reported as a predictor of hematoma ex-pansion and poor functional outcome in a single-center study by Li et al.7 Similarly, we found the island sign to have high
specificity but low sensitivity in detecting hematoma expan-sion. However, after accounting for hematoma volume, the is-land sign did not independently predict hematoma expansion. This may be because island sign was mostly present in large hematomas (64.6 mL in island sign positive versus 11.8 mL in island sign negative); hence, hematoma volume was a sig-nificant confounder. Comparatively, the median volume was 30 mL in island sign positive hematoma in study by Li et al.7
Another reason is the prevalence of island sign in our cohort was relatively low (8.8% compared with 16% in study by Li et al) and the numbers may be inadequately powered to detect a difference.
Table 2. Binary Logistic Regression Analyses for Predictors of Hematoma Expansion
Variables Unadjusted OR P Value Adjusted OR (Model 1)* P Adjusted OR (Model 2)† P Value
Age 1.01 (1.00–1.01) 0.12 1.00 (1.00–1.01) 0.42 1.00 (1.00–1.01) 0.36 Sex (male) 1.13 (0.93–1.37) 0.22 1.31 (1.05–1.62) 0.016 1.32 (1.06–1.64) 0.012 Premorbid mRS 1.11 (1.01–1.21) 0.031 1.07 (0.96–1.19) 0.22 1.07 (0.96–1.19) 0.22 Systolic blood pressure, mm Hg 0.998 (0.995–1.001) 0.25 1.000 (0.996–1.004) 0.98 1.000 (0.997–1.004) 0.85 Glasgow Coma Scale (/15) 0.89 (0.85–0.93) <0.001 0.94 (0.89–0.99) 0.013 0.94 (0.89–0.99) 0.020 Previous antiplatelet therapy 1.31 (1.05–1.62) 0.016 1.27 (1.00–1.62) 0.053 1.28 (1.00–1.64) 0.048 Intraventricular hemorrhage 0.78 (0.63–0.97) 0.026 0.66 (0.52–0.84) 0.001 0.65 (0.51–0.83) 0.001 Supratentorial lobar 1.59 (1.29–1.95) <0.001 1.07 (0.81–1.40) 0.65 1.07 (0.81–1.40) 0.64 Baseline hematoma volume (per
10 mL increase)
1.17 (1.13–1.22) <0.001 1.18 (1.12–1.26) <0.001 1.18 (1.12–1.27) <0.001 Onset-to-CT time, h 0.79 (0.73–0.86) <0.001 0.75 (0.69–0.83) <0.001 0.75 (0.69–0.83) <0.001 Treatment with tranexamic acid 0.83 (0.68–1.00) 0.053 0.77 (0.63–0.94) 0.010 0.76 (0.62–0.93) 0.009 Blend sign 2.25 (1.75–2.88) <0.001 1.53 (1.16–2.03) 0.003 1.49 (1.13–1.98) 0.005 Black hole sign 1.75 (1.37–2.23) <0.001 2.03 (1.34–3.08) 0.001 … … Hypodensities 2.04 (1.66–2.51) <0.001 … … 2.06 (1.48–2.89) <0.001 Island sign 1.77 (1.28–2.46) 0.001 0.85 (0.57–1.26) 0.42 0.84 (0.57–1.25) 0.39 CT indicates computed tomography; mRS, modified Rankin Scale; and OR, odds ratio.
*Model 1: adjustment for all variables in unadjusted analysis except hypodensities with addition of black hole X hematoma volume interaction (P=0.004). †Model 2: adjustment for all variables in unadjusted analysis except black hole sign with addition of hypodensities X hematoma volume interaction (P=0.008).
126 Stroke January 2020
Black hole sign, hypodensities, and island sign independ-ently predicted poor functional outcome, although island sign did not predict hematoma expansion. Conversely, the blend sign that independently predicted hematoma expansion did not predict poor functional outcome. This suggests that although hematoma expansion increased the risk of poor functional out-come, there were other factors that contributed to poor func-tional outcome. This finding is in keeping with the trial main results where tranexamic acid significantly reduced hematoma expansion, early death (<7 days), and serious adverse events but did not improve functional outcome at day 90.4 We
hypoth-esize that one of the mechanisms may be the development of perihematomal edema. Hematomas with island sign have a larger surface area of contact with the surrounding tissue and this may contribute to more inflammation and cerebral edema.
While some of the NCCT signs are useful predictors of hematoma expansion, none of the signs reliably predicted
clinical benefit of tranexamic acid. This again supports the hypothesis of alternate pathological process contributing to poor outcome. Although tranexamic acid reduced the risk of hematoma expansion, the effect of tranexamic acid is short lasting with a half-life of 3 hours.19 It is therefore unlikely
that tranexamic acid will have any biological effect on events occurring later such as perihematomal edema. In addition, the number of patients with NCCT signs is relatively small and may be inadequately powered to detect a modest benefit of tranexamic acid. The usefulness of the CTA spot sign in pre-dicting clinical benefit of tranexamic acid is being studied in a separate substudy.16
Our findings of male sex, lower Glasgow Coma Scale, ab-sence of IVH, prior antiplatelet therapy, larger baseline he-matoma volume, and shorter onset-to-CT time as independent predictors of hematoma expansion were consistent with pre-vious studies.2 Notably, although intensive blood pressure Table 3. Binary Logistic Regression Analyses for Predictors of Death and Dependency (Dichotomized mRS Score of ≥4)
Variables Unadjusted OR P Value Adjusted OR (Model 1)* P Value Adjusted OR (Model 2)† P Value
Age 1.05 (1.05–1.06) <0.001 1.05 (1.04–1.06) <0.001 1.05 (1.04–1.06) <0.001 Sex (male) 0.61 (0.52–0.72) <0.001 0.76 (0.61–0.95) 0.016 0.77 (0.62–0.96) 0.019 Premorbid mRS 2.02 (1.81–2.25) <0.001 1.71 (1.50–1.95) <0.001 1.71 (1.50–1.95) <0.001 Systolic blood pressure, mm Hg 0.998 (0.995–1.0) 0.104 1.000 (0.996–1.003) 0.81 1.000 (0.996–1.003) 0.87 Glasgow Coma Scale (/15) 0.66 (0.62–0.70) <0.001 0.77 (0.72–0.82) <0.001 0.77 (0.73–0.82) <0.001 Previous antiplatelet therapy 2.20 (1.81–2.67) <0.001 1.32 (1.02–1.71) 0.036 1.33 (1.02–1.72) 0.034 Intraventricular hemorrhage 3.43 (2.82–4.18) <0.001 2.24 (1.76–2.87) <0.001 2.26 (1.77–2.89) <0.001 Supratentorial lobar 1.55 (1.29–1.86) <0.001 0.39 (0.29–0.53) <0.001 0.40 (0.29–0.54) <0.001 Baseline hematoma volume (per
10 mL increase)
1.58 (1.49–1.68) <0.001 1.60 (1.47–1.74) <0.001 1.60 (1.47–1.76) <0.001 Onset-to-CT time, h 0.91 (0.85–0.97) 0.003 0.87 (0.80–0.94) 0.001 0.87 (0.80–0.94) 0.001 Treatment with tranexamic acid 0.99 (0.84–1.16) 0.89 0.87 (0.71–1.08) 0.23 0.87 (0.70–1.07) 0.18 Blend sign 1.95 (1.54–2.47) <0.001 1.05 (0.76–1.47) 0.76 1.04 (0.75–1.45) 0.81 Black hole sign 2.49 (1.97–3.15) <0.001 1.52 (1.10–2.11) 0.012 … … Hypodensities 2.50 (2.07–3.03) <0.001 … … 1.37 (1.05–1.78) 0.019 Island sign 7.29 (4.68–11.35) <0.001 2.59 (1.21–5.55) 0.014 2.21 (1.04–4.67) 0.037 CT indicates computed tomography; mRS, modified Rankin Scale; and OR, odds ratio.
*Model 1: adjustment for all variables on unadjusted analysis except hypodensities with addition of black hole X island interaction. †Model 2: adjustment for all variables on unadjusted analysis except black hole sign with addition of hypodensities X island interaction.
Figure 2. Effect of tranexamic acid on he-matoma expansion, stratified by presence of noncontrast computed tomography signs. aOR indicates adjusted odds ratio.
lowering can reduce hematoma expansion,20 systolic blood
pressure on admission per se was not a predictor of hematoma expansion, a finding replicated in our study.2
The strength of the study is the large sample size and good availability of CT scans, making this the largest imaging anal-ysis in ICH. There is a wide range of hematoma volumes from very small to very large hematoma reflective of real-world patients with ICH. To account for intraventricular extension and missing data, we performed exploratory analysis using total ICH expansion and a composite outcome of hematoma progression (data available in 99.5%) as outcomes. The analy-ses yielded similar results hence the conclusion is robust.
One limitation of this study is the interrater agreement is only moderate (κ, 0.53–0.64). The raters were from a range of background (physicians, radiographer, and medical student). Although all raters were trained before commencing assess-ment, the interpretation of the NCCT signs may not be as ac-curate as other studies where the assessments were usually performed by only 2 expert raters.5–7,11 Having more raters also
reduced agreement as it is less likely for 4 raters to completely agree on the presence of signs compared with 2 raters. However, our interpretation represents a real world scenario where the rat-ers are likely to have different background and experience.
Recently, there is much enthusiasm in exploring the role of NCCT signs in predicting hematoma expansion. We found pre-viously established factors of baseline hematoma volume and onset-to-CT time to be more significant predictors of hema-toma expansion. Addition of NCCT signs only improved the area under the curve minimally by 0.01 to 0.013. Hematoma volume may be the most important CT marker of hematoma expansion and may be used to better select in future hemostatic trials. Although we have used semiautomated segmentation technique for the volume measurement, simple clinical tool such as the ABC/2 method has been shown previously to be a reliable and feasible method in the context of clinical trials.21 In
view of its prognostic value, calculation of hematoma volume should perhaps be recommended as a routine clinical practice.
Conclusions
Blend sign, black hole sign, and hypodensities predict hema-toma expansion while black hole sign, hypodensities, and is-land sign predict poor functional outcome. NCCT signs did not predict a better response to tranexamic acid.
Acknowledgments
N. Sprigg and R. Dineen helped with study concept and design. Z.K. Law, A. Ali, and K. Krishnan measured hematoma volume and assessed for the presence of blend, black hole and island signs. A. Bischoff helped with assessment of black hole and island signs. R. Dineen, L. Cala, Alessandro Adami, and Ana Casado are neuroradi-ologists who performed adjudications. Z.K. Law performed the sta-tistical analysis and wrote the first draft of the manuscript. All authors revised and approved the final draft.
Sources of Funding
This article was supported by National Institute of Health Research Health Technology Assessment Programme (11_129_109) and Swiss Heart Foundation.
Disclosures
N. Sprigg reports grants from National Institute for Health Research HTA and RfPB during the conduct of the study. P.M. Bath reports grants from National Institute for Health Research HTA and Research Councils United Kingdom during the conduct of the study; personal fees from Nestle, Sanofi, Diamedica, Moleac, and Phagenesis; nonfinancial support from Platelet Solutions. C. Roffe reports grants from National Institute for Health Research HTA and Research Councils United Kingdom during the conduct of the study; personal fees from Daiichi Sankyo, Allergan, Air Liquide, Merz, Boehringer, Bayer, Johnson and Johnson, Sanofi, Emtensor; nonfinancial support from European Stroke Conference and TRIDENT study team; other support from Firstkind Medical, Medtronic and Brainomix outside the submitted work. A. Ali re-ceived funding from National Institutes of Health. S. Pszczolkowski received funding from the British Heart Foundation. C. Ovesen re-ceived nonfinancial support from Merck Sharp and Dohme outside the submitted work.
References
1. Brott T, Broderick J, Kothari R, Barsan W, Tomsick T, Sauerbeck L, et al. Early hemorrhage growth in patients with intracerebral hemorrhage. Stroke. 1997;28:1–5. doi: 10.1161/01.str.28.1.1
2. Al-Shahi Salman R, Frantzias J, Lee RJ, Lyden PD, Battey TWK, Ayres AM, et al; VISTA-ICH Collaboration; ICH Growth Individual Patient Data Meta-Analysis Collaborators. Absolute risk and predictors of the growth of acute spontaneous intracerebral haemorrhage: a system-atic review and meta-analysis of individual patient data. Lancet Neurol. 2018;17:885–894. doi: 10.1016/S1474-4422(18)30253-9
3. Demchuk AM, Dowlatshahi D, Rodriguez-Luna D, Molina CA, Blas YS, Dzialowski I, et al; PREDICT/Sunnybrook ICH CTA Study Group. Prediction of haematoma growth and outcome in patients with intrace-rebral haemorrhage using the CT-angiography spot sign (PREDICT): a prospective observational study. Lancet Neurol. 2012;11:307–314. doi: 10.1016/S1474-4422(12)70038-8
Figure 3. Effect of tranexamic acid on func-tional outcome, stratified by presence of non-contrast computed tomography signs. aOR indicates adjusted odds ratio.
128 Stroke January 2020
4. Sprigg N, Flaherty K, Appleton JP, Al-Shahi Salman R, Bereczki D, Beridze M, et al; TICH-2 Investigators. Tranexamic acid for hyper-acute primary IntraCerebral Haemorrhage (TICH-2): an international randomised, placebo-controlled, phase 3 superiority trial. Lancet. 2018;391:2107–2115. doi: 10.1016/S0140-6736(18)31033-X
5. Li Q, Zhang G, Huang YJ, Dong MX, Lv FJ, Wei X, et al. Blend sign on computed tomography: novel and reliable predictor for early he-matoma growth in patients with intracerebral hemorrhage. Stroke. 2015;46:2119–2123. doi: 10.1161/STROKEAHA.115.009185 6. Li Q, Zhang G, Xiong X, Wang XC, Yang WS, Li KW, et al. Black
hole sign: novel imaging marker that predicts hematoma growth in patients with intracerebral hemorrhage. Stroke. 2016;47:1777–1781. doi: 10.1161/STROKEAHA.116.013186
7. Li Q, Liu QJ, Yang WS, Wang XC, Zhao LB, Xiong X, et al. Island sign: an imaging predictor for early hematoma expansion and poor outcome in patients with intracerebral hemorrhage. Stroke. 2017;48:3019–3025. doi: 10.1161/STROKEAHA.117.017985
8. Boulouis G, Morotti A, Brouwers HB, Charidimou A, Jessel MJ, Auriel E, et al. Association between hypodensities detected by computed tomography and hematoma expansion in patients with intracerebral hem-orrhage. JAMA Neurol. 2016;73:961–968. doi: 10.1001/jamaneurol. 2016.1218
9. Selariu E, Zia E, Brizzi M, Abul-Kasim K. Swirl sign in intracerebral haemorrhage: definition, prevalence, reliability and prognostic value. BMC Neurol. 2012;12:109. doi: 10.1186/1471-2377-12-109
10. Boulouis G, Morotti A, Charidimou A, Dowlatshahi D, Goldstein JN. Noncontrast computed tomography markers of intracere-bral hemorrhage expansion. Stroke. 2017;48:1120–1125. doi: 10.1161/STROKEAHA.116.015062
11. Morotti A, Boulouis G, Romero JM, Brouwers HB, Jessel MJ, Vashkevich A, et al; ATACH-II and NETT Investigators. Blood pressure reduction and noncontrast CT markers of intracerebral hemorrhage expansion. Neurology. 2017;89:548–554. doi: 10.1212/WNL.0000000000004210 12. Yu Z, Zheng J, Xu Z, Li M, Wang X, Lin S, et al. Accuracy of shape
irregularity and density heterogeneity on noncontrast computed tomog-raphy for predicting hematoma expansion in spontaneous intracerebral hemorrhage: a systematic review and meta-analysis. World Neurosurg. 2017;108:347–355. doi: 10.1016/j.wneu.2017.09.022
13. Yu Z, Zheng J, Ma L, Guo R, You C, Li H. Predictive validity of hypodensities on noncontrast computed tomography for hematoma growth in intracerebral hemorrhage: a meta-analysis. World Neurosurg. 2019;123:e639–e645.
14. Sprigg N, Robson K, Bath P, Dineen R, Roberts I, Robinson T, et al; TICH-2 Investigators. Intravenous tranexamic acid for hyper-acute primary intracerebral hemorrhage: protocol for a random-ized, placebo-controlled trial. Int J Stroke. 2016;11:683–694. doi: 10.1177/1747493016641960
15. Yushkevich PA, Piven J, Hazlett HC, Smith RG, Ho S, Gee JC, et al. User-guided 3D active contour segmentation of anatomical struc-tures: significantly improved efficiency and reliability. Neuroimage. 2006;31:1116–1128. doi: 10.1016/j.neuroimage.2006.01.015
16. Ovesen C, Jakobsen JC, Gluud C, Steiner T, Law Z, Flaherty K, et al. Prevention of haematoma progression by tranexamic acid in intracerebral haemorrhage patients with and without spot sign on admission scan: a statistical analysis plan of a pre-specified sub-study of the TICH-2 trial. BMC Res Notes. 2018;11:379. doi: 10.1186/s13104-018-3481-8
17. Yu Z, Zheng J, Guo R, Ma L, Li M, Wang X, et al. Performance of blend sign in predicting hematoma expansion in intracerebral hemor-rhage: a meta-analysis. Clin Neurol Neurosurg. 2017;163:84–89. doi: 10.1016/j.clineuro.2017.10.017
18. Zheng J, Yu Z, Guo R, Li H, You C, Ma L. Meta-analysis of predic-tive significance of the black hole sign for hematoma expansion in intracerebral hemorrhage. World Neurosurg. 2018;115:e711–e716. doi: 10.1016/j.wneu.2018.04.140
19. Nilsson IM. Clinical pharmacology of aminocaproic and tranexamic acids. J Clin Pathol Suppl (R Coll Pathol). 1980;14:41–47.
20. Anderson CS, Huang Y, Wang JG, Arima H, Neal B, Peng B, et al; INTERACT Investigators. Intensive blood pressure reduction in acute cerebral haemorrhage trial (INTERACT): a randomised pilot trial. Lancet Neurol. 2008;7:391–399. doi: 10.1016/S1474-4422(08)70069-3 21. Webb AJ, Ullman NL, Morgan TC, Muschelli J, Kornbluth J, Awad IA,
et al; MISTIE and CLEAR Investigators. Accuracy of the ABC/2 score for intracerebral hemorrhage: systematic review and analysis of MISTIE, CLEAR-IVH, and CLEAR III. Stroke. 2015;46:2470–2476. doi: 10.1161/STROKEAHA.114.007343