2020, 4(1)
2602-2052 DOI: 10.30521/jes.635582 Research Article
Estimation of the switching losses in DC-DC boost converters by
various machine learning methods
Kadir Sabancı
Karamanoğlu Mehmetbey University, Department of Electrical and Electronic Engineering, Karaman, Turkey, [email protected]
Selami Balcı
Karamanoğlu Mehmetbey University, Department of Electrical and Electronic Engineering, Karaman, Turkey, [email protected]
Muhammet Fatih Aslan
Karamanoğlu Mehmetbey University, Department of Electrical and Electronic Engineering, Karaman, Turkey, [email protected]
Submitted: 21.10.2019 Accepted: 10.01.2020 Published: 31.03.2020
Abstract: DC-DC converter circuits are topologies commonly used in power electronics applications such as renewable energy sources, electric vehicles, uninterruptible power supplies and DC transmission systems. The most important factors affecting efficiency and thus performance is the choice of the power semiconductor switching element as well as the circuit design and types of these topologies. In this context, power semiconductors are determined according to the switching frequency and current-voltage parameters. However, due to other operating modes of the circuit and load variation during the power conversion, the losses of the switching elements do not remain constant. In this study, a parametric simulation is performed in a conventional DC-DC boost converter circuit using the parameters related to the Insulated-Gate Bipolar Transistor (IGBT) power-switching element selected at a certain current-voltage capacity. These parameters are switching frequency, duty ratio and load change of the converter. Finally, using the data obtained, the loss of switching losses are estimated by the Multilayer Perceptron (MLP), Support Vector Machine (SVM), K- Nearest Neighbors (KNN) and Random Forest (RF) Machine Learning (ML) techniques.
Keywords: K- nearest neighbors, Multilayer perceptron, Random forests, Support vector machine, Switching losses
Cite this paper as:
Sabancı, K., Balcı, S., & Aslan M.F. Estimation of the switching losses in DC-DC boost converters by various machine learning methods. Journal of Energy Systems 2020,
4(1), 1-11, DOI: 10.30521/jes.635582
© 2020 Published by peer-reviewed open access scientific journal, JES at DergiPark (https://dergipark.org.tr/en/pub/jes)
Nomenclature
IGBT Insulated Gate, Bipolar, Transistor KNN K- Nearest Neighbors
MAE Mean Absolute Error ML Machine Learning MLP Multilayer Perceptron
RF Random Forest
RMSE Root Mean Square Error SVM Support Vector Machine
1. INTRODUCTION
DC-DC power conversion is frequently used to achieve the desired DC voltage level in application areas such as renewable energy sources [1], network interfaces, electric vehicles, high voltage DC transmission system, and uninterruptible power supplies. Design of basic DC-DC power converter circuits and the development of switching elements in recent years provides higher-frequency switching in the larger power systems with the original circuit topologies. Switching losses are a significant problem in power electronics circuits [2], which are both exposed to heat and affect system efficiency. However, the cooling requirement and the compact design limitations also indicate that switching losses must be taken into account in the design of the power electronics circuit. Although the thermal parameters such as switching frequency, current and voltage resistances are the important factors in determining the switching elements, the system behavior can dynamically differentiate these losses. In this context, there are various methods in the literature to estimate the switching losses during the operation of the system.
In study by Shahin et al, the switching loss estimation algorithm are presented. An improved DC / DC boost converter controller is based on the estimation of any loss type occurring in the converter. The algorithm analyzes and develops theoretically and compares it with experimental results to improve the convergence speed and accuracy of the control loop. Mathematical modelling is done by paying attention to all important features and dependent parameters such as conduction losses and switching losses of semiconductor components [3].
John Shen et al. investigates the physical structure of MOSFET switching processes using a semiconductor device modeling approach, and then examines the switching loss estimation method based on new physical approaches. Afterward, a new method of estimating the switching loss based on the power MOSFET datasheet information is introduced and verified by numerical modeling data [4]. In Rajapakse’s and his friends study, there is an improvement in a method developed to estimate the switching losses of an IGBT that is subjected to difficult switching conditions without resorting to both very small time-step and long-term simulations. This is obtained by deriving a formula set to approximate the power switch's turn-on and turn-off losses. It is also important to state that these formulations may not provide sufficient accuracy to determine the switching losses running under loads with nonlinear behaviors [5].
As noted in [6], the power loss determinations during switching conditions and the parameters of the switching devices according to the datasheets [7] shows that the performance of switching components is not sufficiently accurate for such an application. The methods proposed by [8] and [9] are based on a precise analysis of the switching conditions. Because these methods are difficult to using and usually measurements cannot be obtained for the different operating conditions of the converter circuit, thus it is recommended to directly identify the total losses without any switching and conduction losses. At this point, ML techniques can be used. This is because ML techniques can provide much more practical and accurate solutions in difficult mathematical calculations or in applications that are difficult to try and measure. Today, ML techniques are widely used in the field of energy and electricity. In the study of Eroglu and Seckinler [10], an ANN-based application was developed to estimate early fault of a wind turbine. In another study [11], the value of Global Solar Radiation (GSR), a vital parameter for the design and operation of solar systems, was estimated. For this purpose, Support Vector Regression (SVR) and e Firefly Optimization Algorithm (FFA) algorithms were used as hybrid.
Compared to the approaches proposed in the literature, modelling with ML techniques offers two advantages that it does not require precise analysis during switching conditions, and the loss parameters
can be estimated without requiring a wide variety of input voltages and switching duty values [6]. In Bulut and Cengiz’s, and Kouro and his friend’s studies, a mathematical power loss model derived for a DC / DC boost converter was created with the help of a few experimental studies [12,13].
In summary, this study showed that the optimal duty ratio/switching frequency selection could lead to almost 7% of the efficiency change in a DC/DC boost converter. The conduction losses mainly occur due to the internal resistance of the semiconductor devices and the voltage drops on them. In a typical boost converter, there are four defective elements with internal resistances and parasitic capacitances, which are cause to result in additional conductivity and switching losses. Due to the skin effect, the internal resistance of them may vary depending on the changing switching frequencies. However, this change is small enough to be neglected and therefore these changes are neglected in this mathematical model. However, this kind of effects can be analyzed in more detail by software such as Ansys-Electronics. In this context, parametric simulations arise as the right choice. Data obtained for parametric simulations and system behavior are processed with the MLP, SVM, KNN and RF ML algorithms. This method is very useful for estimating switching losses [14].
In this study, DC-DC boost converter circuit is designed for classical 48 V input and various output voltage levels. In this circuit, the parametric simulations are performed based on the switching frequency, switching duty ratio, and load change of the IGBT power switching element selected at a certain current-voltage capacity by Ansys-Electronics Desktop 2019 R1 software. Then, using the data obtained, the switching losses were estimated with the ML techniques.
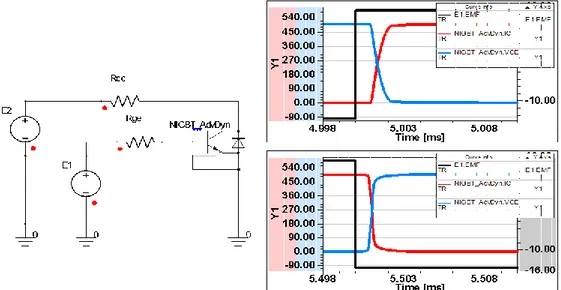
2. SIMULATION STUDIES OF THE POWER ELECTRONIC CIRCUIT
The behavior of semiconductor switching elements used in power electronics circuits has reached high frequency on-off and larger current-voltage values in recent years. However, the losses that occur during switching cannot be precluded, but only a few precautions are taken to minimize it. In this context, although the switching losses can be understood from semiconductor manufacturer datasheet, the dynamic behavior of the system makes the losses very dissimilar. Therefore, in order to be able to predict the losses, circuit design performance can be improved by using power electronics software or simulations. In the transmission and cutting graph of a semiconductor power switch shown in Figures 1-2, the delay time (td), the rise time (tr), the storage time (ts) and the falling time (tf) must be greater
than zero.
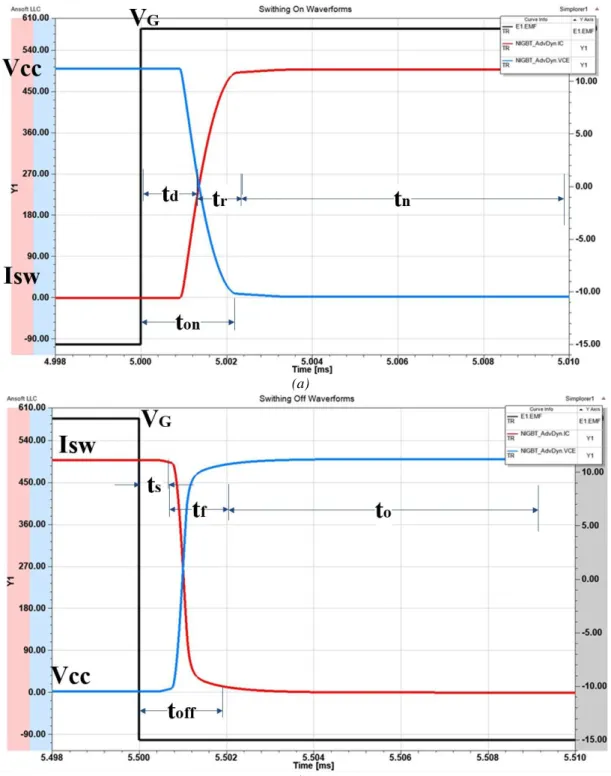
During the transition to transmission, the voltage of the switch (Vsw) decreases while the switch current
(Isw) rises [15]. In the other hand, during the transition to cutting, the current value decreases while the
voltage value increases. The transition time to transmission (ton) is equal to the sum of the delay and rise
times. The transition time to cutting (toff) is equal to the sum of the storage and falling times as given in
Figure 2.
(a)
(b)
Figure 2. Switching signals, (a) Switching-on waveforms, (b) Switching-off waveforms
Unlike the ideal loss-free switch, a real power switch consumes some energy both during transmission and during switching. When a semiconductor element is in transmission, a 1 V voltage drop occurs. This voltage may also be higher than 1-3 V in some cases. The semiconductor switches also have a state resistance (𝑅𝑡𝑟). This resistance will also comply with Ohm's Law. The transmission loss (𝑃𝑡𝑟−𝑐𝑜𝑛𝑑) of
𝑃𝑡𝑟−𝑐𝑜𝑛𝑑 = (𝐼𝑡𝑟−𝑟𝑚𝑠)2𝑅𝑡𝑟 (1)
During transmission, the mean value of the power consumed (𝑃𝑜𝑛) can be defined as follows in Eq.2.
𝑃𝑜𝑛= 1 𝑇𝑠 ∫ 𝑝𝑑𝑡 𝑡𝑛 0 (2)
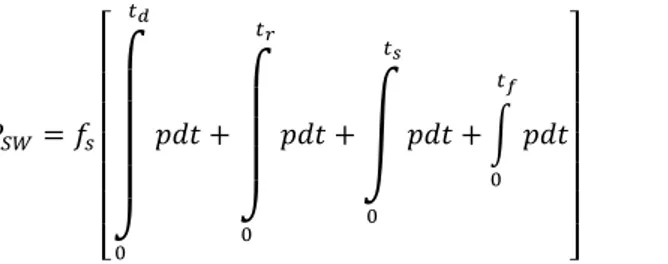
In this equation, 𝑇𝑆 indicates the transmission time and p is the instantaneous power loss, in other words, multiply of 𝑉𝑆𝑊 voltage between the ends of the switch and the 𝐼𝑆𝑊 current flowing from the switch. In addition, due to both the voltage and current values are high during the transition of the switch to the transmission and cutting, power losses occur during the transition to a considerable amount of transmission and cutting. The switching power loss during the transition to transmission and cutting can be expressed as 𝑃𝑆𝑊in Eq. 3 [15]. 𝑃𝑆𝑊= 𝑓𝑠 [∫ 𝑝𝑑𝑡 + ∫ 𝑝𝑑𝑡 + ∫ 𝑝𝑑𝑡 + ∫ 𝑝𝑑𝑡 𝑡𝑓 0 𝑡𝑠 0 𝑡𝑟 0 𝑡𝑑 0 ] (3)
Here, 𝑓𝑆 = 1 / 𝑇𝑆 indicates the switching frequency, td, tr, ts, and tf respectively, the delay time, the rise
time, the storage time and the falling time. Thus, the power losses of a switch can be expressed as in Eq. 4.
𝑃𝐷 = 𝑃𝑂𝑁+ 𝑃𝑆𝑊+ 𝑃𝐺 (4)
Here PG shows the power loss of the gate driver. However, these losses are negligible because they are
too small compared to the transmission and switching losses. The switching losses in the power electronics circuit design are difficult to predict in advance and these losses are an important problem that worsens the efficiency of the system as the switching frequency and power transmission level increase. Therefore, there are many simulation software available to quickly analyze different designs or to determine the power electronics circuit performance.
The truest results can be obtained if the simulation circuit can be modeled close to reality. In this context, one or more of the circuit parameters are changed. Parametric simulations are very useful with linear/logarithmic steps. Numerous data can be obtained with parametric simulations, and this data provides useful performance information such as switching loss and output voltage ripple. The simulation circuit used in this study is shown in Figure 3.
As can be seen in Table 1, the switching frequency (𝑓𝑠) was changed between 50-100 kHz in 5 kHz
steps. The switching losses at the high-frequency switching frequency have been investigated. The switching frequency can be drawn up to 10 kHz if desired. In order to obtain different voltage levels at the output, the switching duty ratio (D) was changed between 0.1-0.7 in 0.05 linear steps. However, in order to examine the switching losses according to different load values, the load resistance at the converter output has been changed between 10-50 ohms with 10-ohm linear steps and the three parameters have been changed as parametric. Thus, the switching loss data were obtained.
Table 1. Technical properties of the parametric simulation
Parameter Value Step Interval
Vi 48 V constant Vo 53-160 V variable Gain 1.11-3.33 variable fsw 50-100 kHz 5 kHz D 0.1-0.70 0.05 L 100 µH constant C 100 µF constant RL 10-50 ohms 10 ohms
Critical inductance (Lc) and critical capacitance (Cc) values that can be provided for continuous
conduction mode for the boost converter circuit are given in Eqs. 5 and 6. Where the load (R1) at the
converter output is constant [13].
𝐿𝐶= 𝐿 = 𝐷(1 − 𝐷)𝑅1 2𝑓 (5) 𝐶𝐶= 𝐶 = 𝐷 2𝑓𝑅1 (6)
3. MACHINE LEARNING METHODS
3.1. Multilayer Perceptron
MLP is a class of feedforward Artificial Neural Network (ANN) [16] consisting of at least three layers of nodes, an input layer, a hidden layer, and an output layer. ANN is a model designed for information processing and has inspired by biological neurons in its design. Classification, regression and pattern recognition are performed with ANN. ANN is composed of neurons connected by a specific weight value [17-19]. A flow of information occurs by updating these weights. As the weights are updated, the output value approaches the target value. The update process continues iteratively until the weights reach the optimum value. As a result, the training process is completed and the performance of the system is measured using test data [20, 21]. ANN has a large number of parameters such as learning rate, number of hidden layer neuron, momentum coefficient, number of iterations, etc. that affect the system performance.
3.2. K-Nearest Neighbor
KNN is an unsupervised learning method that is robust to learn and easy to understand. KNN classifies the data in the property space according to the distance. In the KNN classification algorithm, to determine the class of the test sample, k training data samples, which are closest to the test sample, are taken into consideration. If most of the k data belongs to which class, new data is assigned to that class [22, 23].
3.3. Support Vector Machine
SVM is a highly effective and simple supervised method used for classification and regression. SVM draws a boundary (hyperplane) between the classes in the plane for classification. In this way, different classes are separated. The hyperplane must be equal to the nearest member of each class. With SVM, how to draw this plane is answered. With SVM, multi-class data can be classified. In cases where the data cannot be decomposed linearly, a different high-dimensional property space is created by mapping. In this way, the data can be separated linearly. The kernel trick is used for this [24].
3.4. Random Forest
RF is a Decision Tree (DT) based ensemble learning method that can be used in classification and regression applications. The DT algorithm within RF is run N times to increase the accuracy. Each individually created DT generates RF when used collectively. RF is very fast, robust to over-fitting problem and it is possible to create as many trees as the user wants [25].
4. APPLICATION AND RESULTS
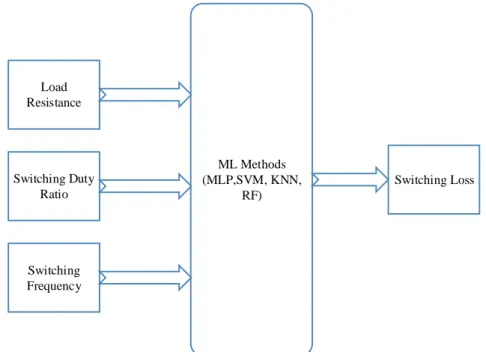
MLP, SVM, KNN, RF based ML application was performed in MATLAB in order to estimate the switching loss. As these ML methods contains many parameters in its structure, these MLP, SVM, KNN, RF models which provides the best estimate was investigated. In accordance with this purpose, different ML models were obtained by using different parameters. The general architecture of the study is shown in Figure 4. In this study, a workstation with Intel® core ™ i7-7700HQ, 2.4 GHz, 4 GB graphics card and 16 GB RAM is used.
Load Resistance Switching Duty Ratio Switching Frequency ML Methods (MLP,SVM, KNN, RF) Switching Loss
Figure 4. General architecture of the application
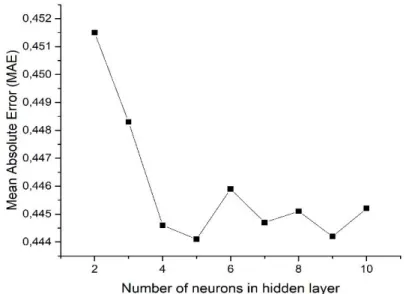
The parameter values of each machine learning algorithm were determined using trial and error method. As a result, Table 2 shows the most appropriate values of the parameters of different ML methods. For example, in MLP, MAE values were calculated by varying the number of hidden layer neurons between 2 and 10. Figure 5 shows the MAE values obtained according to the number of neurons in the hidden
layer. According to this Figure 5, the optimal number of hidden layer neurons is determined as 5. The Pearson VII function-based Universal Kernel (PUK) [26] in Table 2 is a hyperparameter of SVM.
Figure 5. MAE values according to the number of hidden layer neurons
Table 2. Best parameter values for different ML methods
Models Parameters Set type/value
MLP
Epochs 500
Learning rate 0.3
Momentum parameter 0.2
Learning algorithm Levenberg–Marquardt
Hidden layer 1
Number of neurons in the hidden layer 5
SVM
Kernel function PUK
Kernel function coefficient 1.8
Slack variable coefficient 25000
Omega 2.75
Sigma 2.0
KNN Distance function Euclidean Distance
K neighborhood number 5
RF Number of trees 100
Number of execution slots 1
During training operations, the dataset was divided into two groups randomly of 75% and 25%. The ANN models were analyzed to find the best model that could be used to estimate switching loss. 715 data were obtained using a simulation program. While 75% of the dataset was used for training, the rest of the dataset (179 data) were used for tests to determine the performance of the trained model. The Root Mean Square Error (RMSE) and Mean Absolute Error (MAE) metrics were applied as performance measurement criteria. The RMSE and MAE metrics were calculated by using Eqs. 7 and 8, respectively. RMSE and MAE values of ML methods are shown in Table 3.
𝑅𝑀𝑆𝐸 =1 𝑁∑ √(𝑜𝑢𝑡𝑝𝑢𝑡 − 𝑡𝑎𝑟𝑔𝑒𝑡) 2 𝑁 𝑖=1 (7) 𝑀𝐴𝐸 =1 𝑁∑|𝑜𝑢𝑡𝑝𝑢𝑡 − 𝑡𝑎𝑟𝑔𝑒𝑡| 𝑁 𝑖=1 (8)
Table 3. Best parameter values for different ML methods
ML Algorithms MAE RMSE Correlation coefficient Training Time (sec)
MLP 0.4441 0.5623 0.9778 0.25
SVM 0.4298 0.5673 0.9759 0.28
KNN 0.5577 0.6929 0.9629 0.01
RF 0.3462 0.4389 0.9853 0.02
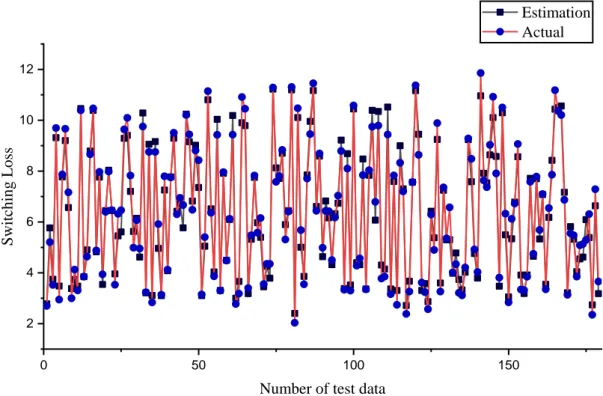
When the values in Table 3 are examined, it is seen that all ML methods make a very good estimation. However, the best results were obtained with RF. The estimated values and actual values obtained by RF are shown in Figure 6.
0 50 100 150 2 4 6 8 10 12 Switching L oss
Number of test data
Estimation Actual
Figure 6. Real and estimated values of test data
5. CONCLUSION
In this study, the optimum models predicting switching losses was determined. Dataset obtained as a result of simulation was divided into two groups with the percentages of 75% and 25%. Afterwards, 75% of the dataset was used for training, while the rest was used for testing to calculate the estimation accuracy. For automatic estimation of switching losses, ML methods such as MLP, SVM, KNN and RF were used. These methods have parameters that affect the estimation value. The parameter values were obtained to give the best accuracy. The Root Mean Square Error (RMSE) and Mean Absolute Error (MAE) metrics were employed in order to evaluate the performance of different ML models. The results showed that switching losses can be achieved with high accuracy with ML methods. Especially with RF, more successful results were obtained compared to other methods. It is also very advantageous in terms of speed. The MAE and RMSE values of this RF model were calculated as 0.3432 and 0.4389, respectively.
REFERENCES
[1] Uğurlu A, Gokcol C. A case study of PV-Wind-Diesel-Battery hybrid system, Journal of Energy Systems 2017, 1(4),138-147 DOI: 10.30521/jes.348335.
[2] Ali, A., Erçelebi, E., A Low-cost modelling of the variable frequency drive optimum in industrial applications. Journal of Energy Systems 2018, 2(1), 28-42, DOI: 10.30521/jes.405774.
[3] Shahin, A, Payman, A, Martin, JP, Pierfederici, S, Meibody-Tabar, F. Approximate novel loss formulae estimation for optimization of power controller of dc/dc converter. 36th Annual Conference on IEEE
Industrial Electronics Society (IECON), 7-10 November 2010, IEEE, Glendale, AZ, USA, pp. 373-378, DOI:
10.1109/IECON.2010.5674999.
[4] John Shen, Z, Xiong, Y, Cheng, X, Fu, Y, Kumar, P. Power MOSFET switching loss analysis: A New insight.
2006 IEEE Industry Applications Conference Forty-First IAS Annual Meeting, 8-12 October 2006, IEEE,
Tampa, FL, USA, pp. 1438-1442, DOI: 10.1109/IAS.2006.256719.
[5] Rajapakse, AD, Gole, AM, Wilson, PL. Approximate loss formulae for estimation of IGBT switching losses through EMTP type simulations. The International Conference on Power Systems Transients (IPST), 19-23 June 2005, Montreal, Canada, pp. 184.
[6] Dupé, V, Jammes, B, Séguier, L, Alonso, C. Accurate power loss model of a boost cell in a multiphase converter for phase management. 16th European Conference on Power Electronics and Applications, 26-28
August 2014, IEEE, Lappeenranta, Finland, pp. 1-9, DOI: 10.1109/EPE.2014.6910935.
[7] Dupé, V, Jammes, B, Alonso, C, Séguier, L. Behavioral modeling of power losses in FSBB converters, PCIM
Europe, May 2013, Nuremberg, Germany, pp. 1701-1706.
[8] Allard, B, Morel, H, Ammous, K, Xuefang, LS, Bergogne, D, Brevet, O. Application of averaged models to real-time monitoring of power converters. 32nd Annual Power Electronics Specialists Conference (IEEE Cat.
No.01CH37230), 17-21 June 2001, IEEE, Vancouver, Canada, pp. 486-491, DOI: 10.1109/PESC.2001.954161.
[9] Krismer, F, Kolar, JW. Accurate power loss model derivation of a high-current dual active bridge converter for an automotive application. IEEE Transactions on Industrial Electronics 2010, 57, 881-891 DOI: 10.1109/TIE.2009.2025284
[10] Eroğlu, Y, Ulusam Seçkiner, S. Early fault prediction of a wind turbine using a novel ANN training algorithm based on ant colony optimization. Journal of Energy Systems 2019, 3, 139-147. DOI: 10.30521/jes.613315 [11] Samadianfard, S, Jarhan, S, Sadri Nahand, H. Application of support vector regression integrated with firefly
optimization algorithm for predicting global solar radiation. Journal of Energy Systems 2018, 2, 180-189. DOI: 10.30521/jes.458328
[12] Bulut, EB, Cengiz, K. Determination the effects of duty cycle and switching frequency on efficiency of boost converter for fixed load applications. The Eurasia Proceedings of Science, Technology, Engineering &
Mathematics (EPSTEM) 2017, 1, 69-75 <https://dergipark.org.tr/tr/pub/epstem/issue/31865/ 364341>
[13] Kouro, S, Perez, M, Robles, H, Rodriguez, J. Switching loss analysis of modulation methods used in cascaded h-bridge multilevel converters. IEEE Power Electronics Specialists Conference, 15-19 June 2008, IEEE, Rhodes, Greece, pp. 4662-4668, DOI: 10.1109/PESC.2008.4592703.
[14] Balci, S, Kayabasi, A, Yildiz, B. Artificial neural network-based estimation of the output ripple of the DC-DC boost battery charger for EVs. 6th Eur. Conf. Ren. Energy Sys. 25-27 June 2018, Istanbul, Turkey. [15] Rashid, MH. Power Electronics Devices, Circuits, And Applications Fourth Edition. 2004, NJ, USA, Pearson
Education.
[16] M. F. Aslan, K. Sabanci, and A. Durdu. Different wheat species classifier application of ANN and ELM.
Journal of Multidisciplinary Engineering Science and Technology 2017, 4, 8194-8198.
[17] Haykin S. Neural networks: A Comprehensive Foundation, 1994, New York, USA, Macmillan College Publishing Company.
[18] Sabanci, K, Kayabasi, A, Toktas, A. Computer vision‐based method for classification of wheat grains using artificial neural network. Journal of the Science of Food and Agriculture 2017, 97, 2588-2593, DOI: 10.1002/jsfa.8080
[19] Kayabasi, A. An Application of ANN trained by ABC algorithm for classification of wheat grains.
International Journal of Intelligent Systems and Applications in Engineering 2018, 6, 85-91.
[20] Gupta, DK. A review on wireless sensor networks. Network and Complex Systems 2013, 3, 18-23.
[21] Kshirsagar, P, Rathod, N. Artificial neural network. International Journal of Computer Applications 2012, 2, 12-16.
[22] Bhatia, N, Vandana. Survey of nearest neighbor techniques. International Journal of Computer Science and
[23] Sabanci, K, Koklu, M. The classification of eye state by using kNN and MLP classification models according to the EEG signals. International Journal of Intelligent Systems and Applications in Engineering 2015, 3, 127-130, DOI: 10.18201/ijisae.75836.
[24] Ben-Hur, A, Weston, J. A user’s guide to support vector machines. Data mining techniques for the life
sciences 2010, 223-239, DOI: 10.1007/978-1-60327-241-4_13.
[25] Akar, Ö, Güngör, O. Classification of multispectral images using Random Forest algorithm. Journal of
Geodesy and Geoinformation 2012, 1,105-112, DOI: 10.9733/jgg.241212.1.
[26] Uestuen, B., Melssen, W.J., Buydens, L.M.C. Facilitating the application of Support Vector Regression by using a universal Pearson VII function-based kernel. Chemometrics and Intelligent Laboratory Systems 2006, 81, 29-40, DOI: 10.1016/j.chemolab.2005.09.003.