A
SIAN
J
OURNAL OF
C
HEMISTRY
A
SIAN
J
OURNAL OF
C
HEMISTRY
https://doi.org/10.14233/ajchem.2018.21236
INTRODUCTION
Spices are the store house of several elements over a large range of concentrations with significant positive or negative health effects. More than 20 elements have known physiolo-gical activities in humans and other mammals [1]. The metals vanadium, chromium, manganese, iron, cobalt, copper, zinc and molybdenum and the non-metals selenium, fluorine and iodine are trace elements that belong to the category of micro nutrients. This elements are required by the human body in small amounts (generally less than 100 mg/day). Other elements are considered to be macro nutrients, e.g. sodium, calcium, magnesium, potassium, chlorine, etc., which are needed in larger amounts. Some trace elements are necessary ingre-dients of biological structures, however they can also be toxic at concentrations beyond those essential for their biological functions. Examples of these metals contain cobalt, copper, chromium and nickel [2]. Other elements like arsenic, lead and cadmium have well known toxic roles in various bioche-mical reactions [1,2]. For example, at trace levels, nickel is useful for the activation of some enzyme systems but, its toxicity at higher levels is more important. Fortunately, nickel toxicity in humans is not a very widespread event because the absorption of nickel is very little [3]. Trace elements are often conjugated in biological systems or connect to smaller mole-cules, like phosphates, phytates, polyphenols and other chelating compounds. Most of the metals in metalloproteins have structural functions in enzymatic systems or they use the protein
Determination of Trace Element Contents of Some Spice Samples by Using FAAS
FEVZI KILIÇEL* and HACER SIBEL KARAPINAR
Department of Chemistry, Kamil Özdag Science Faculty, Karamanoglu Mehmetbey University, 70100 Karaman, Turkey *Corresponding author: E-mail: fevzi@kmu.edu.tr
Received: 18 January 2018; Accepted: 14 March 2018; Published online: 31 May 2018; AJC-18929
This study purposed to analyze the concentrations of 10 trace elements in aromatic spices (cinnamon, cumin, ginger, black pepper, red pepper and powdered pepper) by flame atomic absorption spectrometry (FAAS), after wet burning method. The analytical method was validated by linearity, detection limits, accuracy and recovery experiments values in all cases. The concentration of trace elements were measured in the range of 17.13–28.62, 3.09–8.57, 122.9–482.0, 492–999 and 28490–69630 mg kg-1 in order of zinc, copper, manganese,
magnesium and calcium ions. As the toxic elemental contents were measured in the range of 1.61–14.06, 16.83–23.43, 27.03–56.07, 6.15–15.79 and 702–991 mg kg-1
in order of cobalt, lead, nickel, chromium and iron. The results were compared with the literature values. Pb, Ni, Fe and Cr elements are above the permissible limits and other elements are found to be at standard levels.
Keywords: Spice samples, Trace elements, Flame atomic absorption spectrometry, Method validation, Turkey. Asian Journal of Chemistry; Vol. 30, No. 7 (2018), 1551-1558
to go to the targeted region in the organism [2]. For example, copper and zinc are used as activating agents for biochemical reactions and are components of some enzyme/substrate metal complexes [4]. Many spices are extensively used in Turkey and around the world in daily diet. Some of the benefits of these products are known as dementia fighting power (cumin), obesity and sugar regulating (cinnamon) and anticancer proper-ties (turmeric). A lot of work has been done on the biological-activities and organic components of the aromatic spices, however less attention has been paid towards their minor and trace element contents. In view of the fact that these spices are being consumed in meals and as a supplement to give fla-vour in medical daily diets or as food. Identifying minor and trace element components of these spices is crucial for a clear understanding of the effects on human health [1]. Different techniques are used in determining minor and trace elements in the world, namely: differential pulse anodic stripping volta-mmetric technique [5], stripping potentiometry [6], capillary zone electrophoresis [7], instrumental neutron activation analysis [8], atomic fluorescence spectrometry [9], flow injection spec-trometric methods [10], inductively coupled plasma emission spectroscopy [11], flame atomic absorption spectrometry [12], inductively coupled plasma optical emission spectrometry [13] and inductively coupled plasma mass spectrometry [14-17]. Flame atomic absorption spectrometry (FAAS) is a technique used for the detection of heavy metal ions at trace levels in environmental solid and liquid samples. It is also widely pre-ferred because of its selectivity, low cost and easy tool handling
[18]. Even so, the analyte ions are at lower levels than the detection limits of FAAS and the high interference effects of ions on the analytes signal limit the determination of heavy metal ions by Gonzalvez et al. [19]. Therefore the aim of this study was to determine the concentrations of 10 minor and trace elements namely Co, Ni, Cr, Cu, Zn, Pb, Mn, Mg, Fe and Ca in six aromatic spices. The FAAS technique was used, because of its sensitivity, selectivity, trace levels and the ability to perform multi-element analysis. The critical levels specified by WHO and TGK were used to compare allowable maximum tolerable intakes of toxic trace elements.
EXPERIMENTAL
Red pepper, black pepper, powdered pepper, cumin, cinnamon and ginger samples were bought from market places at Karaman in Turkey. These were consisted of 16 samples from each of 6 selected spice samples as mentioned in Table-1. A total of 96 samples of spices were analyzed for their heavy metal contents. The samples were gathered in the summer and winter months and brought to the laboratory where they were packed. The region of the study were chosen from different potential pollution sources and unpolluted areas.
Sample preparation: All the samples were dried at 80 °C in oven until constant weight was achieved. These were homo-genized in a blender (SS115, Warning, USA) and properly labeled. Spices samples were prepared for element analysis by the wet burning method [20,21]. Powdered spice samples (1 g) were put in 50 mL beakers and 15 mL of HNO3 (65 %)
(w/w) were added. After 8-10 h, 4 mL HClO4 (70-72 %) (w/w)
was added and heated gently for about 5-6 h and cooled. Then 5 mL of H2O2 (30 %) (w/w) was added and heated till the
solution is colourless enough. The solution was cooled and distilled water was added in it until the total volume reaches to 15 mL.
A Perkin Elmer Model AAnalyst Pinaccle 900T atomic absorption spectrophotometer accoutred with deuterium back ground correcting and air-acetylene burner was used for Co, Ni, Cr, Cu, Zn, Pb, Mn, Mg, Fe and Ca measurements in standard and sample solutions. All elements hollow cathode lamps were used as radiation source. The most precision wavelengths (nm) and lamp currents (mA) used for the specification of the analytes were as follows: Co 240.7 and 30, Ni 232.0 and 25, Cr 357.9 and 25, Cu 324.8 and 15, Zn 213.9 and 15, Pb 217.0 and 440, Mn 279.5 and 20, Mg 285.2 and 20, Fe 248.0 and 30, Ca 422.7 and 20, respectively. The slit widths of Fe, Mn, Ni, Co elements are 0.2 nm and 0.7 nm for Cu, Zn, Ca, Cr, Mg and Pb elements. The absorbance measurements of all the elements
were performed using an air/acetylene flame with a flow of 2.1-2.3 L min-1. The nebulizer flow ratio and the burner height
were set for obtain the maximum absorbance signal by aspirating asolution including the analyte in 0.05 mol L–1 nitric
acid.
Analytical reagent-grade chemicals were employed in the preparation of all solutions. Doubly distilled deionized water (Milli-Q Millipore 18,2 MΩ cm–1) was used in all experiments.
The HClO4, HNO3 and H2O2 were of suprapure quality (Merck,
Darmstadt, Germany). All the plastic and glassware were cleaned by soaking in dilute nitric acid and were rinsed with distilled water priorto use. The standard solutions of investi-gated analytes for calibration procedure were produced by diluting a stock solution of 1000 mg L–1 of the investigated
element supplied by Merck. The plastic/glass containers were soaked in 10 % (w/w) HNO3 for at least 24 h and then rinsed
extensively with Milli-Q water prior to use. All the containers
i.e., polypropylene flasks, pipette tips and reagents that came
into contact with samples or standards were checked for conta-mination. The Standard Reference Material (NIST), spinach leaves, was obtained from National Institute of Standards and Technology, Gaithersburg MD, USA.
Calibration procedure: The external calibration tech-nique was followed for the quantitative analysis of the samples. Standard solutions were prepared in 19.6 % (w/w) HNO3 by
diluting a multi-element standard solution containing all the analyte elements. The calibration curves for all the analytes were built on 5 different concentrations of all analytes in the samples were within linear range of calibration curve. The calibration standards were analyzed at regular intervals during analysis as samples to monitor the instrument drift. Also ultra pure deionized water blanks were frequently analyzed along side samples to check for any loss or cross contamination. Any slight instrumental drift was taken into account to avoid any possible error. All the measurements were carried out using the full quantitative analysis mode.
Method validation: The analytical characteristic of the proposed method were obtained for the ten elements studied under the optimized conditions. Table-2 presents the linear ranges used for calibration and the coefficients of determination (R2) used to assess the linearity (R2 > 0.99). The limits of
detec-tion (LOD) and limits of quantificadetec-tion (LOQ) for each metal were determined as follows: 10 independent analyses of a blank solution spiked with the metal at a lower level of concentration of the analytical curve were performed. The LOD and LOQ were calculated from the standard deviation (σ) and the slope (m) of these determinations (LOD = 3 σ/m and LOQ = 10 σ/m).
TABLE-1
LIST OF AROMATIC SPICES STUDIED
No. English name Botanical name Family Part investigated
1 Cinnamon Cinnamomum verum Lauraceae Bark
2 Cumin Cuminum cyminum Apiaceae Fruits
3 Ginger Zingiber officinale Zingiberaceae Fruits
4 Chili (red pepper) Capsicum annuum L. Solanaceae Fruits
5 Chili (powdered pepper) Capsicum annuum L. Solanaceae Fruits
RESULTS AND DISCUSSION
The average results (concentration ± SD) of selected 10 minor and trace elements obtained for 6 analyzed spice samples using FAAS were reported on dry weight basis. Table-2 enlisted analytical method validation parameters including linear range, regression, correlation coefficient, LOD, LOQ and precision. Table-3 give analysis of SRM (NIST), for Cu, Cr, Fe, Ca, Ni, Mg, Mn, Zn, Pb and Co. Tables 4-9 give concentration (mg kg–1
) (average ± SD) of analyzed 10 trace elements in cinnamon, cumin, ginger, red pepper, powdered pepper, black pepper by FAAS, respectively (Fig. 1) average trace element (Cu, Co, Cr, Pb, Zn, Ni) contents of spices samples (mg kg–1
). Fig. 2 showed the average trace element (Mn, Mg, Fe) contents of spices samples (mg kg–1
). Fig. 3 depicts the average trace element (Ca) content of spices samples (mg kg–1
).
Toxic and non-toxic metals may occur due to contami-nated soil and water, planting, growth and manufacturing pro-cesses in plant products. As toxic materials are probably to be present in many foods for their abundance in nature, the addition of vegetable products contaminated with metals also increases the total concentration of toxic metals consumed by humans [22]. The maximum amounts for toxic metals set by countries in different areas of the world have been published
TABLE-3
ANALYSIS OF CERTIFIED REFERENCE MATERIAL (NIST), BLANK (n = 3) Element Certified (mg kg–1 ) Found (mg kg–1 ) Recovery (%) CRM NIST No. Cu 2 ± 0.4 2.14a ± 0.01b 107.0 SRM 3114 Cr 2 ± 0.4 2.11 ± 0.02 105.5 SRM 3112a Fe 2 ± 0.4 2.11 ± 0.02 105.5 SRM 3126a Ca 10 ± 2 9.86 ± 0.01 98.6 SRM 3109a Ni 5 ± 1 4.03 ± 0.01 80.6 SRM 3136 Mg 1 ± 0.2 0.98 ± 0.01 98.0 SRM 3131a Mn 1 ± 0.2 0.99 ± 0.01 99.0 SRM 3132 Zn 1.8 ± 0.4 1.83 ± 0.07 101.6 SRM 3168a Pb 20 ± 4 20.4 ± 0.14 102.0 SRM 3128 Co 2* 1.97 ± 0.01 98.5 –
*Value is not certified value.
a
Average concentration of thirty replicate measurements.
bStandard deviation (n = 30).
by the World Health Organization (WHO) in 2007. The limit of 10 mg kg–1 in raw herbal products and 0.02 mg day–1 in
finished herbal products was determined for Pb. For chromium, the limit in crude herbal produce was 2 mg kg–1; but, the limit
in worked herbal produce is the same with lead, 0.02 mg day–1.
In spite of limits for toxic metals in plant products and drugs are generally determined for each element, some countries
TABLE-2
LINEAR RANGE, REGRESSION, CORRELATION COEFFICIENT (R2), LOD,
LOQ AND PRECISION (RSD %) FOR THE ELEMENTS ANALYZED
Element Linear range (mg kg–1) Regression R2 LOD (mg kg–1) LOQ (mg kg–1) Precision (RSD %)
Cu 1-10 y = 0.040x + 0.001 0.993 1.526 5.085 0.584 Cr 1-10 y = 0.012x – 0.002 0.996 2.497 8.324 0.715 Fe 1-10 y = 0.051x – 0.025 0.996 1.441 4.803 0.740 Ca 0.1-5 y = 16.10x – 0.108 0.999 0.053 0.158 0.117 Ni 1-10 y = 0.029x – 0.013 0.999 2.225 7.417 0.206 Mg 0.1-5 y = 2.106x – 0.106 1.000 0.108 0.360 0.727 Mn 0.1-5 y = 0.063x + 0.009 0.999 1.186 3.952 0.872 Zn 0.1-5 y = 0.137x + 0.002 0.993 0.784 2.612 0.355 Pb 1-10 y = 0.124x – 0.052 0.999 1.490 4.967 0.701 Co 0.1-5 y = 0.287x + 0.075 0.999 0.624 2.080 0.558 TABLE-4
AMOUNTS OF TRACE ELEMENTS DETECTED IN CINNAMON SAMPLES BY FAAS ANALYZED METAL CONTENTS [(mg kg–1), n = 3]
Cinnamon No. Co Ni Cr Cu Zn Pb Mn Mg Fe Ca 1 12.95 31.04 13.99 4.58 16.95 21.53 210.1 651 821 58920 2 13.19 30.84 14.03 4.53 18.68 21.51 211.8 661 819 52220 3 12.38 30.52 14.32 4.09 18.29 19.58 195.2 650 833 57120 4 12.65 31.43 13.68 4.52 18.44 20.58 196.2 636 818 57100 5 11.79 31.08 13.96 4.87 15.52 18.12 125.3 653 760 56980 6 11.89 32.13 14.07 4.65 16.06 18.34 122.9 667 793 57080 7 11.69 32.17 14.03 4.98 16.86 18.96 141.8 728 761 52500 Winter 8 11.77 31.89 15.19 4.67 17.19 19.60 142.6 738 779 53700 9 10.29 30.98 14.56 4.65 17.53 18.00 187.5 650 807 49500 10 10.35 32.12 14.57 4.86 17.91 18.30 184.3 658 826 50700 11 11.85 31.56 13.98 6.87 16.84 19.15 186.9 662 884 48560 12 12.07 31.66 13.97 7.11 15.68 19.37 192.8 666 839 49640 13 11.89 31.65 15.16 5.59 17.35 21.04 172.8 636 825 44650 14 11.67 31.81 15.15 5.71 16.53 21.88 174.8 648 833 45770 15 11.76 29.42 12.77 4.77 17.23 19.87 142.9 699 888 45880 Summer 16 11.56 32.33 13.72 4.97 16.95 20.03 152.9 613 873 45400 Average ± SD 11.86 ± 0.787 31.41 ± 0.430 14.22 ± 0.564 5.086 ± 0.861 17.13 ± 0.840 19.74 ± 1.284 171.3 ± 30.14 663.5 ± 29.10 822.4 ± 37.26 50920 ± 4637
TABLE-5
AMOUNTS OF TRACE ELEMENTS DETECTED IN CUMIN SAMPLES BY FAAS ANALYZED METAL CONTENTS [(mg kg–1), n = 3]
Cumin No. Co Ni Cr Cu Zn Pb Mn Mg Fe Ca 1 11.60 32.19 7.15 5.35 25.18 17.57 391.6 568 920 31930 2 11.90 32.31 7.24 5.47 25.99 17.04 416.8 588 899 31560 3 12.48 34.28 7.29 5.43 25.79 16.83 413.2 688 967 28490 4 12.66 34.55 7.91 5.23 25.23 19.46 412.3 686 978 28580 5 12.04 33.14 7.72 4.42 22.58 18.86 321.9 577 914 36270 6 12.22 33.37 7.94 4.63 23.78 19.99 333.7 572 949 35280 7 11.17 32.43 7.15 4.05 22.81 18.93 332.0 536 852 35500 Winter 8 12.20 33.14 7.67 4.13 23.02 19.64 333.7 533 868 33990 9 13.88 34.63 7.53 4.23 23.23 18.72 454.3 669 988 29840 10 14.06 34.90 7.82 4.27 24.53 17.23 445.6 670 977 30640 11 12.25 31.05 7.07 4.78 22.23 18.14 465.8 521 951 31200 12 12.82 32.24 7.31 4.67 22.45 18.39 482.0 525 933 31520 13 12.22 31.32 7.65 4.23 23.45 19.49 434.5 530 922 33910 14 12.09 31.55 7.56 4.53 23.78 19.88 435.6 527 925 33910 15 11.21 32.34 7.45 4.65 22.30 19.45 437.8 510 923 34910 Summer 16 13.41 34.25 7.54 4.75 24.29 19.48 438.7 509 925 34700 Average ± SD 12.39 ± 0.717 32.98 ± 1.204 7.499 ± 0.227 4.675 ± 0.479 23.73 ± 1.076 18.69 ± 0.875 409.6 ± 52.80 575.6 ± 67.65 930.6 ± 37.79 32639 ± 2555 TABLE-6
AMOUNTS OF TRACE ELEMENTS DETECTED IN GINGER SAMPLES BY FAAS ANALYZED METAL CONTENTS [(mg kg–1
), n = 3] Ginger No. Co Ni Cr Cu Zn Pb Mn Mg Fe Ca 1 12.28 36.75 15.11 5.79 18.95 20.14 234.2 819 744 65320 2 12.86 34.56 15.21 5.96 19.01 21.51 236.0 807 748 69000 3 12.38 35.66 15.79 5.32 18.89 20.61 233.4 814 813 66050 4 13.25 35.47 15.23 5.59 20.02 20.51 236.8 810 815 66960 5 12.43 36.65 12.29 6.58 18.56 20.41 203.8 808 704 64020 6 12.29 36.35 12.33 7.18 18.76 19.34 224.9 809 726 64190 7 12.25 35.60 10.98 7.26 18.65 17.26 278.3 832 782 69630 Winter 8 12.42 37.25 13.11 7.42 18.45 19.72 206.0 841 709 68750 9 12.41 37.82 11.23 4.63 16.20 20.41 258.6 831 791 62970 10 12.46 34.34 11.29 5.96 18.15 20.24 258.2 826 782 61420 11 11.77 36.52 11.54 3.75 17.38 21.09 265.4 822 727 61630 12 12.81 32.23 11.53 5.44 18.64 21.72 271.1 827 715 61490 13 12.72 34.77 11.56 5.55 17.90 22.30 234.8 818 769 60950 14 12.63 36.63 11.23 5.45 17.60 22.95 240.0 817 765 61640 15 12.23 36.53 12.01 6.01 18.01 22.35 228.6 808 785 62750 Summer 16 13.08 36.86 12.11 6.34 17.99 23.43 230.5 812 794 62260 Average ± SD 12.52 ± 0.188 35.87 ± 0.742 12.66 ± 1.693 5.886 ± 0.891 18.32 ± 0.732 20.87 ± 1.439 240.0 ± 16.77 818.9 ± 10.13 760.5 ± 34.85 64313 ± 2957 TABLE-7
AMOUNTS OF TRACE ELEMENTS DETECTED IN RED PEPPER SAMPLES BY FAAS ANALYZED METAL CONTENTS [(mg kg–1
), n = 3]
Red pepper No. Co Ni Cr Cu Zn Pb Mn Mg Fe Ca
1 11.68 32.36 8.18 4.79 17.56 20.45 369.0 654 912 33360 2 11.90 34.11 8.02 6.41 17.43 19.01 379.7 660 912 32780 3 11.69 34.88 8.01 6.62 17.41 19.64 377.5 694 999 35430 4 12.49 35.53 8.99 6.73 17.57 19.90 395.0 696 998 34780 5 11.81 35.47 6.15 4.15 16.73 20.61 235.4 730 702 30620 6 11.93 32.31 6.62 4.49 17.77 19.92 237.5 737 901 39440 7 10.93 32.81 6.58 4.15 17.84 20.64 212.2 809 841 32890 Winter 8 11.82 32.52 7.19 4.16 18.40 19.95 221.3 808 802 33150 9 12.31 35.15 7.23 5.77 17.89 20.36 222.3 657 905 35060 10 11.12 35.51 7.50 7.27 17.67 21.02 234.3 656 908 34660 11 11.32 36.32 7.65 6.54 18.90 21.28 253.4 727 900 39880 12 12.66 36.91 7.52 6.72 17.91 18.01 236.5 733 966 39300 13 12.78 34.56 7.89 3.29 16.59 19.89 312.6 894 874 36470 14 12.56 34.65 8.97 3.17 16.82 19.47 326.7 915 873 37020 15 12.01 35.76 7.98 3.30 16.57 19.18 305.4 908 912 36150 Summer 16 12.34 35.78 7.64 3.40 17.77 18.90 326.8 907 940 37860 Average ± SD 11.96 ± 0.381 34.41 ± 1.651 7.633 ± 0.738 5.061 ± 1.472 17.55 ± 0.543 19.83 ± 0.565 290.3 ± 67.65 761.5 ± 101.2 896.3 ± 63.92 34928 ± 2939
40 35 30 25 20 15 10 5 0 A v e rag e t rac e el e m e n t c o nc en tr a ti o n Cumin Black pepper Powdered pepper Ginger Red pepper Cinnamon Cu Co Cr Pb Zn Ni
Fig. 1. Average trace element (Cu, Co, Cr, Pb, Zn, Ni) contents of spice samples (mg kg–1
)
TABLE-8
AMOUNTS OF TRACE ELEMENTS DETECTED IN POWDERED PEPPER SAMPLES BY FAAS ANALYZED METAL CONTENTS [(mg kg–1
), n = 3]
Powdered pepper No. Co Ni Cr Cu Zn Pb Mn Mg Fe Ca
1 10.41 27.03 12.59 5.14 23.45 19.50 198.7 869 848 49990 2 10.92 30.17 13.56 5.26 23.48 19.48 201.0 873 853 51850 3 10.57 29.04 13.67 5.24 24.56 20.00 224.9 835 843 54850 4 11.05 28.26 13.89 5.29 24.35 20.12 224.7 849 844 55190 5 11.21 50.03 13.37 8.47 24.12 21.28 229.1 838 821 53500 6 11.57 51.49 13.42 8.55 25.56 21.48 229.6 844 829 57740 7 10.89 51.23 12.88 8.57 25.36 21.30 243.1 899 766 51370 Winter 8 11.11 56.07 13.72 8.13 25.88 21.50 242.2 819 758 52530 9 11.21 41.23 14.75 7.38 22.41 18.57 230.3 820 735 52550 10 11.17 46.75 15.16 7.41 24.14 20.77 232.4 816 732 55290 11 10.98 42.33 13.11 7.06 22.52 19.52 219.8 838 841 54000 12 11.04 44.19 14.21 7.53 23.35 19.74 223.7 842 833 54880 13 13.97 33.85 10.83 7.02 22.55 18.59 229.6 856 743 51500 14 14.05 34.07 11.18 7.33 22.56 19.91 230.5 868 747 53360 15 11.57 33.98 11.55 6.73 21.05 18.99 231.2 861 753 51150 Summer 16 14.05 34.14 12.33 7.31 22.88 19.79 230.3 865 755 51390 Average ± SD 11.61 ± 1.177 32.29 ± 1.368 13.14 ± 1.199 7.026 ± 1.231 23.64 ± 1.236 20.03 ± 0.870 226.3 ± 12.30 849.5 ± 17.33 793.8 ± 49.58 53196 ± 1785 TABLE-9
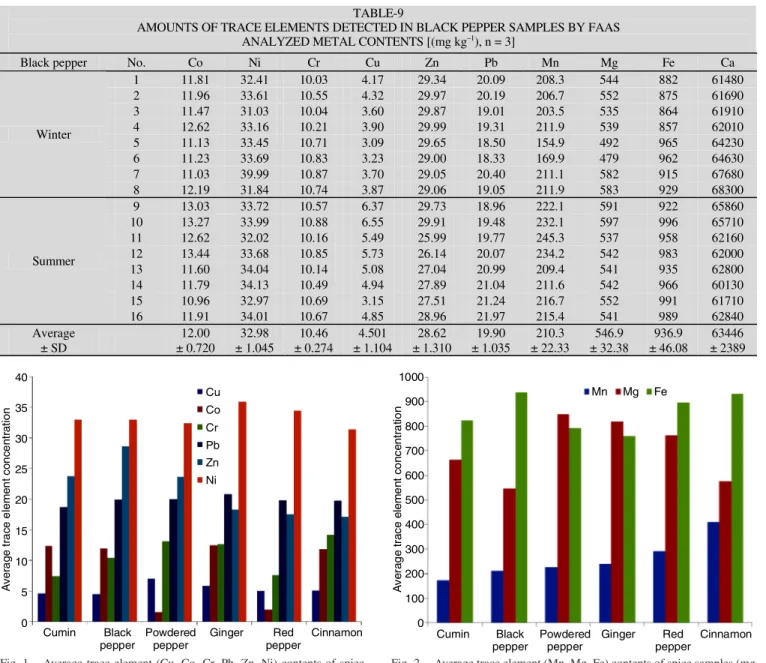
AMOUNTS OF TRACE ELEMENTS DETECTED IN BLACK PEPPER SAMPLES BY FAAS ANALYZED METAL CONTENTS [(mg kg–1), n = 3]
Black pepper No. Co Ni Cr Cu Zn Pb Mn Mg Fe Ca
1 11.81 32.41 10.03 4.17 29.34 20.09 208.3 544 882 61480 2 11.96 33.61 10.55 4.32 29.97 20.19 206.7 552 875 61690 3 11.47 31.03 10.04 3.60 29.87 19.01 203.5 535 864 61910 4 12.62 33.16 10.21 3.90 29.99 19.31 211.9 539 857 62010 5 11.13 33.45 10.71 3.09 29.65 18.50 154.9 492 965 64230 6 11.23 33.69 10.83 3.23 29.00 18.33 169.9 479 962 64630 7 11.03 39.99 10.87 3.70 29.05 20.40 211.1 582 915 67680 Winter 8 12.19 31.84 10.74 3.87 29.06 19.05 211.9 583 929 68300 9 13.03 33.72 10.57 6.37 29.73 18.96 222.1 591 922 65860 10 13.27 33.99 10.88 6.55 29.91 19.48 232.1 597 996 65710 11 12.62 32.02 10.16 5.49 25.99 19.77 245.3 537 958 62160 12 13.44 33.68 10.85 5.73 26.14 20.07 234.2 542 983 62000 13 11.60 34.04 10.14 5.08 27.04 20.99 209.4 541 935 62800 14 11.79 34.13 10.49 4.94 27.89 21.04 211.6 542 966 60130 15 10.96 32.97 10.69 3.15 27.51 21.24 216.7 552 991 61710 Summer 16 11.91 34.01 10.67 4.85 28.96 21.97 215.4 541 989 62840 Average ± SD 12.00 ± 0.720 32.98 ± 1.045 10.46 ± 0.274 4.501 ± 1.104 28.62 ± 1.310 19.90 ± 1.035 210.3 ± 22.33 546.9 ± 32.38 936.9 ± 46.08 63446 ± 2389 1000 900 800 700 600 500 400 300 200 100 0 A v er ag e t rac e el e m e n t c o nc en tr a ti o n Cumin Black pepper Powdered pepper Ginger Red pepper Cinnamon Mn Mg Fe
Fig. 2. Average trace element (Mn, Mg, Fe) contents of spice samples (mg kg–1
70000 60000 50000 40000 30000 20000 10000 0 A v e ra g e t ra c e ele m e n t c o nc en tr at io n Cumin Black pepper Powdered pepper Ginger Red pepper Cinnamon
Fig. 3. Average trace element (Ca) content of spice samples (mg kg–1)
such as China and the Republic of Korea have identified a total toxic metal limit of 20-30 mg kg-1
[22].
Copper is an essential element for the functioning of many significant enzyme systems. A copper level of 2 mg L–1
in drinking water should not cause any adverse effects and provides an enough margin of security [23]. Copper was identified in all analyzed spice samples and was in the range of 3.09-8.57 mg kg–1
. The maximum Cu concentrations were found in the pow-dered pepper samples, no. 7 (8.57 mg kg–1
) and the minimum Cu concentrations were found in the black pepper samples, no. 5 (3.09 mg kg–1
).
The richest food sources of cobalt are green vegetables and fresh grains (0.2–0.6 mg kg–1
dry mass) [24]. Tobacco includes cobalt at weight, < 0.3–2.3 mg kg–1
dry and 0.5 % of the Co is present in main smoke [25,26]. In the present study, the highest concentration of Co was detected in the cumin samples, no. 10 (14.06 mg kg–1
). The average Co concentration was found in all samples in the range of 1.61–14.06 mg kg–1
. Zinc is an necesssary element for human health. It has been known as a co-factor of the superoxide dismutase enzyme, which is involved in protection against oxidative processes [27]. The average concentration of Zn in spice samples were found in the range of 17.13–28.62 mg kg-1
. The research showed that spices are a rich source of Zn, an element which helps many enzymatic reactions in the human body. Sattar et al. [28] reported that the lowest and highest amounts of Zn were detected as 64.2 and 65.8 µg g–1
in spices and dry fruits from Pakistan, respectively. Alam et al. [27] reported that the average weekly intake of Zn(II) ion from Samta vegetables is estimated to be 25 mg. The maximum level of zinc ion permitted for food is 5 mg kg–1
by Turkish Food Codex [29]. The maximum allowable daily intake of Zn is 0.3–1.0 mg kg–1
[30]. Our amounts for Zn in the spice samples worked were above the WHO values.
Lead is like to be Cd, Hg, As that does not have a useful role because it produces toxicity in human metabolism. Exposure to lead is worrying due to possible harmful effects on intelligence [27]. People may be exposed to lead element through air, water and food. Lead is accumulating in bones and it can take in place of calcium. Lead constitues health problems like sleeplessness, tiredness, hear and weight loss. WHO has established a temporary permissible weekly intake
for lead of 0.025 mg kg–1 of body weight [31]. Lead was found
in all spice samples and concentrations ranged from 16.83 to 23.43 mg kg–1. The WHO detected Pb concentration limit in
herbal products as 10 mg kg–1 [32]. In the present study, all
lead contents were above this limit.
According to WHO, nickel compounds are a health risk for humans. Because nickel compounds cause cancers in humans and metallic nickel is possibly carcinogenic [33]. The range of nickel concentrations in analyzed spice samples were 27.03–56.07 mg kg–1. We acquired the highest content of nickel
in the powdered pepper samples, no. 8.
Manganese is one of the vital significant elements. Manga-nese is found in the structure of some enzymes and plays an active role in some enzymes. The range of manganese concen-trations in analyzed spice samples were 122.9–482.0 mg kg–1.
Barnes reported that the average concentration of Mn in apricot of USA, 0.273 mg kg–1 [34]. The levels of Mn in our samples
are higher than in apricots of USA. The Institute of Medicine suggests that intake of manganese from food. The amount of Mn taken with water and diet during the day should not exceed 11 mg [35]. The US National Academy of Sciences suggested 2.5-5.0 mg per day manganese [36] and the WHO (World Health Organization) suggested 2-9 mg per day for an adult [37].
The minimum and maximum amounts of iron in spice samples were found as 702 mg kg-1 (red pepper, no. 5) and
991 mg kg-1 (black pepper, no. 15), respectively. Spice was
also well resources of Fe. The concentrations of Fe in different spices, dry fruits and plant nuts commonly ingested in Pakistan were determined in the range of 142–285 µg g–1 [28]. Ghaedi
et al. [38] reported that the level of Fe(III) ion was detected as 0.568 µg g–1 in orange juice of Iran. The amount of iron
in spice samples from Turkey is higher than Fe contents in apricot of Pakistan and in orange juice of Iran. The highest iron ion level allowed for food is 15 mg kg–1 according
to Turkish Food Codex [29]. Iron ion levels in the most of analyzed spice samples were detected to be higher than legal limits.
The average range of calcium concentration is 28490 mg kg–1 (cumin, no. 3) to 69630 mg kg–1 (ginger, no. 7). These values
were found to be above the permissible normal concentration. Looking at the Mg concentration in the 96 spice samples, the lowest value of magnesium was 492 mg kg–1 in the black
pepper samples no. 1, whereas the highest level was 999 mg kg–1 in red pepper samples no. 3.
Chromium is significant for glucose toleration in human body. Chromium together with insulin facilitates the ingestion of glucose into the cells. In persons with disrupted glucose tolerance, like those with diabetes, hypoglycemia and obesity, supplementation with chromium is of exceptional importance. When the chromium diminishes, the sugar levels on the side are increased because the effect of insulin is blocked. Thus glucose can not be transported to the cell for energy production [39]. Chromium was found in all spice samples and concen-trations ranged from 6.15 mg kg–1 (red pepper, no. 5) to 15.79
mg kg–1 (ginger, no. 3). Reported Cr values for apricot samples
in the literature (6.43 and 3.23 mg kg–1) [40] are higher than
Metal pollution index: Metal pollution index (MPI) was calculated for spice samples analyzed. This calculation was done to examine all metal concentrations. Metal pollution index was obtained by calculating the geometrical mean of concen-trations of all the metals in the samples with the equation:
Metal pollution index = (Cf1 × Cf2… Cfn)1/n
where Cfn = concentration of the metal n in the sample [41]. In our study, metal pollution index ranged from 20.57 to 23.28. For calculate the metal pollution index of the spices, the average concentration amounts of the chosen metals (Ni, Co, Zn, Pb, Mn, Cu, Cr) have been taken into account. The highest metal pollution index value in the spices was observed for the powdered pepper (23.3) and the lowest for the cinnamon (20.6) (Fig. 4). The metal pollution index values of our study were found to be higher than Richeir and Gobert [42] and Richer et al. [43] studies.
23.5 23.0 22.5 22.0 21.5 21.0 20.5 20.0 19.5 19.0 M e ta l p o llu ti o n in d e x v a lu e s Cumin Black pepper Powdered pepper Ginger Red pepper Cinnamon
Fig. 4. Metal pollution index for spice samples (mg kg–1)
Conclusion
In this study, the analytical approach to the research of ten trace metals in the spice samples. In addition, each sample was analyzed by FAAS to detect heavy metal ingredients. Ninety-six spice samples, collected from market places in Karaman, Turkey, were determined by using FAAS after wet burning method. FAAS determines quantities of trace elements in plants. Local, spices are in general a well dietary source, particularly in macro and micro-nutrients. It is thought that the sources of the trace elements in the spices are caused by soil, fertilizer, water or environmental metal pollution. Further-more, in terms of plant features, differences in the geographic area, genetics and compound of the soil can influence the level of trace metals. In present case, trace element contents in the analyzed samples were probably to be of remissible anxiety. The concentrations of minor and trace elements were mostly variable, largely dependent upon the type of spices analyzed, in accordance to the published literatures. Each spice was found to be the rich source of at least one or more nutritionally essen-tial trace elements (Zn, Cu Cr) or probable essenessen-tial trace elements (Mn, Ni, Co) specified by WHO. The levels of toxic heavy metals were in accordance to the published literatures around the world on spices and within the critical limits specified by FAO/WHO, Food and Nutrition Board, Turkish Food Codex. Especially in the spices analyzed, the presence of toxic trace elements such as Cr, Pb, Ni and Fe may have a high contribution to total metal uptake. This situation could
pose a threat to the consuming population. Cu, Zn, Co, Mg, Ca and Mn TGK was found to be within the permissible limits [44].
ACKNOWLEDGEMENTS
The authors are grateful for the financial support of the Scientific Research Project of Karamanoglu Mehmetbey University (Project Number: 27-M-15/2017).
REFERENCES
1. C. Karadas and D. Kara, Food Chem., 130, 196 (2012); https://doi.org/10.1016/j.foodchem.2011.07.006. 2. C.G. Fraga, Mol. Aspects Med., 26, 235 (2005);
https://doi.org/10.1016/j.mam.2005.07.013.
3. P.C. Onianwa, J.A. Lawal, A.A. Ogunkeye and B.M. Orejimi, J. Food
Compos. Anal., 13, 961 (2000);
https://doi.org/10.1006/jfca.2000.0944. 4. A.S. Mildvan, Enzymes, 2, 445 (1970);
https://doi.org/10.1016/S1874-6047(08)60188-2.
5. R.M. Tripathi, R. Raghunath, V.N. Sastry and T.M. Krishnamoorthy,
Sci. Total Environ., 227, 229 (1999);
https://doi.org/10.1016/S0048-9697(99)00018-2. 6. E. Muñoz and S. Palmero, Food Control, 15, 635 (2004);
https://doi.org/10.1016/j.foodcont.2003.10.006.
7. S. Suárez-Luque, I. Mato, J.F. Huidobro and J. Simal-Lozano, Int. Dairy
J., 17, 896 (2007);
https://doi.org/10.1016/j.idairyj.2006.12.004. 8. V. Singh and A.N. Garg, Food Chem., 94, 81 (2006);
https://doi.org/10.1016/j.foodchem.2004.10.053.
9. P. Cava-Montesinos, E. Ródenas-Torralba, Á. Morales-Rubio, M. Luisa Cervera and M. de la Guardia, Anal. Chim. Acta, 506, 145 (2004); https://doi.org/10.1016/j.aca.2003.11.023.
10. N. Khan, J.Y. Choi, E.Y. Nho, N. Jamila, G. Habte, J.H. Hong, I.M. Hwang and K.S. Kim, Food Chem., 158, 200 (2014);
https://doi.org/10.1016/j.foodchem.2014.02.103. 11. Y.W. Park, Small Rumin. Res., 37, 115 (2000);
https://doi.org/10.1016/S0921-4488(99)00144-3.
12. E. Kondyli, M.C. Katsiari and L.P. Voutsinas, Food Chem., 100, 226 (2007); https://doi.org/10.1016/j.foodchem.2005.09.038.
13. C.S. Kira and V.A. Maihara, Food Chem., 100, 390 (2007); https://doi.org/10.1016/j.foodchem.2005.09.014.
14. M. Chudzinska and D. Baralkiewicz, Food Chem. Toxicol., 49, 2741 (2011); https://doi.org/10.1016/j.fct.2011.08.014.
15. N. Khan, I.S. Jeong, I.M. Hwang, J.S. Kim, S.H. Choi, E.Y. Nho, J.Y. Choi, B.-M. Kwak, J.-H. Ahn, T. Yoon and K.S. Kim, Food Chem.,
141, 3566 (2013);
https://doi.org/10.1016/j.foodchem.2013.06.034.
16. N. Khan, I.S. Jeong, I.M. Hwang, J.S. Kim, S.H. Choi, E.Y. Nho, J.Y. Choi, K.S. Park and K.S. Kim, Food Chem., 147, 220 (2014); https://doi.org/10.1016/j.foodchem.2013.09.147.
17. E.J. Llorent-Martínez, M.F. De Córdova, A. Ruiz-Medina and P. Ortega-Barrales, Microchem. J., 102, 23 (2012);
https://doi.org/10.1016/j.microc.2011.11.004. 18. K. Srogi, Anal. Lett., 41, 677 (2008);
https://doi.org/10.1080/00032710801934445.
19. A. Gonzalvez, S. Armenta, M.L. Cervera and M. De La Guardia,
Talanta, 74, 1085 (2008);
https://doi.org/10.1016/j.talanta.2007.09.039.
20. J. Khairiah, M.K. Zalifah, Y.H. Yin and A. Aminah, Pak. J. Biol. Sci.,
7, 1438 (2004);
https://doi.org/10.3923/pjbs.2004.1438.1442.
21. B. Kacar, Plant Nutrition Practice Guide, Ankara Univ. Agricultural Fac. Publ.: 900, Practice Guides, p. 214 (1984).
22. World Health Organization, Quality Assurance of Pharmaceuticals: A Compendium of Guidelines and Related Materials, Good Manufacturing Practices and Inspection, World Health Organization, vol. 2 (2007) 23. M. Behbahani, M. Salarian, M.M. Amini, O. Sadeghi, A. Bagheri and
S. Bagheri, Food Anal. Methods, 6, 1320 (2013); https://doi.org/10.1007/s12161-012-9545-9.
24. IARC Working Group on the Evaluation of Carcinogenic Risks to Humans, & International Agency for Research on Cancer, Chlorinated Drinking-Water, Chlorination By-products: Some Other Halogenated Compounds, Cobalt and Cobalt Compounds, World Health Organization, vol. 52 (1991).
25. C. Munita and B. Mazzilli, J. Radioanal. Nucl. Chem., 108, 217 (1987); https://doi.org/10.1007/BF02164856.
26. D.G. Barceloux and D. Barceloux, J. Toxicol. Clin. Toxicol., 37, 201 (1999); https://doi.org/10.1081/CLT-100102420.
27. M.G.M. Alam, E.T. Snow and A. Tanaka, Plant Foods Hum. Nutr., 39, 279 (2003).
28. A. Sattar, M. Walid and S.K. Durrani, Plants Food Human Nutr., 39, 279 (1989);
https://doi.org/10.1007/BF01091938.
29. Turkish Food Codex (TFC), Official Gazette of Republic of Turkey, Notifications about Determination of the Maximum Levels for Certain Contaminants in Foodstuffs of Turkish Food Codex, Notification No: 2002/63, Issue: 24885 (2002) (in Turkish).
30. Joint FAO/WHO Expert Committee on Food Additives & World Health Organization. Evaluation of Certain Food Additives and Contaminants: Twenty sixth report of the Joint FA, Geneva (1982).
31. World Health Organization, Guidelines for Drinking-Water Quality, World Health Organization, vol. 1 (2004)
32. M. Tuzen, Food Chem. Toxicol., 47, 1785 (2009); https://doi.org/10.1016/j.fct.2009.04.029.
33. T.K. Grimsrud and A. Andersen, J. Occup. Med. Toxicol., 5, 7 (2010); https://doi.org/10.1186/1745-6673-5-7.
34. K.W. Barnes, Atomic Spectroscopy-norwalk Connecticut, 18, 84 (1997). 35. M.J. Franz, E.S. Horton, J.P. Bantle, C.A. Beebe, J.D. Brunzell, A.M. Coulston, R.R. Henry, B.J. Hoogwerf and P.W. Stacpoole, Diabetes Care,
17, 490 (1994);
https://doi.org/10.2337/diacare.17.5.490.
36. J.G. Bieri and M.C. McKenna, Am. J. Clin. Nutr., 34, 289 (1981); https://doi.org/10.1093/ajcn/34.2.289.
37. E. Zahir, I.I. Naqvi and S.M. Uddin, J. Basic Appl. Sci., 5, 47 (2009). 38. M. Ghaedi, A. Shokrollahi, K. Niknam, E. Niknam, A. Najibi and M.
Soylak, J. Hazard. Mater., 168, 1022 (2009); https://doi.org/10.1016/j.jhazmat.2009.02.130.
39. T.H. Lim, T. Sargent 3rd and N. Kusubov, Am. J. Physiol. Regul. Integr.
Comp. Physiol., 244, R445 (1983);
https://doi.org/10.1152/ajpregu.1983.244.4.R445.
40. A. Zahoor, M. Jaffar and M. Saqib, Nutr. Food Sci., 33, 203 (2003); https://doi.org/10.1108/00346650310499712.
41. J. Usero, E. Gonzalez-Regalado and I. Gracia, Environ. Int., 23, 291 (1997);
https://doi.org/10.1016/S0160-4120(97)00030-5. 42. J. Richir and S. Gobert, Mar. Pollut. Bull., 89, 390 (2014);
https://doi.org/10.1016/j.marpolbul.2014.08.030.
43. J. Richir, M. Salivas-Decaux, C. Lafabrie, C. Lopez y Royo, S. Gobert, G. Pergent and C. Pergent-Martini, J. Environ. Manage., 151, 486 (2015); https://doi.org/10.1016/j.jenvman.2014.11.015.
44. G.T. Bakirci, F. Cakmak and D. Özdemir, Ege Bölgesinde Satisa Sunulan Kuru Üzümlerde Okratoksin A ve Küf Iliþkisi.