Size-fractionated phytoplankton and nutrient dynamics in the inner part of İzmir Bay, eastern Aegean Sea
Tam metin
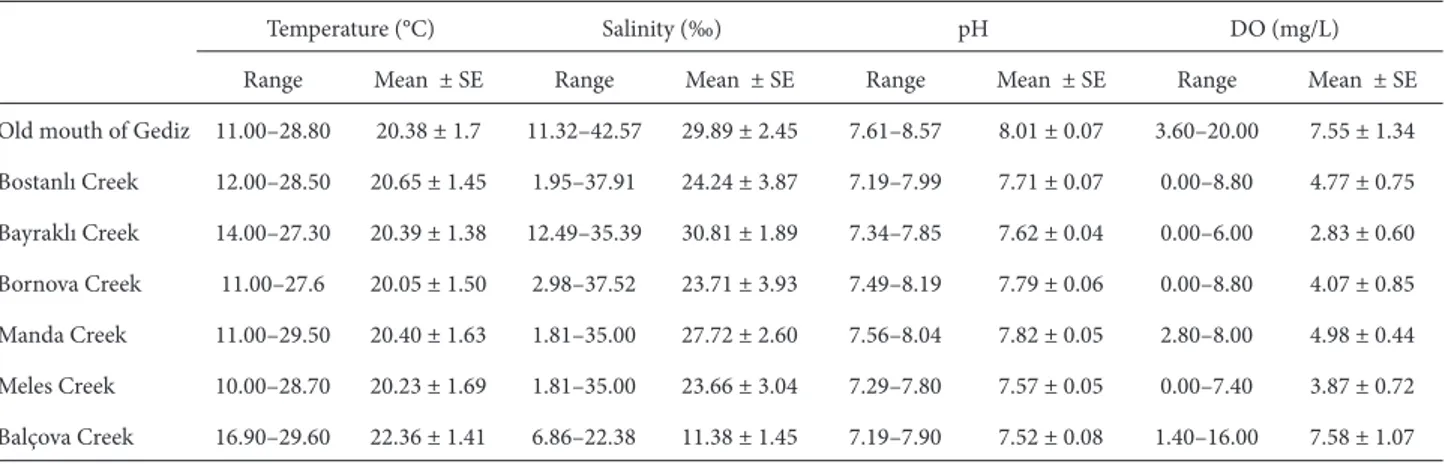
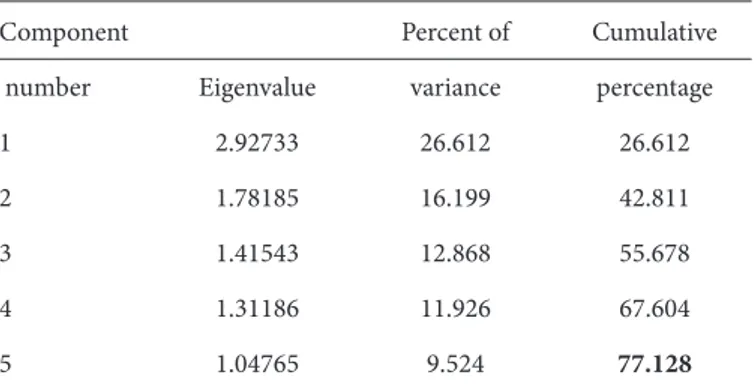
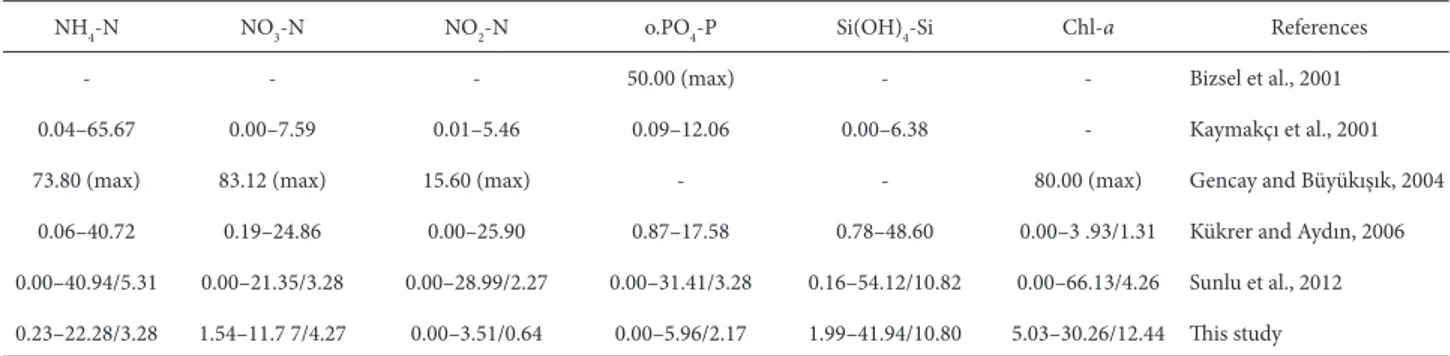
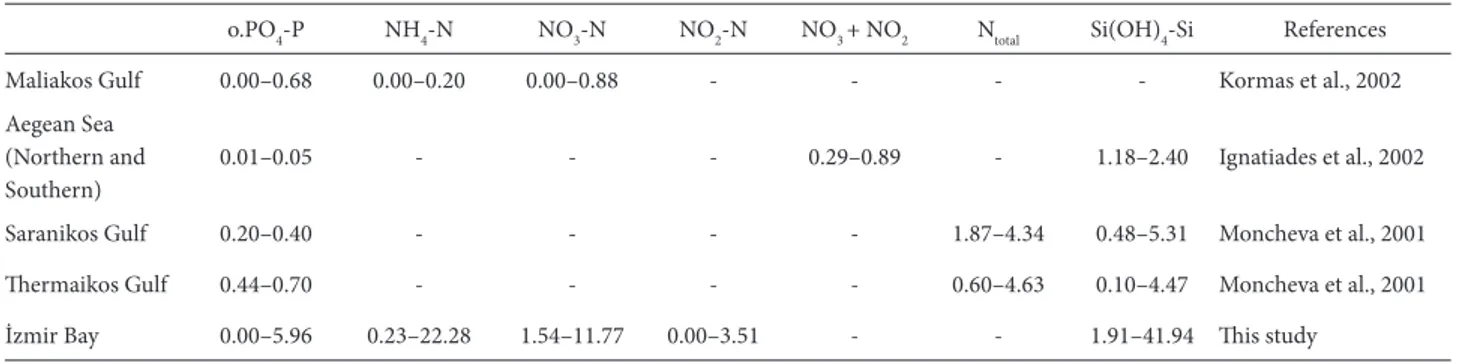
Şekil
Benzer Belgeler
The main channels of the impact of globalization on the changing structure and dynamics of unemployment in the Central, Volga Region and North Caucasus Federal
Torasik çıkış sendromu tedavisinde cerrahi genellikle başarılı sonuç verir, ancak bazı hastalarda cerrahi sonrası semptomlarda tekrarlama görülebilir ve bu hastalar
The nanoparticles are encapsulated by the regular SiO 2 gel and therefore the nanostructured silica film has smaller particles than the silica film with the same ratio of NH 3 /TEOS
Elde edilen bulgulara göre, genel aritmetik ortalama bağlamında polisler, meslektaşlarının mesleki etik dışı davranışları “Hiçbir Zaman” yap- madıklarını
Bu tez çalışmasında Trabzon İli Çaykara ilçesi için çığ tehlike gösterim haritasının coğrafi bilgi sistemleri (CBS) tabanlı olarak üretilmesi ve ayrıca koruyucu
Şimdi, pek sevdiği ve harab hayatım, kıyılarında sürükliyerek bitirdiği Bü- yükadanm münzevî bir köşesinde din - lenen Ahmed Refiği rahmet ve hürmet
Bunun için üç boyutlu olarak modeller hazırlanmış; delaminasyon alanlarının büyüklüğü, fiber oryantasyonları, sınır koşulları ve delaminasyonun plakadaki
From the Department of Radiology, University of Iowa Hospital and Clinics, Iowa City, Iowa (S.G.K.); Departments of Anesthesiology and Reanimation (L.D., Z.T.S., H.S.D.K.,
