1
The "You Have a Choice Hear My Voice" project have funded by Netherlands Istanbul Consulate Human Rights Fund and Basak Culture and Art Foundation and conducted by the partnership of Istanbul Bilgi University Center for Immigration Studies.
This publication was created with support from the Netherlands Istanbul
Consulate. In the last opinion of this publication in no way reflect the opinion of the Netherlands Istanbul Consulate.
“YOU HAVE A CHOICE HEAR MY VOICE”
Design: Halim YeşilCover: Elena La Rovere Print: Ak Basim
Project Coordinator: Ayşe Tepe
Project Advisor: Assistant Doc. Pınar Uyan Research and Report Writing: Ayşe Alnıaçık Field Coordinator: Hümeyra Tusun Yeğin Translation: Ulaş Karakoç, Alpkan Birelma
Basak Culture & Art Foundation
Kayışdağı Mahallesi, Uslu caddesi, Nihat Sokak No:55/A Ataşehir/İstanbul
Tel:0216 420 49 68 Tel&Fax:0216 540 24 62
2
FOREWORD
In 2010 SES-DUY research of Başak Culture and Arts Foundation investigating the impacts of forced migration on the children and youngsters, İstanbul Bilgi University Center for Migration Research participated as the project partner and provided academic support. With this Foreword, we would like to share some notes about the research and our acknowledgements as the Center.
In 2010 SES-DUY research, which aimed at repeating the Başak Culture and Arts Foundation’s 2004 SES-ÇIK research investigating the impacts of forced migration on the children and youngsters, the families interviewed back in 2004 were contacted again for assessment of their lives in Istanbul, especially on terms of life conditions of children and youngsters. However since the main goal of 2004 SES-ÇIK research was to scrutinize the psycho-social impacts of forced migration on children and youth and to provide psychological counseling afterwards, the current research is not an exact repetition of 2004 SES-ÇIK. At the preparation stage of 2010 SES-DUY field research, the child survey of “Child ‘Well-Being’” Research done with TÜBİTAK’s support, was prepared, carried out on the field and the data was received. Since SES-DUY’s target group is children and youngsters and its aim is to investigate their situation, with the permission and support of the research team some of the questions prepared for the “Child ‘Well-Being’” research were also used in this research. This enabled the report to make even though limited, three different comparisons: In line with the aim of the research, the first is the comparison of 2010 data with 2004 data based on the questions addressing children and youngsters; the second is the comparison of the “Child ‘Well-Being’” research’s data representative of Istanbul with the data about children and youngsters from families that experienced forced migration; and the third comparison, however limited, is between the data of Istanbul provided by TurkStat and the data about children and youngsters from families with forced migration experience.
We believe that these comparisons are very important. To find out what kind of support is needed by those families’ children and youngsters living in Istanbul in the last 6 years, the one and only way is determining their problems in an accurate manner and making them visible. This report is written to share the comprehensive information gathered through the research with a wider public, to show the emergent picture to the related parties, to create the opportunity for more detailed research and to propose solution.
3
While some of the data presented by the report support the findings of former researches, such as the finding that families that experienced forced migration have considerably economic hardship, the report also involves quite striking novel findings. To specify a few of these findings:
34.7% of participant households experienced at least one under-five year old child death.
33.2% of participant children and youngsters do not have a bed of their own. The main problem in the education especially for children is dropping out rather than enrollment.
The report moreover argues that while evaluating the return propensities of children and youngsters, “yes” and “no” as answers categorically excluding each other are inadequate. One third of the children and youngsters prefer the option of seasonal going and comings which implies the lasting of the bonds with Istanbul. As one can also conceive from the interviews presented as appendix at the end of the report, neither returning nor staying are voiced in a very clear way. Even when they are voiced in a clear way, there are still contradictory expressions. The fact that both options have pros and cons makes it harder for children and youngsters to prefer one of them. This situation of in-betweenness felt by everyone who migrates, is felt deeper by the children of families forced to migrate. For these children and youngsters having hardships such as poverty, deprivation and compliance with urban life, the questions of not wanting to be schooled, not wanting to work, or wanting-not wanting to return are wanting-not easily answered with “yes” or “no”. Even though one of these is voiced, what it really means for the children should be deeply investigated.
Indeed, each of the sections of this report could be investigated with more detailed qualitative and quantitative researches. Nevertheless one point remains to be underlined with greater concern: to make the lives of the children and youngsters, reflected as numbers and percentages in this report, healthier, happier and more livable, children and youngsters centric social policies must be urgently developed, hearing the needs they voiced and aiming at solutions. The data in this research and alike achieve their purposes if they are used as reference for policies aiming to solve the problems they raised.
4
As Istanbul Bilgi University Center for Migration Research, for the support they provided we would like to thank the Research Team of “Child ‘Well-Being’”; our dear friend Dr. Emre Erdoğan and Ebru Işıklı from INFAKTO Research Workshop; all the honored participants of the workshop organized to discuss the preliminary findings of the survey in Istanbul Bilgi University; our dear
Professor Ayşe Buğra suggesting us Ayşe Alnıaçık who meticulously carried out the research and the writing of the report.
This research, funded by the Human Rights Fund of the Consulate General of the Netherlands in Istanbul, would never be realized without the volunteers and interviewers of Başak Culture and Arts Foundation. Without them, the families participated in 2004 survey could never be founded, even if they did, it would never be possible that many families to be convienced to participate again. Those who realized this research are the project coordinator Ayşe Tepe who strived to solve all problems with her positive energy, the field coordinator Hümeyra Tusun Yeğin who performed this role in this tough field with a great devotion and Ayşe Alnıaçık who carried out each stage of this research and the writing of the report with her attention and meticulousness. And certainly ?? those adults, youngsters and children who participated in the research… We would like to thank them all for this research.
Pınar Uyan
5
TABLE OF CONTENTS
1.1. The Subject of the Research ...17
1.2. The Goal of the Research...17
1.3. The Methodology of the Research...18
1.3.1. The Universe of the Research ... 18
1.3.2 Questionnaires ... 20
1.3.3 The Characteristics of Sample ... 21
1.4. The Setup of Analysis ...22
CHAPTER II. THE ANALYSIS AND EVALUATION OF
RESEARCH DATA...24
2.1. The SocioDemographic Structure of the Households ...24
2.1.1 Age and Gender Composition ... 25
2.1.2 Educational Status ... 26
2.1.2.a Level of Education... 262.1.2.b The Reasons of Non‐enrollment and Dropout ... 34
2.1.3 Social Security Status ... 36
2.1.4 Working Life... 37
2.1.5 Health... 39
2.1.6 Quality of Life and Economic Conditions... 39
2.2 Findings about the Interviewed Children and Youth ...42
2.2.1 Health... 43
2.2.1.a Health Conditions... 442.2.1.b Accidents and Injuries... 46
2.2.1.c Child Deaths ... 49
2.2.1.d Migration and Health... 51
2.2.2 Education... 52
2.2.2.a Participation in Education... 53Literacy... 53
2.2.2.b School Experience... 57
2.2.2.c Family’s Support of Education... 61
2.2.2.d Reasons of Non‐Participation in Education... 63
2.2.2.e Migration and Education... 66
2.2.3 Employment... 68
2.2.3.a Child Labor... 682.2.3.b Employment of Youth ... 74
6
2.2.3.c Migration and Employment ... 792.2.4.a Relationships with Family... 80
2.2.4.b Relationships with Friends... 86
2.2.4.c Migration and Relationships... 88
2.2.5. Space... 90
2.2.5.a Home... 912.2.5.a Neighborhood ... 94
2.2.5.b City Life... 98
2.2.5.d Willingness to Return...105
CHAPTER 3: CONCLUSION...113
BIBLIOGRAPHY ...120
APPENDIX 1: INTERVIEWER’S FIELDWORK REPORT...121
APPENDIX 2: INDEPTH INTERVIEWS ...124
7
LIST OF TABLES AND FIGURES
Table 1. The information about the households in the
sample of the research SESDUY ...18
Table 2. Interviewed households...19
Table 3. Distribution according to the districts...20
Table 4. Age groups ...25
Figure 1. Age groups by gender ...26
Table 5. Level of education for those aged 40 and over ...27
Figure 2. Level of education of those aged 40 and over by
gender ...28
Table 6. Level of education in 2539 age group ...28
Figure 3. Level of education for the 2539 age group by
gender ...29
Table 7. Level of education in 1824 age group ...30
Figure 4. Level of education for the 1824 age group by
gender ...31
Table 8. Level of education in 1217 age group ...32
Figure 5. Level of education by gender for the 1217 age
group ...33
Table 9. Level of education in 011 age group...33
Table 10. Reasons of nonenrollment and dropout...34
Table 11. Social security status ...36
Figure 6. Social security status by age...37
Table 12. Working status by age ...37
Table 13. Women’s labor force participation rate by age .38
8
Table 14. Social security status of fulltime employees ...38
Table 15. Health conditions of the household population 39
Table 16. Ownership of house...39
Table 17. Quality of life ...40
Table 18. Total household income ...40
Table 19. Household’s perception of income/need ratio ..41
Table 20. Perception of inability to meet most basic needs
...41
Table 21. Chronic illness by age ...44
Table 22. Youth suffering from a chronic illness by gender
...44
Table 23. Chronic illnesses ...45
Table 24. Psychological disorder...45
Table 25. Psychological disorder by status of
education/work...46
Table 26. Anger/aggression, sadness, anxiety and fear...46
Table 27. Serious accident or injury by age ...47
Table 28. Youth who had a serious accident or injury by
gender ...47
Table 29. Household’s perception of income/need ratio
and serious accident/injury ...47
Table 30. Accidents and injuries experienced by children
...48
Table 31. Accidents and injuries experienced by youth ....48
Table 32. Child deaths ...49
9
Table 33. Age of child death...49
Table 34. The reason of the child death...50
Table 35. Household’s perception of income/need ratio
and child death...51
Figure 7. Gaining access to health services after migration
...52
Table 36. Illiterate children...53
Table 37. Illiterate youth ...54
Table 38. Enrollment ratio of children ...54
Table 39. Enrollment ratio of youth...55
Table 40. Nonstudent children’s level of education...55
Table 41. Nonstudent youth’s level of education ...56
Table 42. Failing a grade...57
Table 43. Work and failure ...58
Table 44. Having difficulty in following the courses ...58
Figure 8. Feeling oneself successful ...59
Table 45. Relationships with Teachers...60
Figure 9. Involvement in a fight and feeling of insecurity in
school ...61
Table 46. Family’s support of education ...62
Table 47. Household’s perception of income/need ratio
and the support of education ...63
Table 48. Reasons of dropout...64
Table 49. Hardship to meet the costs of education of the
children...64
10
Table 50. Household’s perception of income/need ratio
and level of graduation...65
Table 51. Household’s perception of income/need ratio
and the tendency to go on to education...65
Figure 10. Gaining access to education opportunity after
migration...66
Table 52. Educational and employment status of girls ...69
Table 53. Educational and employment status of boys...69
Table 54. Perception towards family’s economic condition
...70
Table 55. Concerns about the possibility that family gets
short on money ...70
Table 56. Profession groups ...71
Table 57. Weekly salary...71
Table 58. Positive experiences ...72
Table 59. Negative experiences...72
Table 60. Household care burden by gender...73
Table 61. Household care burden in relation to educational
and employment status...73
Table 62. Household’s perception of income/need ratio
and the household care burden...73
Table 64. Educational and employment status of the male
youth...74
Table 65. Labor force participation, employment and the
unemployment rates...75
11
Table 66. Perception towards the economic condition of
family...76
Table 67. Occupations...76
Table 68. Monthly wage ...77
Figure 11. Views on learning a profession and the feeling of
success at work ...78
Figure 12. Incidence of mistreatment and the feeling of
insecurity at work...78
Figure 13. Gaining access to employment opportunities ..79
Table 69. Degree of intimacy with mother and father...81
Table 70. Degree of intimacy with parents by age ...81
Table 71. Degree of intimacy with parents by gender...81
Table 72. Degree of intimacy with parents and
employment/education status ...82
Table 73. Households’ perception of the income/need ratio
and intimacy with parents ...82
Table 74. The perception towards gender inequality in the
family by age ...83
Table 75. The perception towards gender inequality in the
family by gender...83
Table 76. The perception towards gender inequality in the
family by educational status...83
Table 77. Impacts of the economic status and value
judgments ...84
Table 78. Happiness with family by age ...85
12
Table 79. Happiness with family by the perception of the
income/need ratio ...85
Table 80. Happiness with family by the
employment/education status ...85
Table 81. Secret sharing with friends by age ...86
Table 82. Secret sharing with friends by gender...86
Table 83. Secret sharing with friends by
employment/educational status...87
Table 84. Happiness with friends by age...87
Table 85. Happiness with friends by gender ...87
Table 86. Happiness with friends by
employment/educational status...88
Table 87. Happiness with family and the birthplace...88
Table 88. Happiness with friends and the birthplace...89
Figure 14. Migration and the problems in building
relationships with peers...90
Table 89. Housing problems...91
Table 90. Index of housing problems by gender...91
Table 91. The household’s perception of income/need
ratio and housing problems ...92
Table 92. The year of arrival in Istanbul and housing
problems ...92
Table 93. Facilities at home ...93
Table 94. Facilities at home by age...93
Table 95. Facilities at home by educational status ...93
13
Table 96. Household’s perception of income/need ratio
and the facilities at home...94
Figure 15. Satisfaction with neighborhood ...95
Table 97. Negative aspects of the neighborhood...95
Table 98. Negative aspects of the neighborhood by age ....96
Table 99. Negative aspects of the neighborhood by gender
...96
Table 100. Negative aspects of the neighborhood by the
educational status...96
Table 101. Feeling of insecurity in the neighborhood by
gender ...97
Table 102. Household’s perception of income/need ratio
and feeling of insecurity...97
Table 103. Feeling of insecurity in the neighborhood by the
year of arrival in Istanbul...98
Table 104. Frequency of going out of neighborhood ...99
Table 105. Frequency of attendance to cultural activities
(cinema, theatre and concert) ...99
Figure 16. Satisfaction with the city...100
Table 106. Decisions on life in Istanbul...100
Table 107. Negative perception of living in Istanbul by age
...101
Table 108. Negative perception of living in Istanbul by
gender ...101
Table 109. Negative perception of living in Istanbul by
educational status...101
14
Table 110. Negative perception of living in Istanbul by
birthplace...102
Table 111. Perception of income/need ratio and negative
perception of living in Istanbul ...102
Table 112. Feeling of insecurity in Istanbul by gender ...103
Table 113. The year of arrival and feeling of insecurity in
Istanbul...103
Figure 17. Demands for a livable place...104
Table 114. Willingness to return ...106
Table 115. Places they would like to live in if they chose
freely...107
Table 116. Willingness to return by gender...108
Table 117. Willingness to return by educational status .108
Table 118. Household’s perception of the income/need
ratio and willingness to return...109
Table 119. Willingness to return by birthplace ...109
Table 120. The most cited reasons of the willingness to
return ...110
Table 121. The most cited reasons of the reluctance to
return ...111
15
PREFACE
With project called SES –ÇIK (Don’t Make an Issue Lay Claim to) which was supported in the scope of "Micro-Projects Programme of European Initiative for Turkey 2001 , sponsored by European Commission Turkey Representative for the Democracy and Human Rights" in 2004, we had intended find solutions and make visible to the problems of children and young people who were victims of forced migration. Since "SES-ÇIK" project report published, many universities, academic communities, NGOs, concerned individuals and institutions that conducting a study of this area, were used as a source. After these projects, both from the need to update our foundation data and at the request of doctoral students and academic circles, we decided to do SES-DUY (Have a choice hear my voice) project. Bilgi University Research and Application Center for Migration that have respected academic research on migration and long-term cooperation with us, have agreed on proposed partnership with a great friendship.
We have expressed our solutions in numerous panels and meetings that we have participated by sharing "SES-ÇIK" data and the issues of forced migration that has a great place within our target group. In accordance the needs were determined by these data, both for making visible the problems of our target groups and our seven years continuing work with children and young people who are poor, disadvantaged and living at risk brought the question of what more can we do, into the agenda. To determine those needs, to observe changes in the lives of these people from 2004 to this day, we realized the project called “SES-DUY” that also reflects current problems.
"You have a voice hear my voice " project was conducted between December 1 2009-31 August 2010 in the total of 15 districts, 13 of them from Anatolian side and 2 European side of Istanbul Turkey Sultanbeyli, Atasehir, Kadıköy, Kartal, Pendik, Sancaktepe, Umraniye, Uskudar, MaltepeBeykoz, Tuzla, Sultangazi, Coach, Sisli, Gebze, Turkey) funded by Netherlands Consulate General of the Human Rights Fund and Basak Culture and Art Foundation and with the cooperation of Istanbul Bilgi University Research and Application Centre for Migration.
Overall results that we have reached in our research were that the required steps to improve the situation of families who forcedly migrated to other cities have not been taken. While the problems created by immigration maintaining, poverty deepened steadily, and the possibility of children and young people completing their training and benefit from social-cultural life, remained at low
16
levels. As there aren’t any policies developed to solve the problems of immigration these people have been left alone and ignored. This situation that they have to face wasn’t their choice from the beginning made it difficult for them to adapt cultural and social environment and has led to serious economic problems. Our goal, as well as to draw attention to the existence of these problems it is also sharing necessary improvement should be made in the living standards of victims of immigration with stakeholders and public.
Forced migration is an infringement of rights. People have had to leave their living territory outside of their own volition and their most basic rights of life and the safety are threatened. When the political and social consequences of this problem examine, hints are emerging about what needs to be done for solving the issues. For those who want to return to the places they migrated should be facilitated as well as the economic and social improvements of life in the city needed to be facilitated. At the same time, it is very important to solve the heaviest problems of those children and young people are facing in every area of life specially, in education and work and to create opportunities to strengthen their participation in social life. The elimination of disadvantage and risk of their lives directly linked with creating opportunities for them. How long the migration that seriously effects demographic and urban environment of cites and from time to time it forefront by political outcome will be ignored? We believe that every step towards the solution of migration will serve for social peace and serenity.
We thank to everyone who have contributed from the initial phase until the end of our project, our volunteers for their assistance and support, the survey participants families, children and young people for opened their doors, interviewers team conducting the field research with the dedication Yakup Narin, Perihan Alma (Berivan), Murat Çiçek, and Kadriye Kurt, Abdurrahim Erbek and the field coordinator Humeyra Tusun Yeğen organized the work area until very late . Assistant Prof. Pınar Uyan for her great contributions in every phase of the project, to Elena La Rovere for preparing cover graphics and banners, to Ulaş Karakoç and Alpkan Birelma for translation, to the sociologist Ayse Alnıaçık for preparing the project report for publication and to academicians and educators for offering us their opinions and suggestions.
Ayşe Tepe
17
CHAPTER I. THE CONTENT AND THE METHOD OF THE
RESEARCH
1.1. The Subject of the Research
In this research the data of Başak Culture and Arts Foundation’s research SES-ÇIK, 2004 which scrutinizes the impacts of forced migration on the children and the youth are updated with face-to-face interview technique. With the assumption that important changes may have occurred in the lives of those subjected to forced migration, this research scrutinizes to what degree forced migration continues to have an impact on the lives of the children and youth by re-visiting the households participated in the study SES-ÇIK. The research gathered information about to what extent those families who keep live in Istanbul since 2004 have an access to urban life and its opportunities, and especially information about children and youngsters’ experiences related to health, education, working life, living space and city.
1.2. The Goal of the Research
The goal of this research is to reveal the changes occurred in the living conditions of the families subjected to forced migration in the period they stayed in Istanbul. The content of the research is the determination of what kinds of changes occurred in the social and economic conditions of the families examined in the study of SES-ÇIK in 2004 and the impacts of the migration on the lives of the children and the youth. In this sense the psychological impacts of the forced-migration scrutinized in the study of SES-ÇIK is not covered in this research. This study wants to answer what kind of changes the family members experienced in Istanbul in the fields such as education, work, living standards, social relations, and the tendency to migrate back. Furthermore the children and youth are asked to interpret their experiences in the school, workplace, at home, in the neighborhood and Istanbul; these interpretations of the respondents are extensively covered in the study.
Compared to other researches done in this field, the most important difference of this study is not that it repetitively uses some essential questions of 2004 research, but that it also asks these questions to the same households. To what degree the families, which came to Istanbul with forced-migration and stayed in
18
the city, benefit from the opportunities provided by the urban life and whether there is any change in their participation in urban life are investigated. Since the goal is to make a temporal comparison of the impacts of the migration on the children and the youth, methodologically it is assumed that the children and the youth are agents of their own lives and thus their interpretations constitute the core of this research.
1.3. The Methodology of the Research
1.3.1. The Universe of the ResearchSince the sample is defined as the households participated in the study of SES-ÇIK in 2004, first of all the questionnaires of SES-SES-ÇIK and the addresses of the households are reviewed. At this stage a problem about the number of the households was realized. Although the number of households which were interviewed was declared as 500, we found out that the number of different addresses we have on the questionnaires was 430. When we reached the interviewees in 2004 through the addresses we have or through the volunteers of the Başak Culture and Arts Foundation participated in the previous research, we realized that some of the households interviewed were composed of the families living together at that time. Since the main goal of the research is to compare the interpretations of the children and youth in the determined issues, the sample of this research is identified to be 430 households based on the number of addresses in SES-ÇIK.
Table 1. The information about the households in the sample of the research SES-DUY
N %
Interviewed Households 353 82%
Cannot be reached 34 8%
Returned their hometowns 16 3.7%
Do not want to be interviewed 16 3.7%
Moved to the other cities 6 1.4%
Moved abroad 5 1.2%
Total (Number of households participated in the
19
In the fieldwork conducted in February, March and April 2010, 369 of the 430 households, interviewed in the project SES-ÇIK were reached. While 353 adults accepted to participate in the survey, 16 adults rejected due to various reasons. Even though 127 of the 352 households had moved to other addresses, they were reached by the volunteers of Başak Culture and Arts Foundation through the acquaintances of the households.
34 households which participated in the study of SES-ÇIK in 2004 could not be found in their addresses and their current contactinformation could not be found. It is observed that some of these addresses were in the very low quality living environments which might be considered as transition areas, so that some of those houses were demolished and the new houses were built in their places. 16 households returned to their hometowns due to economic or social reasons such as the wedding of the children as declared by their acquaintances. While 6 households moved to the cities outside the forced-migration zone such as İzmir, Adana, Mersin and Gaziantep; 5 households took refuge in other countries due to political reasons as declared by their acquaintances.
Table 2. Interviewed households
N %
Interviewed households (n=430) 353 82% Households interviewed in their new addresses
(n=353) 127 36%
The fact that in the present research, interviewing 82% of the households participated in the study SES-ÇIK is a very important indicator about the fieldwork. When the significant portion (36%) of households which have moved to different addresses also taken into consideration, the high ratio of the participation in the survey shows how the field work was conducted. The participation of the volunteers of Başak Culture and Arts Foundation which mediated the study of SES-ÇIK 2004 in the present research proved to be very effective in reaching the households and persuading them to participate in the survey again. Furthermore the fact that the interviewers were not unfamiliar with forced migration played an important role in the acceptance of the families to participate in the research.
The fieldwork was conducted in the metropolitan area of Istanbul, in its 15 districts, namely Üsküdar, Sultanbeyli, Maltepe, Kartal, Pendik, Beykoz, Tuzla,
20
Ümraniye, Kadıköy, Ataşehir, Sancaktepe, Sultangazi, Esenler, Şişli and Gebze. Compared to the districts covered by the study SES-ÇIK (Kadıköy, Üsküdar, Ümraniye, Sultanbeyli, Maltepe, Kartal, Pendik, Tuzla, Beykoz ) new districts are added due to the moving of the families, and rearrangement of the district borders of Istanbul in 2008.1 Unlike SES-ÇIK, the reason of making surveys in the European side of Istanbul and in Gebze is because families have moved into the neighborhoods.
Table 3. Distribution according to the districts
N % Sultanbeyli 68 19.26% Ataşehir 56 15.86% Kadıköy 34 9.63% Kartal 31 8.78% Pendik 29 8.22% Sancaktepe 28 7.93% Ümraniye 26 7.37% Üsküdar 24 6.80% Maltepe 19 5.38% Beykoz 19 5.38% Tuzla 15 4.25% Sultangazi 1 50.28% Esenler 1 0.28% Şişli 1 0.28% Gebze 1 0.28% Total 353 100.00% 1.3.2 Questionnaires
Unlike SES-ÇIK in this research two different questionnaires are prepared for adults and for the children/youth. Since the aim was comparison with the study of SES-ÇIK, in the questionnaires the topics and questions which should be repeated are defined at first. The questions about the demography of the households, their economic conditions, living quality, life after migration in
1 5747 numbered, "The Act about the Foundation of new Districts within the Frontiers of Metropolitan Municipality and the Making Changes in some Acts,” March 6, 2008.
21
Istanbul and will to migrate back to village, which were obtained in SES-ÇIK, are asked once more. By adding an “in-last-five-years” section to the adult survey, it is intended to evaluate the households’ economic conditions, social relations and their relationship with their children between the two studies. In the children/youth survey, the same questions, like the children/youth’s education and work life, family relations and their habits which were asked in SES-ÇIK are asked once more. Unlike SES-ÇIK children are asked to interpret their experiences in these fields. Moreover in the sections of “space” and “information about the post-migration period” new questions are prepared and the children/youth are expected to interpret their spatial experiences in scales of city, neighborhood and house.
The reason the questionnaire of 2004 is much modified in this research is that the two studies have diverging goals. The main goal of SES-ÇIK was to investigate the psycho-social impacts of forced migration on the children and the youth. In this sense besides doing the survey investigating the themes mentioned above, the children/youth were subjected to a psychological test and those in-need were provided psychological counseling. Differently, this study aims to reveal the changes experienced by the children/youth of the families which came to Istanbul due to forced migration and stayed in the city since the survey of 2004. Thus in the questionnaire the questions about spatial experiences of home, school, workplace, neighborhood and city are given particular emphasis. This study examines the changes occurred in the lives of those children/youth in these areas in a detailed way.2
1.3.3 The Characteristics of Sample
In the fieldwork of this study done by using household and children/youth surveys totally 879 people are being interviewed. The household surveys are done with 353 adults (60% women, 40% men) representing the households accepted to participate in the survey. The children/youth surveys are done with
2 This research, especially in the questionnaire for children and youth, made use of the questions formulized by the research group of Understanding Child
Well-being: Conceptualization, Assessment and Defining the Indicators supported by
TÜBİTAK (Project No: 108K235). By utilizing the concept of “well-being” this research composed of a quantitative study carried out in Istanbul and a
qualitative study focused on a neighborhood of Istanbul. The report of the research is completed in June 2010 but is not printed yet.
22
260 children aged between 11-17 and with 267 youth aged between 18-24.3 While 51.5% of the interviewed children are male, 48.5% of them are female. 62.5% of the youth are female, 37.5% of them are male.
The demographical information of 2379 people living in 353 interviewed households is attained through the household surveys subjected to the adults. In each household 6.7 people live on the average. The average number of children for a household is 5.2. 60% of the households declared that they have a monthly income less than 1,000 TL, 72% of them declared that they are indebted to a person or institution. The interviewed household migrated from their hometowns 18 years ago on the average. 21.6% of the adults, 38.6% of the youth and 40% of the children never visited their hometowns after they came to the city. These ratios correspond to the 32% of all interviewees.
1.4. The Setup of Analysis
Following the training of interviewers and plot research, the field work had began in February 2010 and completed in mid-April 2010. After the research the interviewers were asked to write a text revealing their ideas and experiences. One of the interviewers’ text is included at the end of this report (Appendix 1). In the research also several in-depth interviews are conducted to improve the comprehension of the results of the quantitative research which composes the main part of the report. Five interviews done with five people from the target population of the research are added at the end of the report (Appendix 2). After the completion of data entry at the beginning of May 2010, a workshop was organized in Bilgi University with the participation of scholars and experts working on the areas of migration and child and the preliminary results of the research were shared. The content of the research report was prepared by taking the views of workshop participants into account.
The household survey utilized in the fieldwork is used to analyze the socio-demographic structure of the participant households. These data provide important information to audit the situation of the households live in. This data analyzed in Chapter 2.1 is composed of the information about the households’ age and gender composition, educational, working and social security status,
3 In this study people under age 18 are defined as children following the international documents on “children’s rights” and TurkStat (Turkish Statistical Institute).
23
economic conditions and living quality. The data about economic condition and living quality acquired by the household survey are used as variables in the analysis of children and youngsters’ surveys.
The information obtained through children / young people surveys that applied to study is given wider space since it was the main focus of this research. By evaluating the questionnaire and preliminary results of the research, the chapters to be analyzed under distinct headings are determined as following: health, education, employment, family relations and relations with friends, spatial experiences of Istanbul in different scales such as home, neighborhood and city, and tendency to return. At the end of each chapter the relation of the chapter’s topic with migration and the information acquired from the comparison with SES-ÇIK research are discussed.
24
CHAPTER II. THE ANALYSIS AND EVALUATION OF
RESEARCH DATA
2.1. The Socio-Demographic Structure of the Households
This chapter presents the information declared by the adults representing the households participated in the research SES-DUY 2010 about those who live in the household and their living conditions.
• The profile of those adults interviewed is below:
• While 59.8% of those interviewed adults are women (n=211), 40.2% of them are men (n=142). 62.2% of the adults are 40 years old and above.
• 59% of the women (n=124) and 15.5% of the men (n=22) interviewed declared themselves to be illiterate. The ratio of those who do not have any formal school graduation but literate is 22.4% among women (n=47) and 48.6% among men (n=32). The ratio of those who graduated from primary school is 14.3% (n= 30) among women, and 48.8% among me (n=69). The last group of those graduated from higher grades than the primary school are 4.3% of women (n=9), and 13.4% of men (n=19).
• 33.6% of those adults declared not to be registered to any social security institution and 25.6% of them told that they have green card.
• While 30.3% of men are working in full-time jobs (n=43), 31% of them are working in part-time irregular jobs (n=44). 26.1% of men are unemployed (n=37) and 9.2% of them are declared that they not working due to reasons such as sickness (n=13). While 88.1% of women interviewed are housewives (n=185), 3.8% of them are full-time (n=8), and 5.2% of them are part-time irregular employees (n=11). While 4 women interviewed declared themselves to be unemployed (1.9%), one woman declared her selves to be unable to work due to reasons such as sickness. Only 2 men of those interviewed adults are retired (0.6%).
• 92.3% (n=325) of the interviewed adults are married, 5.7% (n=20) of them are widowed/divorced, 1.7% (n=6) are single.
• 19.5% (n=69) of the interviewed adults declared that they came to Istanbul in 1990 or before. While 35.7% (n=126) of them came in the period of 1991-1994; 36% (n=127) came between 1995 and 1999; and 8.8 % (n=31) between 2000 and 2004.
• 23.3% women (n=49) and 0.7% of men (n=1) expressed that they do not know Turkish.
25
With the household information table in the questionnaire the information of 2,377 people living in the 353 interviewed households about age, gender, education, work, social security involvement and marital status are received. Moreover adults who were interviewed are asked whether they have anyone in the household suffering physical or mental sickness. In this chapter besides these issues, the information acquired about the economic conditions of the households are also being scrutinized.
2.1.1 Age and Gender Composition Table 4. Age groups
N % 40 and over 478 20.1% 25-39 age 462 19.4% 18-24 age 508 21.4% 12-17 age 457 19.2% 0-11 age 472 19.9% Total 2377 100.0%
The analysis about the educational and working status of those living in the households is done according to the age groups presented in the Table 3. 965 people living in the households, corresponding to 40.6% of the household population, are the children and youth aged between 12 and 24 who are the real sample, this study focuses on. The fact that in the research 527 children and youth in this age range are interviewed is important in revealing that the potential concerns of that group about participation in the survey were overcame by the efforts of the interviewers to a great extent. 2% of the children of those interviewed in that age range are living away from their families due to reasons other than compulsory military service, wedding and education.
26
Figure 1. Age groups by gender50.1% of the household population is male (n=1,190), and 49.1% is female. The distribution of household population in the age groups by gender is presented in Figure 1.
2.1.2 Educational Status
In this section the level of education and the reasons of non-enrollment and dropout are presented according to the interviewed adults representing the household.
2.1.2.a Level of Education
The level of education of the household population varies crucially across age. The problem of participation in the formal education decreases to a great extent for the lower age groups. While almost half of the group of aged 40 and over is illiterate (47.3%), the largest group of the age group of 25-39 is elementary school graduates (37%) (see Table 4 and Table 5). However the problem of dropping out of school for the age groups of 25-39 and 18-24 is a common one. The ratio of those dropped out of primary school is highest in the 25-39 age group (17.5%), and second highest in the 18-24 age group (15.7%) (see Table 6). 76% of the 12-17 age group is registered to a school. Within the non-participants
27
in this age group the largest group is those graduated from secondary school but did not proceed (11%) (see Table 7). If these result are evaluated together it could be argued that with the urbanization the problem of enrollment in the formal education system is seriously declined, on the other hand high rates of dropout emerges as a problem among the generations experienced compulsory migration (see Table 9). Furthermore it is observed that the longer the time spent in Istanbul by the household, the longer the Istanbul born children are staying in school. This change in the households’ level of education emerged with urbanization does not vary across gender, but in each age group women’s level of education is lower than men’s.
Aged 40 and over
In the interviewed households there are total 478 people, 242 men and 236 women aged 40 and over.
Table 5. Level of education for those aged 40 and over
N %
Illiterate 226 47.3%
No graduation but literate 88 18.4% Elementary school graduate (5 years) 138 28.9% Secondary school graduate (8 years) 14 2.9%
High school graduate 10 2.1%
Academy or university graduate 2 0.4%
Total 478 100.0%
47.3% of household residents aged 40 and over are illiterate. The second largest group in terms of level of education is elementary school graduates constituting 28.9%, and the third largest group is those who did not graduate any school but can read and write. The presentation of the level of education by gender in this age group is in Figure 2.
28
Figure 2. Level of education of those aged 40 and over by gender
The presentation of the level of education with gender dimension is more striking. While 76% of women aged 40 and over are illiterate, 12% has no diploma but is literate. For men these ratios are 19% and 25% respectively. The ratio of elementary school graduates for women is 11, and for men 46%. For the women aged 40 and above the problem seems to be non-enrollment rather than dropout.
Aged 25 - 39
462 people aged 25-39 live in the households, whose 50.4% is male (n=233) and 49.6% is female (n=229).
Table 6. Level of education in 25-39 age group
N %
Illiterate 80 17.3%
No graduation but literate 127 27.5% Elementary school graduate (5 years) 171 37.0% Secondary school graduate (8 years) 42 9.1%
High school graduate 36 7.8%
Academy or university graduate 6 1.3%
29
17.3% of those aged between 25-39 are illiterate and 27.5% refers to those who did not graduate any school but are literate. Those who dropped out elementary school (17.5%) are represented in this group. The ratio of those graduated from elementary, secondary and high school seriously increased in this age group compared to the age group 40 and over. While the illiterate constitutes the largest group for aged 40 and over, elementary school graduates are the largest group in the age group of 25-39. The level of education by gender for this age group is presented in the Figure 3.
Figure 3. Level of education for the 25-39 age group by gender
Similar to 40 and over age group there are serious differences in 39-25 age group between men and women in terms of participation in the formal education. 31% of women are illiterate, and 33% of them are literate but did not graduate from any school. For men these ratios are 4% and 22% respectively. The ratio of elementary school graduates is 28% for women and 46% for men. While in this age group 16% of men are high school or university graduates, same ratio is 2% among women.
Aged 18-24
508 young people aged 18-24 live in the households. 46.7% of the youth is male (n=237), 53.3% is female (n=271).
30
Table 7. Level of education in 18-24 age groupN %
Never went to school, illiterate 30 5.9% Never went to school, literate 25 4.9%
Elementary school dropout 80 15.7%
Elementary school graduate (5 years) 62 12.2%
Secondary school dropout 32 6.3%
Secondary school graduate (8 years) 78 15.4%
High school student 56 11.0%
High school dropout 51 10.0%
High school graduate 62 12.2%
Academy or university student 24 4.7% Academy or university dropout 4 0.8% Academy or university graduate 4 0.8%
Total 508 100.0%
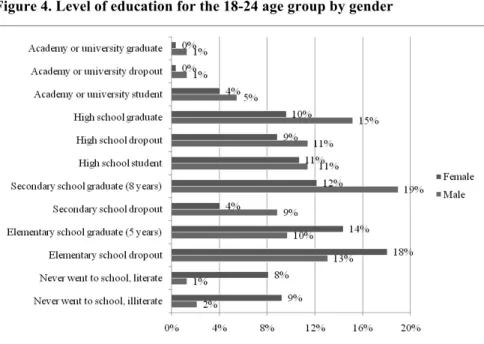
Compared to other age groups, the rate of illiteracy falls to 5.9% in the 18-24 age group. For this age group the problem related to the education is the problem of dropout rather than enrollment. Therefore the level of education for 18-24 age group is presented in Table 6 with the levels of dropping out. In this age group the ratio of those who registered to the upper level of education but dropped out later is 32.9%. The interviewed adults representing the households declared that 15.7% of the children and youth are elementary school dropouts. The ratio of those who did not graduate any school, but are literate is 20.6%. This ratio is very high than 5.5% calculated by using educational statistic of TurkStat for Istanbul.4 The reason of this difference is greatly due to the low rates of elementary school graduation of those children living in the interviewed households. This result should be related to the migration. 45.1% of the youth do not have secondary school diploma. The other important result is the low rates of 5.3% of the university graduates or students. The level of education for this age group by gender is presented in Figure 4.
4 See education statistics of TurkStat (Turkish Statistical Institution) conducted according to 2009 Address Based Registration System. Source:
31
Figure 4. Level of education for the 18-24 age group by gender
Even though for the women aged 18-24 the problem of participation in education is lower, it endures. 17% of women have never been in school, and 18% dropped out of elementary school. Those who graduated from secondary school and higher levels constitute 46% of women. 3% of men aged 18-24 have never been in school, and 13% dropped out of elementary school. Those who graduated from secondary school and higher levels constitute 65% of men. The women of 18-24 age group living in the households interviewed dropped out of formal education in lower ages than men.
Aged 12-17
456 children live in the households aged between 12 and 17. 52.4% of them are male (n=239) and 47.6% are female (n=217).
32
Table 8. Level of education in 12-17 age groupN %
Never went to school, illiterate 2 0.4%
Elementary school dropout 14 3.1%
Elementary school graduate (5 years) 13 2.9%
Elementary school student 220 48.2%
Secondary school dropout 16 3.5%
Secondary school graduate (8 years) 50 11.0%
High school student 127 27.9%
High school dropout 14 3.1%
Total 456 100.0%
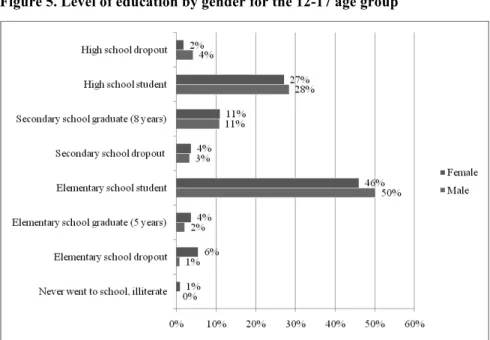
76.1% of children in the households aged 12-17 are students in high or lower schools. 23.9% of children are not registered to any school. The level of education in this age group is presented according to gender in Figure 5.
33
Figure 5. Level of education by gender for the 12-17 age group
The ratio of those registered to a school is 73.3% for girls, and 78.7% for boys. The two illiterates in this age group are girls. In this age group similar to 18-24, girls drop out of the educational system earlier than boys. 6.5% of girls and 0.8% of boys do not have elementary school diploma. The ratio of high school dropouts is 4% for boys, and 2% for girls.
Aged 0-11
472 children live in the interviewed households. 50.4% of the children are boys, 49.6% are girls.
Table 9. Level of education in 0-11 age group
N %
Is not going to school yet 224 47.5%
Preschool education 5 1.1%
Elementary and Secondary School Student 243 51.5%
Total 472 100.0%
In this age group 51% of the children are elementary and secondary school students. Only 5 children are participating in the preschool education. In this age
34
group there is not a dropout problem. Therefore the level of education does not vary across gender.5
2.1.2.b The Reasons of Non-enrollment and Dropout
According to declarations of interviewed adults about the household population, the reasons of non-enrollment and dropping out vary across age and gender. With urbanization the impacts of infrastructural problems of education system (nonexistence or distance of a school) diminishes completely, but the impacts of the families’ value judgments (such as not letting the girls to attend school) decrease gradually. These reasons are replaced firstly by economic problems experienced by families (age groups of 25-39 and 18-24) and secondly unwillingness to attend school (12-18). In the age groups of 25-39 and 18-24, namely the generations which experienced the migration in their ages of education, migration is declared to be as a reason of non-attendance. In table 9 the reasons of non-enrollment and dropout are listed for age groups according to the frequency of mentioning.
Table 10. Reasons of non-enrollment and dropout
Men Women Total
N % N % N %
School was
nonexistent / far 84 35% 103 44% 187 40% They did not let me
go / We did not let him/her go
39 16% 101 43% 140 30%
Economic problems 88 37% 16 7% 104 22% Aged 40 +
(n=473)
He/she did not want 17 7% 13 6% 30 6% Economic problems 106 47% 49 22% 155 35% They did not let me
go / We did not let him/her go
22 10% 106 48% 128 29%
He/she did not want 43 19% 19 9% 62 14%
School was nonexistent / far 25 11% 35 16% 60 13% Aged 25-39 (n=447) Migration 13 6% 1 0% 14 3%
5 It is stated that also in general Turkey has nearly overcome the gender inequality in elementary education (aged 6-13). See Hacettepe Nüfus Etütleri Enstitüsü, Türkiye’nin Demografik Dönüşümü, 2008.
35
Economic problems 70 37% 82 37% 152 37% He/she did not want 82 44% 49 22% 131 32% They did not let me
go / We did not let him/her go
7 4% 51 23% 58 14%
Failed in the exams 11 6% 8 4% 19 5%
School was
nonexistent / far 1 1% 15 7% 16 4%
Aged 18-24 (n=408)
Migration 4 2% 4 2% 8 2%
He/she did not want 27 52% 23 40% 50 46% Economic problems 12 23% 23 40% 35 32% They did not let me
go / We did not let him/her go
5 10% 7 12% 12 11%
Aged 12-17 (n=109)
Failed in the exams 3 6% 1 2% 4 4%
For women aged 40 and over the non-existence or distance of school ranks top (44%), while “not letting go” comes second (43%). On the other hand, for men economic problems comes first (37%), and followed by the non-existence or distance of school (35%).
For women aged 25-39 “not letting go” ranks first (48%), economic problems comes next (22%). For men economic problems keeps to stay on top (47%), while “not to want to go” comes next (19%). In this age group, migration mentioned firstly for men as a reason to drop out. In the age group 25-39.3% of the household population (14 people) is declared to drop out due to migration. 8 of these 14 people did not graduate from any school, while 4 of them are elementary school graduates.
In age group 18-24 economic problems ranks top for the whole group (37%) and women (37%). But for men most mentioned reason is “not to want to go” (44%). For women in this age group “not letting go” keeps maintaining its importance. It is declared that 23% of the women aged 18-24 did not let go to school. In this age group reflecting the rise in the level of education “failure in exams” is mentioned as a reason to drop out first time. 8 people declared to drop out due to migration is 2% of this age group, 7 of which could not graduate from any school. For the age group 12-17 most mentioned reason of dropout is the unwillingness of the child to go to school. Economic problems come next for the male and female children. Furthermore, 12% of girls and 10% of boys are
36
declared to be not let go to school. While the mentioning frequency of this statement does not seriously vary by gender, the same is not valid for economic problems. Economic strain is mentioned more for girls (40%) than boys (23%). By considering the fact that girls dropout from school in earlier ages than boys, we can state that gender still play an important role on family’s support on education.
2.1.3 Social Security Status
Adults interviewed as representatives of the households declared that while 45% of the household population aged 18 and above do not have any social security, 20% of the same population has green card.
Table 11. Social security status
Total N % Unregistered 644 45% SSK 435 30% Green card 286 20% Bağ-kur 66 5% Emekli Sandığı 8 1% Other 8 1% Total 1447 100%
In Figure 6, social security status is presented according to age groups. 56% of age group 18-24 have no social security, 14% of them have green card. While the ratio of those not having any social security in the age group of 25-39 is 41%, the ratio of those benefiting green card is 22%. While green card ownership rises to 24% for those aged 40 and above, the ratio of not having any social security falls to 36%.
37
Figure 6. Social security status by age2.1.4 Working Life
Striking results about working life of the interviewed households are high rates of irregular jobs, unemployment rate and women’s labor force participation (see Table 11 and Table 12). In this section the information provided by adults interviewed as representatives of their households are reviewed. 6
Table 12. Working status by age
40 + 25-39 18-24 N % N % N % Full-time 68 32% 170 60% 221 65% Irregular job 73 35% 68 24% 42 12% Unemployed 69 33% 46 16% 76 22% Total 210 100% 284 100% 339 100%
38
32% of the household population aged 40 and above are full-time employees, while 35% of them work at irregular jobs. The high rates of irregular employment in this age group are greatly due to the fact that father mostly work as construction workers. Furthermore the unemployment rate is highest in this age group (33%). In the age group of 25-39, 60% of the household populations are full-time employees, and 24% are irregular employees. Unemployment rate in this age group is 16%. In the age group of 18-25, 65% work full-time, 12% work irregularly. The reason of decrease in the irregular employment compared to other age groups might be related to the fact that the main sector for this age group is textile and garment. 22% of the household population in this age group is declared to be unemployed.
Table 13. Women’s labor force participation rate by age 40 + (n=236) 25-39 (n=229) 18-24 (n=271) Total (n=736) N % N % N % N % Women’s labor force participation 13 5.5% 60 26.2% 149 55.0% 222 30.2%
According to the information provided by the interviewed adults about working status of women aged 18 and above living in the households labor force participation rates seriously varies across age. 5.5% of women aged 40 and above, 26.2% of women aged 25-39, 55% of women aged 18-24 are declared to be employed or looking for a job. The rise in the labor force participation level can again be related with the fact that age group of 18-24 mainly employed in textile and garment sector.
Table 14. Social security status of full-time employees
Male Female N % N % SSK/Bağ-kur/Emekli Sandığı 172 54.4% 66 46.2% Green Card 24 7.6% 20 14.0% Unregistered 120 38.0% 57 39.9% Total 316 100.0% 143 100.0%
39
In Table 14 the social security status of full-time working men and women are presented. 38% of full-time employed men and 40% of full-time employed women are declared to be uncovered by social security system. Furthermore 7.6% of men and 14% of women have green card. In other words at least 53.8% of working women, and at least 45.6% of working men do not have social security at jobs they keep working. If we consider that spouses benefit from their partners’ social security, informal employment might be larger than those rates.
2.1.5 Health
26.4% of interviewed adults declared that some people in their households suffer from physical or mental illnesses. The illnesses are classified due to their characteristics and in the Table 15 the number and percentages of households having handicapped or chronically ill residents are presented. 8% of the households have a handicapped and 5.7% of them have a chronically ill person. Among the chronic illnesses most mentioned ones are asthma, rupture, heart failure and epilepsy. Furthermore 6 adults declared that they have family members suffering from psychological illness.
Table 15. Health conditions of the household population
N %
Handicapped (orthopedic, aural, visual,
speech and mental) 28 %8.0
Chronic illnesses 20 %5.7
Total 48 %13.6
2.1.6 Quality of Life and Economic Conditions
Interviewed adults were asked about the conditions of their houses. While the information about house ownership is presented in Table 16, the information about life quality is provided in Table 17.
Table 16. Ownership of house
N %
House owner 172 48.9%
Tenant 159 45.2%
40
The ratio of those owning the house they live appeared to be quite high (48.9%). But this ratio should be evaluated with the fact that a great number of the households interviewed are in the low-quality gecekondu (built over night) neighborhoods lacking proper infrastructure.
Table 17. Quality of life
N %
The house is without electricity 3 0.9% The house is not supplied by city water 7 2.0% Tap water is used as drinking water 211 59.9% Wood or coal stove is used for heating 270 76.7%
2% of the houses lack city water, while 1% of houses lack electricity. 59.9% of the households use tap water as drinking water. 13.9% told that they buy water with carboy, 26.2% declared that they get drinking water from a common fountain or well.76.7% of the households use wood or coal stove for heating. The average of rooms is 3.24 (including the sitting room) in the houses.
To scrutinize the economic conditions, the total household income and to what extent this income satisfies the basic needs of the household members are asked to the interviewees.
Table 18. Total household income
N % 450 TL and below 29 8.2% 451 – 600 TL 51 14.5% 601 – 750 TL 58 16.5% 751 – 1.000 TL 75 21.3% 1,001 – 1,200 TL 29 8.2% 1,201 – 1,500 TL 32 9.1% 1,501 – 1,800 TL 32 9.1% 1,801 – 2,400 TL 21 6.0% 2,401 TL and above 16 4.6%
60.5% of interviewed adults announced that the total household income is below 1000 TL.
41
Table 19. Household’s perception of income/need ratio
N %
Income does not meet basic needs 167 47.4% Can barely manage from one month to the other 116 33.0% Can subsist if do not buy anything unnecessary 57 16.2% The income is enough to live with ease 11 3.1%
Table 19 shows the groups related to perception of income/need ratio.7 47.4% of the adults report that their income does not meet the most basic needs. The ratio of adults declaring that they have an income enough to live with ease is 3.1%. It is remarkable that almost half of the households are in the lowest income group in terms of perception of income/need ratio.8
Table 20. Perception of inability to meet most basic needs
N %
Food – Not enough at all 73 20.7%
Fuel for heating – Not enough at all 102 29.0% Clothing - Not enough at all 68 19.3% Children’s education - Not enough at all 166 47.2%
The interviewed adults also were also being asked to what extent their household income can meet the needs such as food, fuel, clothing and children’s education. When these points are evaluated together it is striking that 47.2% of the
7 Since an important portion of the labor force participants of the interviewed households has been working in the irregular jobs (22%) or was unemployed at the time of interview (23%), the relation of economic conditions with other data will be evaluated according to perception of income/need ratio instead of total household income. The concept of the perception of income/need ratio is taken from the research called “Child Well-Being” mentioned in the second footnote. Since Child Well-Being research is conducted throughout Istanbul, its findings are often used in this research with the aim of comparison.
8 In the “Child Well-Being” research conducted in Istanbul, the rate of the households whose income is not enough to cover basic needs is 16.9%. This rate is very low compared to the rate of 47.4% found in this research.